Behavioral market segmentation: what it is and how to build it
 By Jan Suski, six years working in digital. How the scoring works.
·
The short version 13 points · 50 seconds
- 01Behavioral segmentation groups customers by observed actionPurchases, usage, and site behavior
- 02Gallup puts the sales-growth gap at 85% for these firmsCited in McKinsey's customer-data analysis
- 03Five documented types split the method upPurchase, occasion, benefit, loyalty, stage
- 04RudderStack puts the conversion gain at up to 3xA vendor figure, so treat it as directional
- 05Behavioral data comes from four main sourcesPurchases, product use, campaigns, support
- 06Event tracking at every touchpoint is the bottleneckThe analysis step is rarely what fails
- 07A working strategy runs five stages, in orderCollect, score, segment, activate, review
- 08RFM scoring ranks customers inside a segmentRecency, frequency, monetary value
- 09Demographic targeting is the cheaper program to runCircana says the data is easier to get
- 10NielsenIQ has a win on each side of that splitNike grew revenue 24%, Guinness found 6.1m
- 11Psychographic data is stated, behavioral data observedThe two disagree often enough to check
- 12Segments decay fast enough to need a standing reviewA model that scored well in Q1 can misfire
- 13Conversion, retention and satisfaction show it worksMoving one alone is a measurement problem
Behavioral market segmentation groups customers by what they do: what they buy, how often, when, and why. A 25-year-old in Ohio and a 52-year-old in Oregon can land in the same behavioral segment if both buy every Friday and abandon carts above $80.
This page covers the five documented types of behavioral segmentation, the data each one runs on, how to build a program from collection through activation, and where the method breaks down.
It's written for marketers and product teams choosing a target audience for campaigns, because a segment built on observed action predicts the next purchase in a way an age bracket can't.
What behavioral market segmentation is
Behavioral market segmentation divides a customer base by what people do with a product: purchase behavior, usage frequency, loyalty status, and the benefits they're chasing.
It sits alongside the demographic, geographic, and psychographic axes, and it's the only one of the four built entirely from observed action. Adobe draws the line by what each axis answers: demographic segmentation covers who a customer is, geographic covers where they are, and behavioral covers a customer's specific actions and how they engage with a brand.
The distinction shows up in practice. A customer can describe a preference in a survey and behave in a way that contradicts it, and only one of those two shows up in a transaction log.
It's a family of five methods, each grouping customers by a different action: what they buy, when they buy it, why they buy it, how loyal they stay, and where they sit in the buying process. A program built on any one type still counts, since all five score the same underlying thing.
Why behavioral segmentation is important
The commercial case is direct. McKinsey, citing Gallup research, reports that organizations acting on customer behavioral insights outperform peers by 85 percent in sales growth and more than 25 percent in gross margin. The same analysis puts the return on personalization built on behavioral tracking at five to eight times the marketing spend, with a sales lift of 10 percent or more.
The annual revenue increase TheDecisionLab reports for a large North American insurer after adopting behavior-based targeting. The same firm reports a 52% lift in monthly users for a national digital mental health platform.
RudderStack, a customer data platform vendor, states that targeted campaigns based on behavior can achieve up to 3x better conversion rates. That comes from a vendor with a product to sell, so treat it as directional. It does line up with the mechanism: a campaign built around what a customer already did converts better than one built around a demographic guess.
Segmenting by behavior also changes where budget goes. Instead of running one offer past an entire list, a team can route a discount only to customers showing cart-abandonment behavior, and route a loyalty reward only to customers past a purchase-frequency threshold. Campaigns stop being broadcast and start being addressed.
That turns customer data into decisions. A target audience defined by shared behavior converts on offers a demographic-only audience would ignore, which is the practical case behind any market segmentation program.
The five types of behavioral segmentation
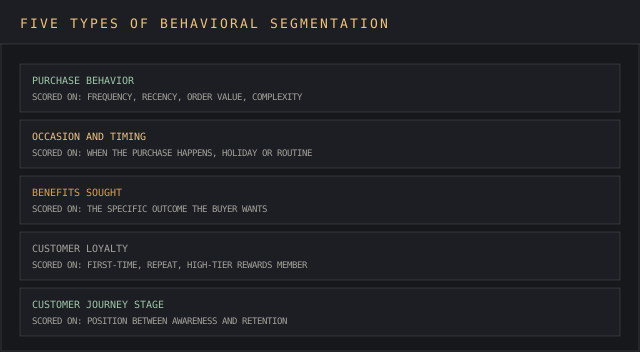
Five types recur across vendor and research documentation, and each one scores a different behavior.
Purchase behavior
Purchase behavior segmentation groups customers by what, how often, and how much they buy: frequency, recency, order value, and product complexity. A grocery chain might separate weekly staple-buyers from monthly bulk-buyers, because each group responds to a different promotion cadence.
Occasion and timing
This type segments by when a purchase happens: everyday buying against holiday buying, or a routine trigger like an after-work order. A retailer building an occasion segment for Black Friday targets a completely different customer than one building a segment for weekday commuters.
Benefits sought
Benefits-sought segmentation groups customers by the specific value they want from a product. Two toothpaste buyers can sit in different segments: one wants whitening, the other wants relief for sensitive gums. A single campaign pitching both messages wastes budget on half the audience.
Customer loyalty
Loyalty-based segmentation separates first-time buyers from repeat shoppers and high-tiered rewards members. It works as a spectrum, since a customer moves from first purchase to repeat purchase to program member, and each stage calls for a different message.
Customer journey stage
This type tracks where a buyer sits between first awareness and retention. Shopify notes that people don't tend to follow a linear path while shopping around online, so a segment built on stage has to update as a customer skips steps or doubles back.
Behavioral data and how to collect it
Behavioral segmentation runs on four categories of data:
- Purchase history: what was bought, how often, and at what value.
- Website and app behavior: pages visited, time on page, clicks, and feature use inside a product.
- Campaign interaction: email opens, ad clicks, and downloads.
- Support and survey data: tickets, satisfaction scores, and direct feedback. The smallest and least reliable of the four, because it depends on the customer volunteering it.
Collecting the first three requires event tracking wired into every touchpoint a customer crosses: the storefront, the app, the email platform, and the ad network. RudderStack and Adobe both describe this as the operational bottleneck. A team can own a segmentation model and still fail, because half its touchpoints never fire an event.
Teams that collect only through surveys miss the gap between what a customer says and what they do. Every step of a purchase, from first click to checkout, is logged, which is why attributing each signal to the system it came from matters more here than in any other segmentation type.
Usage rate is the data point that classifies customers by how often they interact with a product once they're inside it, separate from the purchase decision itself. It sits alongside session length, feature adoption, and repeat visits. Customer intent, the signal that a buyer is close to a decision, usually shows up in the usage record before it shows up in a survey.
Building a strategy, from collection to activation
A working program runs through five stages.
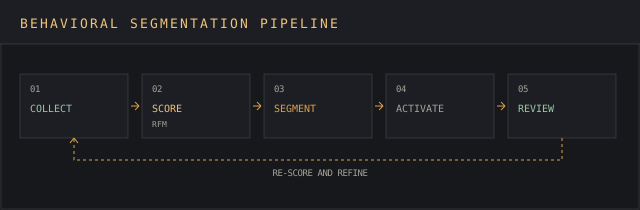
Collect. Gather behavioral data across every touchpoint, matched to a single customer identity.
Score. Rank each customer on recency, frequency, and monetary value, the three purchase-behavior dimensions RudderStack lists and the three the RFM acronym stands for: how recently they bought, how often, and how much they spent.
Segment. Group scored customers into the buckets the business will act on, either the five documented types above or a custom mix built for one program.
Activate. Route each segment to the campaign, offer, or product experience built for it, targeting customers who match a segment's live definition. Adobe calls out real-time activation specifically, because a segment computed once a month misses a customer who changed behavior three weeks ago.
Review. Behavioral segments decay, so a program needs a standing review cycle. A quarterly re-score is a reasonable floor; a business running real-time activation should re-score continuously.
Most segmentation tools package these five stages into one workflow, but the sequence is what matters. A segment built this way supports a different offer per group instead of one generic pitch to the whole list, and it feeds the same market intelligence strategy that governs every other standing data program.
Behavioral, demographic, and psychographic segmentation compared
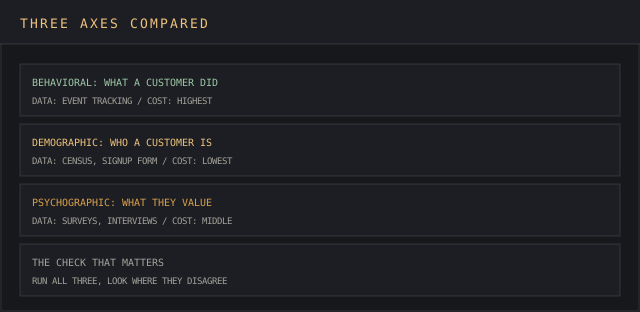
Circana, a market research firm, frames the tradeoff plainly: demographic segmentation is typically the more affordable way to segment a market, because it uses more easily accessible data sourced from credit reports or surveys. Behavioral segmentation costs more, because the data has to be tracked and inferred.
Circana reports up to 6x the return on investment from its own Complete Audiences product against competitors' audience-targeting solutions. That's the vendor's claim about its own product against rival products, so read it as a directional argument for behavior-based targeting.
NielsenIQ's own examples make the tradeoff concrete, with a win on each side. Nike grew revenue 24% by targeting women in athletic apparel through demographic segmentation, after research found female shoppers were willing to pay 40% more overall for stylish athletic apparel than men. That's a demographic win, built on a trait.
Guinness ran the opposite play. It found as many as 6.1 million people inside its Six Nations Rugby fan base who chose to avoid alcohol, a behavioral signal, and launched a nonalcoholic product against it. The launch faced widespread criticism over unclear messaging, a reminder that a correctly identified segment still needs a correctly built campaign behind it.
Psychographic segmentation is the third axis, grouping customers by what they think or feel. It relies on stated data: surveys, interviews, and self-reported values. Behavioral segmentation doesn't ask a customer anything; it watches.
The two disagree often enough that a business chasing accuracy runs both and checks where they contradict each other, instead of picking one and trusting it blind. Behavioral segmentation is also the axis that updates itself as the market moves, because it's scored from live behavior. Worked cases for all three sit on the market segmentation examples page.
Where behavioral segmentation breaks down
Three failure modes recur, and none of them argues against the method.
The first is oversimplified motivation. Two customers who bought the same product on the same day for opposite reasons land in the same segment, because the segment sees the purchase. A benefits-sought layer is the usual correction.
Decay is the second failure mode. Behavior shifts fast enough that a model scoring well in one quarter can misfire two quarters later with nobody changing a line of code, which is what the review stage exists to catch.
The third sits in the collection step. Data gathered without disclosed consent is a compliance risk regardless of how well the resulting segments perform, and the FTC's 2024 enforcement against location data brokers is the standing reminder of what that exposure looks like in practice.
Online retail shows how much signal is on the table when the collection works. Baymard Institute puts the average documented cart abandonment rate at 70.22%, calculated across 50 different studies, which separates loyal customers, occasional buyers, and cart abandoners into three tiers a plan can target differently. A retailer that treats those three the same spends budget reminding a loyal customer of an item they already bought.
Measuring the payoff
Three metrics show if a behavioral program is working. Conversion rate is the first and fastest to move: a segment built correctly should convert visibly better than an unsegmented broadcast, and RudderStack's 3x figure is the benchmark to test against.
Customer retention is the second, since a loyalty-stage segment that isn't reducing churn among at-risk customers isn't doing its job regardless of how clean the underlying data looks. Engagement, measured through repeat visits and product usage, tends to move with retention.
Customer satisfaction is the third, measured through the same surveys and NPS scores that feed the smallest and least reliable data category. That creates a useful check: if satisfaction and segment performance move in opposite directions, the model is scoring the wrong action. The market intelligence fundamentals that apply to any standing measurement program apply here too, and a program showing gains on all three at once is the one worth keeping.
FAQ
What are the main types of behavioral segmentation?
Five recur across the research: purchase behavior, occasion and timing, benefits sought, customer loyalty, and customer journey stage. Some vendors fold usage rate into purchase behavior instead of counting it separately.
What are examples of behavioral marketing?
A retailer emailing a discount only to customers who abandoned a cart, a streaming service recommending content based on watch history, and a bakery tagging orders by seasonal purchase pattern. Shopify documents this last one at Magnolia Bakery, which tags a customer who orders a pie for Thanksgiving so the same customer is already identified the following year.
Which factors count as a behavioral segmentation variable?
Purchase frequency, recency, order value, product usage rate, campaign interaction history, and loyalty tier are the variables that show up across documented models. Anything measured from an action qualifies.
Can market segmentation be based on personality?
Yes, but that's psychographic segmentation. Personality, values, and stated attitudes are self-reported traits; behavioral segmentation ignores what a customer says about their personality and scores only what they do.
What is RFM analysis?
RFM stands for recency, frequency, and monetary value: how recently a customer bought, how often they buy, and how much they spend. Scoring a customer base on those three dimensions is the common way to rank customers inside a behavioral segment.
How is behavioral segmentation different from psychographic segmentation?
Behavioral segmentation divides customers by observed action. Psychographic segmentation scores stated attitudes gathered through surveys and interviews, and a customer can claim one preference while behaving in a way that contradicts it, which is why the two methods sometimes produce different segments for the same person.
How often should behavioral segments be reviewed?
Continuously where a business runs real-time activation, and quarterly as a floor everywhere else. Behavior can shift inside a single sales cycle, so a segment built on last quarter's data can misclassify part of the customer base by the time a campaign ships against it.
Bottom line
Behavioral market segmentation groups customers by what they do, scored across five documented types: purchase behavior, occasion and timing, benefits sought, customer loyalty, and customer journey stage.
The commercial case is sourced. Gallup's research, cited by McKinsey, puts the sales-growth outperformance at 85 percent for companies acting on behavioral insights, with personalization returning five to eight times the marketing spend.
The cost is real too. Behavioral data has to be tracked through event collection at every touchpoint, scored on recency, frequency and value, and reviewed on a standing cycle, because behavior shifts fast enough to outdate a segment inside a quarter.
Personalized experiences built on a stale segment do more harm than a generic campaign, because a customer notices being mistargeted more than being ignored. Get the maintenance right and the method pays for itself across conversion, retention & satisfaction. Skip the review step and a team runs campaigns against a customer base that no longer exists.