A market segmentation example for each of the five main types
 By Jan Suski. I go deep on every review, checking every number against its source and digging up details other coverage misses, a habit from six years of SEO and link building for tech companies. Bylines at Surfer, Brand24, and Senuto. How the scoring works.
· Prefer this source on Google
The short version 11 points · 40 seconds
- 01A real example names a company, a source, and a numberA persona chart with a stock photo is not one
- 02Geographic segmentation runs on government census dataThe ACS publishes down to the block group
- 03Demographic segmentation groups buyers by a counted traitCoca-Cola printed 250 names chosen for teens
- 04Psychographic segmentation groups by values and lifestyleVALS sorts U.S. consumers into eight types
- 05Behavioral segmentation runs on what a buyer didNetflix, Spotify and Nike each built one
- 06Netflix put the cost of random picks at 16% engagementAgainst 4% for a simpler personalized model
- 07Nike's Reserved-for-you segment converts at up to 40xDisclosed at Nike's own 2017 investor day
- 08Firmographic segmentation treats the business itself as the customerDun & Bradstreet tracks 625 million entities
- 09Building a segment starts with the decision it changesFive steps, from objective to activation
- 10Most failures stereotype one trait and skip the behavioral checkA demographic label with no behavioral check
- 11A segment earns its keep if it changes what happens nextTrack lift against the whole-market baseline
A market segmentation example is a company's own documented record of splitting its market into groups and running a different offer, message, or channel against each one. A persona chart built in a workshop isn't that.
The five classic types, geographic, demographic, psychographic, behavioral, and firmographic, each answer a different question about a target audience: where the buyer is, who they are, what they value, how they act, and what kind of business they run. This page walks through one example per type, with the data source and the published figure behind each.
It's written for a marketer, product manager, or analyst who already knows the textbook definition and wants to see the variables applied against a real company.
What makes a market segmentation example worth citing
Three things separate a real example from a stock photo of sticky notes on a whiteboard: a named company, a named data source, and a number that shows what changed. A conversion rate, an engagement rate, a subscriber count, something a reader can check.
Most segmentation examples published online skip the third part. They describe Nike's style tribes or Starbucks' loyalty tiers, a dime a dozen with no source and no figure, which makes the example unfalsifiable.
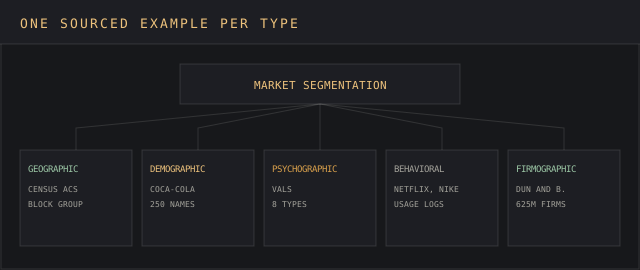
The five below carry both, and each feeds a different family of marketing strategies: geographic informs site selection, demographic informs message, psychographic informs positioning, behavioral informs personalization, and firmographic informs account tiering.
A company running all five at once is rare. Most build one segmentation strategy well before layering a second, and the strongest examples here each rest on a single, well-sourced dataset.
What segmentation buys a marketing budget
Segmentation concentrates a fixed budget on the buyers most likely to convert. Acquisition costs drop when a plan targets prospects who already look like existing customers, and retention improves when a sales strategy treats loyal customers differently from occasional buyers.
A CRM that tags accounts by segment turns that difference into a repeatable plan. A support team that knows a customer's segment routes a complaint to the right playbook, and a product team tracking feedback by segment sees which groups are churning before engagement gets out of hand and drops sitewide. The customer intelligence framework behind that tagging is what keeps the segment definitions consistent across departments.
Geographic segmentation: mapping a market with government data
Geographic segmentation groups a market by where people live or work: country, region, city, ZIP code, or climate. The U.S. Census Bureau's American Community Survey is the primary source most American retailers, banks, and franchise developers build on, because the lowest level of geography the ACS publishes is the block group, a geography smaller than a ZIP code.
A grocery chain deciding where to open a store, or a bank deciding which branch to keep open, pulls ACS tables for the surrounding block groups. The data is public and free, which is why geographic segmentation is usually the cheapest of the five to run and the first a small company adopts. Chains comparing many candidate sites at once load those tables into location intelligence platforms, which run from a $0 QGIS license to Esri's $25,281 Vendr median.
Geography alone misses why people in the same ZIP code behave differently, which is the gap the other four close.
Demographic segmentation: Coca-Cola's name campaign
Demographic segmentation groups a target audience by a countable trait: age, gender, income, education, or household composition. Coca-Cola's Share a Coke campaign is a documented case of one variable, age generation, driving a global campaign.
Per Coca-Cola's own announcement, the company swapped its logo on 20-ounce bottles for "250 of the nation's most popular names among teens and Millennials," added group names like "Family" and "Friends" to 1.25- and 2-liter bottles, and put nicknames like "BFF," "Star" and "Bestie" on 12-ounce cans. The release is dated June 10, 2014; fans could experience the campaign online beginning June 12.
The format was first introduced in Australia in 2012, and Coca-Cola went the whole hog from there: the campaign had already run in over 50 countries, including New Zealand, Argentina, Brazil, South Africa, Great Britain, Turkey, Germany, Spain and Chile.
The name list itself is a demographic filter applied to a physical product. Coca-Cola didn't personalize the drink; it personalized the label, using name popularity by generation to decide which 250 words would sell more bottles than a single generic design.
Psychographic segmentation: the VALS framework
Psychographic segmentation groups a market by values, attitudes, and lifestyle. Two people with the same age and income can sit in different psychographic groups, one buying gear that signals status, the other buying gear that signals self-reliance.
VALS is the most widely cited psychographic framework. Rice University's Principles of Marketing describes it as segmenting consumers into eight types: innovators, thinkers, believers, achievers, strivers, experiencers, makers, and survivors, on the premise that knowing what consumers are thinking tells a marketer which messages will attract them.
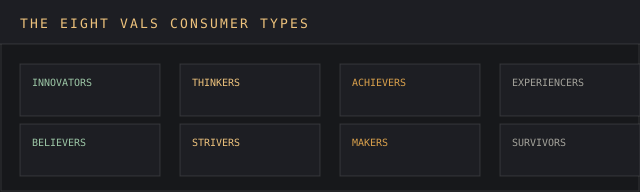
Psychographic segments are harder to measure than demographic ones, since nobody's driver's license lists their VALS type. Companies read between the lines of survey responses, purchase patterns, and media consumption to infer the data, so a psychographic strategy usually pairs with a behavioral dataset. The research methods behind that inference are the same ones any attitudinal study runs on.
Behavioral segmentation: Netflix, Spotify, and Nike
Behavioral segmentation groups a target audience by what they did: what they bought, watched, streamed, or clicked. It's the type with the most public, sourced examples, because usage data is what a digital product already collects.
Online retail runs a version of this every day. Baymard Institute puts the average documented cart abandonment rate at 70.22%, calculated across 50 different studies, a figure that separates loyal customers, occasional buyers, and cart abandoners into three tiers a plan can target differently. A retailer that treats those three the same wastes budget reminding a loyal customer of an item they already bought.
Netflix's recommendation model
a paper by Netflix researchers published the mechanics behind its personalization: a choice model weighted by each member's recent viewing history, tested against three baselines.
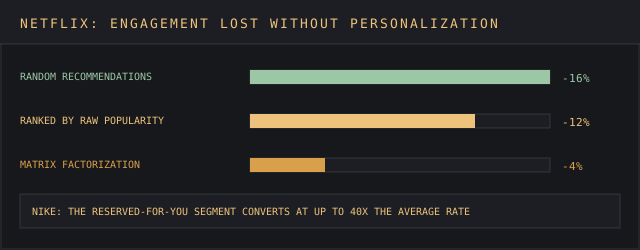
Reverting to random, popularity-ranked, or matrix-factorization algorithms would reduce engagement by 16%, 12%, and 4% respectively. The authors put the targeting effect, matching a specific title to a specific member, at roughly 7 times the mechanical exposure effect of surfacing more titles, precision hitting the nail on the head far more than volume alone.
Spotify's Discover Weekly
Spotify's Discover Weekly playlist, built on listening-history data, launched in 2015. Marking its tenth year on 30 June 2025, Spotify's own newsroom reported more than 100 billion tracks streamed since launch, and more than 56 million new artist discoveries every week, with 77% coming from emerging artists. Spotify reported 300 million premium subscribers in its Q2 2026 shareholder deck, per our music industry statistics report.
The logic behind it doesn't sort listeners into named buckets the way Coca-Cola sorted names by age. It builds a behavioral profile per listener from skip rates, replay counts & playlist saves, then matches that profile against other listeners with a similar pattern: segmentation running at the size of one person.
Nike's Reserved-for-you segment
Nike disclosed the mechanics of its NikePlus membership program at Nike's 2017 investor day. The program had passed 100 million members, grown at nearly 30% per year over the two prior years, with a stated plan to more than triple that over the following five years.
Members who shop through Nike's mobile apps spend three times what a guest spends on Nike.com. Inside the program, a segment called Reserved for you, built from a member's purchase and browsing history, knocks it out of the park, converting at up to 40 times Nike's average rate.
Firmographic segmentation: how B2B vendors slice a market
Firmographic segmentation applies the same idea one level up: industry, company size, revenue, ownership structure, and location become the variables, and the business itself becomes the customer record. It's the B2B counterpart to demographic segmentation, and it's what a sales team means when it splits accounts into small business, mid-market, and enterprise.
Dun & Bradstreet reports data on more than 625 million entities and more than 500 million professional contacts across a network spanning more than 190 countries, with more than 15 years of historical data and more than 65 million mapped corporate family-tree relationships. The company says its customers include 90% of the Fortune 500.
A software vendor pricing a new product pulls firmographic data to size each tier, the same way a retailer pulls Census data to pick a store site. Both are par-for-the-course location-and-size questions that a third-party dataset answers directly, with real figures behind the answer. The vendors selling those files are ranked in the B2B data provider rankings.
Building a segment from a company's own data
The five examples above each started from a different question. The order matters more than which variable a company picks first.
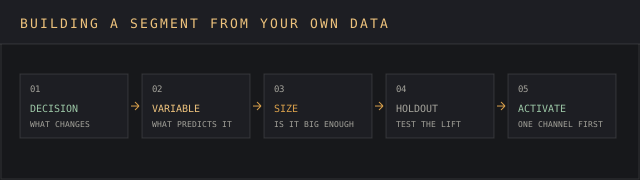
Start with the decision the segment will change: a price, a message, an inventory allocation, or a product feature. A segment that doesn't change a decision is a slide.
Pick the variable that predicts the decision. Age is easy to collect and often predicts nothing about purchase timing; recency of last purchase is harder to collect and usually predicts more about a buyer's next move.
Size each candidate segment before building campaigns around it. A segment with a few hundred members rarely justifies a dedicated campaign, a separate landing page, or a custom pricing tier, because the operational cost outruns the lift.
Test against a holdout group, the way Netflix tested its model against random and popularity-based baselines. Without a holdout, a 40x conversion on paper could just be the target market a company already had.
Activate through one channel first: an email send, a landing page, or a single ad set, and measure before rolling the segment into every campaign the company runs.
Focus groups, surveys, and web analytics collect the demographic, cultural, and purchasing detail behind step two, the raw material a team sifts through to cut to the chase on which persona matters. Building personas from that data only helps when each persona maps to a documented behavior a company can act on, which is where a standing market intelligence strategy beats a one-off research round.
Mistakes that turn a segment into a stereotype
Segmentation failures start with stopping at one demographic trait and calling it a segment. "Women aged 25 to 34" is a Census bracket. It says nothing about what that group values or how it behaves, which is why Coca-Cola paired its age-based name list with a physical product change.
A second failure is building a psychographic segment from assumption. VALS assigns type from survey responses, so skipping the survey and inventing the psychographic story produces a stereotype with a framework's name attached to it.
A third is treating a firmographic tier as static. A company's employee count, revenue, and ownership change, and Dun & Bradstreet maps 65 million corporate family-tree relationships specifically because ownership structures shift. A tier built once and never refreshed, with nobody assigned to keep an eye on it, drifts out of date within a year or two.
The same drift hits behavioral data that goes stale. Skipping a periodic refresh is what lets a demographic bracket quietly replace behavior as the working definition of the group, and the campaigns built on top keep running against a market that moved on. Keeping that current is the job the market intelligence fundamentals describe.
Measuring if a segment earns its keep
A segment is worth keeping only if it beats the whole-market baseline on the metric the decision was meant to move, raising the bar for the whole program. Netflix measured against three named baselines, because a 4% engagement loss only means something next to the 16% loss from random recommendations.
Track the same discipline on a smaller build: run the segment's campaign, message, or price against the standard treatment for the same period, on the same channel, and report the lift as a ratio.
A segment converting at 40 times the baseline, the way Nike's Reserved for you does, is a number a reader can check against the company's disclosed average. A segment described only as highly engaged is not, and neither is a program that reports one flattering channel and stays quiet about the rest. More worked cases sit on the market intelligence examples page.
FAQ
What is an example of market segmentation?
Coca-Cola's Share a Coke campaign is one documented example: the company printed 250 of the most popular U.S. names among teens and Millennials on 20-ounce bottles, using name popularity by generation to decide which labels would sell more units than one generic design.
What are the 4 types of market segmentation?
The four most commonly taught types are geographic, demographic, psychographic, and behavioral. A fifth, firmographic, applies the same logic to businesses and is standard in B2B sales and marketing.
What are the 6 main types of market segmentation?
Beyond the four consumer types and firmographic segmentation, some frameworks add technographic segmentation, which groups business buyers by the software and infrastructure they already run, since that predicts what they can integrate next.
How does Coca-Cola use market segmentation?
Coca-Cola's Share a Coke campaign used demographic segmentation, age generation via name popularity data, to select 250 names for bottle labels. The company's announcement is dated 10 June 2014, with the campaign going live online on 12 June, after an original 2012 launch in Australia and a rollout to over 50 countries.
What are 5 market segments?
Geographic, demographic, psychographic, behavioral, and firmographic cover the five most-used types, each answering a different question: where the buyer is, who they are, what they value, what they did, and what kind of business they run.
What is the difference between demographic and psychographic segmentation?
Demographic segmentation uses countable traits such as age or income; psychographic segmentation uses values and lifestyle, which isn't directly countable. The VALS framework sorts consumers into eight types by what they think and value, which is why two people of the same age and income can fall into different VALS types.
What data source do most geographic segmentation examples use?
In the United States, the Census Bureau's American Community Survey is the primary source. The block group is the lowest level of geography it publishes, a unit smaller than a ZIP code.
Bottom line
A market segmentation example only proves something when it names the company, names the data source, and reports a number a reader can check. Coca-Cola's 250 names, Netflix's 4% engagement loss against a 16% baseline, Nike's 40x conversion segment, and Dun & Bradstreet's 625 million tracked entities all clear that bar. A persona chart with a stock photo does not.
The five types answer five different questions, and the strongest programs get the best of both worlds by combining at least two inside one strategy. Coca-Cola paired a demographic name list with a physical product change; Nike pairs a behavioral trigger with a membership database of 100 million people.
Picking a variable that predicts the decision is what changes a price. Picking one only because it's easy to collect produces a segment that sits in a slide deck.
A named data source is what makes a segment testable against a holdout group. Assumption alone doesn't clear that bar. Without that test, a company can't tell if a reported lift is real or just the segment it already had, and its campaigns keep running against a group that was never different from the whole market to begin with.