Win-Loss Analysis Template
 By Jan Suski. I go deep on every review, checking every number against its source and digging up details other coverage misses, a habit from six years of SEO and link building for tech companies. Bylines at Surfer, Brand24, and Senuto. How the scoring works.
· Prefer this source on Google
This win loss analysis template answers the question every pipeline hides: why deals are won or lost, in the buyers' own words, logged the same way every time.
Win loss analysis identifies why deals are won or lost, and the numbers behind the practice are unusually strong: win-loss analysis can increase win rates by 10% or more, and continuous win-loss analysis improves sales performance by 10%+ in year one. Teams that outgrow a spreadsheet can compare the nine tools in our win loss analysis software ranking.
The win loss analysis template is part of our market intelligence templates library, and it downloads free in two pieces.
Download the Win-Loss Templates
Download the win loss analysis template (XLSX)An eight-field deal log plus a ratios sheet where win rates compute themselves.
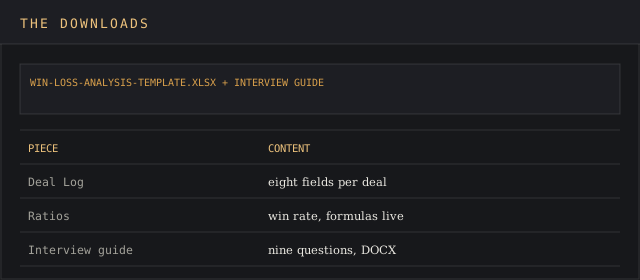
Download the buyer interview guide (DOCX)Nine questions with the reasoning behind each, sample questions included.
Both carry our branding; the loss analysis template arrives with an example deal logged, so the first real entry copies a pattern. Nobody has to guess at the format.
What Goes in the Template: Eight Fields
The ideal win-loss analysis template includes eight fields, and the limit is deliberate: strong templates limit choices, and limiting win-loss templates to 8 essential fields improves completion.
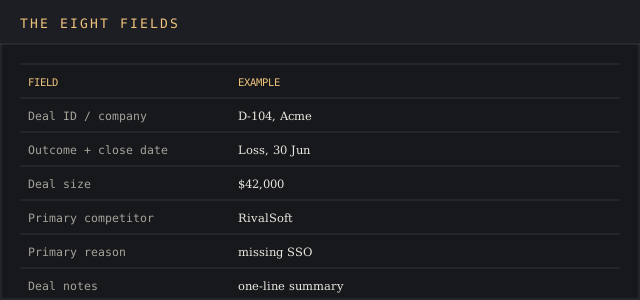
Key fields include deal identifier, outcome, and close date, followed by size, primary competitor, loss or win reason, and deal notes fields; the win loss analysis template keeps all eight on one screen, and the deal id keys everything, and customer names or a company name make the row traceable back to the CRM.
Deal notes carry the story: one sentence per deal, written while the memory is warm. The template makes the field small on purpose, because a one sentence summary gets written and a free-text essay does not.
The reason field forces detail the same way: fewer buckets, honestly chosen, beat twenty categories nobody applies twice the same way. Five categories cover most sales realities.
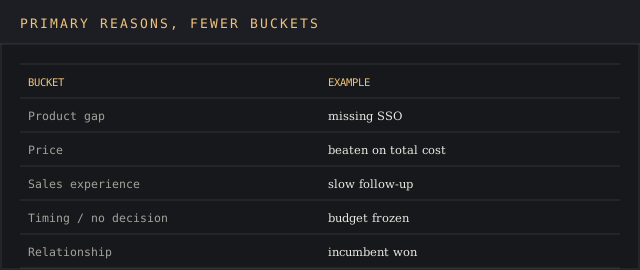
A win loss analysis template combines quantitative CRM data with qualitative buyer feedback: the log holds the quantitative data, the interviews supply the rest, and neither works alone.
Why Win Loss Analysis Pays
The practice compounds. Programs with continuous analysis see 84% win rate increase after two years, against the 10%+ that year one typically delivers.
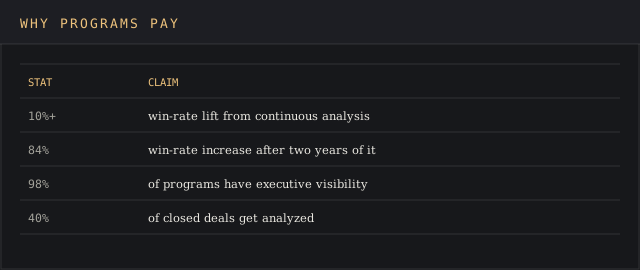
Adoption at the top is nearly universal where programs exist: 98% of win-loss programs have executive visibility, and 40% of closed deals are analyzed in win-loss programs, which leaves the other 60% of deals as unexamined tuition.
A win-loss analysis can help improve sales, marketing, and customer experience at once, because the same buyer feedback names the product gap, the message that missed, and the sales experience that grated.
Continuous analysis also helps identify market shifts before they impact sales: when the primary competitor column changes tenants, the market moved, and the log noticed first.
Win Loss Analysis, Step by Step
Win loss analysis runs on a five-step process, and the win loss analysis template holds every step's output.
First, teams log deals: every win, every loss, every stall, into the same eight columns, so the data accumulates without ceremony, and teams that skip weeks get gaps the data never forgives.
Second, teams interview. Win loss interviews with the buyers who just decided produce the customer feedback no CRM captures; win loss interviews also recover the deals the sales team misdiagnosed.
Third, analyze. Teams that analyze quarterly identify trends a single deal hides: patterns in pricing objections, in competitors named, in stages of the sales process where deals stall, and analysts who analyze by segment find the sharpest insights of all.
Fourth, report an executive summary: three headlines, one page, and the actionable improvements each headline demands.
Fifth, fix and re-measure. The win loss analysis becomes continuous improvement when the fixes land in the sales process and next quarter's data grades them; informed decisions each cycle, compounding.
The Buyer Interviews
Structured interviews produce richer insights than relying only on CRM notes, because CRM notes record what the sales team believed, and buyer interviews record what the buyer did.
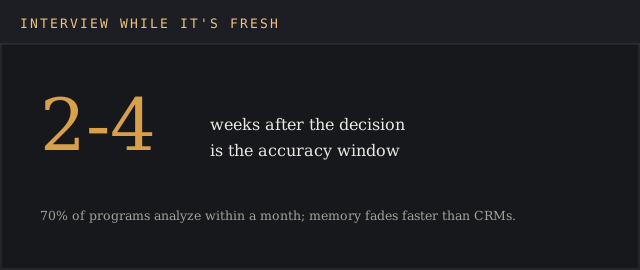
Timing decides accuracy: conduct interviews within 2-4 weeks of the decision, since interviewing within 2-4 weeks of a decision yields more accurate insights, and 70% of win-loss programs analyze deals within a month of closing for exactly that reason.
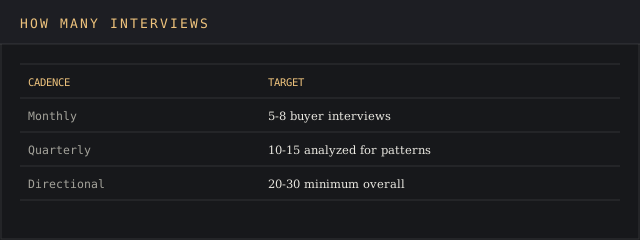
Volume matters less than cadence. Conduct 5 to 8 interviews monthly for effective analysis, analyze at least 10-15 interviews quarterly to identify patterns, and treat 20-30 interviews as the minimum for directional patterns; the first batch teaches you the questions, the second starts answering them.
Buyer feedback in win-loss analysis provides unbiased insight into customer preferences precisely because the deal is over: the buyer has nothing left to negotiate, so decision makers talk.
Interview both outcomes. Best practices for win-loss analysis include analyzing both won and lost deals, since wins teach what to repeat and a lost deal teaches what to fix; a no decision outcome deserves its own interviews too, because no decision is the quietest competitor in most pipelines.
Where interview volume outruns the team, AI-led interviews increase qualitative data coverage; a recorded, transcribed conversation still needs a human read, but the coverage jump is real. Our AI market intelligence guide covers the trade-offs.
Running the Loop
The win loss analysis template only pays inside a loop: log, interview, tag, report, fix, re-measure.
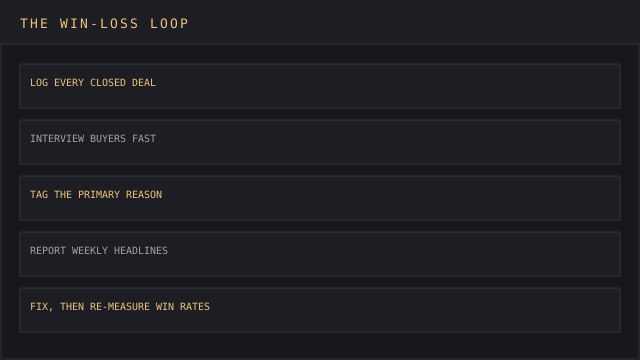
Log every closed deal the week it closes, wins, losses, and no decision alike; documenting the timeline and milestones is necessary for analysis later, when cycle length questions arrive, and the deals nobody logged are the insights nobody gets.
Tag the reason after the interview; the guess a rep logs and the answer a buyer gives agree less often than either expects, and the difference is the finding.
Then report. Summarize key findings for quick stakeholder reference, include top three headlines in executive reports, and distribute weekly flash reports to keep leadership informed; a structured reporting template turns raw rows into actionable insights the executive team reads in two minutes.
Insights and actions should be derived from the analysis findings on a schedule: regular reviews of win-loss data help track trends and inform strategy adjustments, and identify trends early enough that marketing strategies and the qualification process adjust mid-quarter, driving continuous improvement. That beats waiting for an annual postmortem.
Close the loop by re-measuring: calculating win-loss ratios provides insights into sales effectiveness, and the ratio's movement after each fix is the program's report card.
Pricing Findings
Pricing is the most claimed and least true loss reason, which makes pricing the best first test of the win loss analysis template.
Reps hear pricing objections because buyers use pricing as the polite exit; win loss interviews routinely reveal that the pricing complaint hid a product gap or a trust gap.
When pricing genuinely decides deals, the data shows a pattern: losses cluster in one segment, against one competitor, at one deal size, and the pricing fix targets exactly that cluster.
Teams that discount reflexively should read this section twice: cutting pricing to fix a non-pricing problem buys the same losses at lower margin. Our pricing intelligence rankings cover the tools that test real willingness to pay.
Competitor Findings
Competitors get named honestly once deals end, and the competitor column is where competitive intelligence starts paying for the program.
Watch which competitors appear, which competitors win, and which competitors merely lurk on shortlists; three different competitors demand three different responses.
The analysis also catches competitors arriving: a name appearing twice a quarter is early; five times is a trend, and the competitive intelligence team should already be building the card.
Feed every competitor finding into the battlecard: buyer quotes about why competitors won are the strongest counter-messaging raw material a sales team ever gets.
Sample Questions and Decision Drivers
The interview guide's sample questions map to decision drivers: the criteria that decided, ranked by the buyer. Sellers who guess at that ranking are usually wrong. The win loss analysis template logs each interview's top driver next to the deal.
The drivers split from the noise fast in buyer interviews: buyers volunteer the two things that mattered and forget the ten the RFP listed.
Ask about the buying committee too: who held the veto, which decision makers joined late, and where the buyer persona your marketing strategies target diverged from the person who signed.
Participation rate improves with small courtesies: a 20-minute cap, a no-sales promise, and a summary shared back; buyers accept more win loss interviews than most teams expect to get.
Product marketing owns the synthesis: the same customer feedback that names decision drivers also hands product marketing the words buyers use, and marketing strategies built from buyers' language convert better than ones built from positioning documents.
Who Uses the Findings
Sales leadership reads the ratio and the reasons; sales reps read the deal notes for the accounts they lost, and sales reps who read them close the gap fastest; the sales team hears the headlines weekly; and the sales process absorbs the repeated findings, one stage at a time.
Product marketing gets the sharpest material: a missing feature named by five buyers beats any internal debate, and product marketers turn the same quotes into positioning that answers the objection before it forms. Product teams read the same rows for the roadmap; the competitor battlecard template absorbs the competitive findings directly.
Competitive intelligence teams track the primary competitor column across quarters: when one rival's share of losses grows, that revenue impact justifies a deeper look, and when multiple competitors fade from the column, the market may have consolidated around a buying committee's shortlist of two.
Customer needs surface here too: what buyers say in the final decision often names needs the sales process should have caught in discovery, and the fix belongs upstream of pricing; the data says so more politely than buyers do.
Reading the Results
Failure patterns hide in aggregates, so cut the data three ways: by reason, by primary competitor, and by deal size.
Worth noting: the deadliest finding is rarely dramatic. Deals lost to no decision at twice the average cycle length usually mean qualification admits deals it should filter, and fixing intake beats fixing closing; teams that analyze the no-decision column first often find their fastest win.
Real data beats sales experience folklore here: sales organizations believe they lose on price until the buyer interviews say otherwise, and the template makes the correction painless because the evidence arrives one deal at a time.
Key points travel further in one sentence each: "we lose enterprise deals at security review" moves a roadmap in a way a forty-row export never will. Better thinking comes from fewer buckets and sharper sentences; a good example beats a great average.
A Worked Example
An example makes the win loss analysis concrete, so here is one quarter of data from a mid-market software team's template, with insights the team acted on.
The team logged 42 deals: 17 wins, 21 losses, 4 no decision. The win loss analysis template's ratios sheet put the win rate at 44.7%.
Cutting the data by reason, the team found 8 of 21 losses tagged to one missing integration; cutting the deals by competitor, 6 losses named the same rival; and the biggest deals stalled at security review.
The interviews sharpened each finding: buyers praised the product, faulted the process at legal, and named the integration unprompted in five conversations.
Three fixes followed: the integration moved up the roadmap, a security pack shipped to sales, and qualification gained one question in the sales process. Next quarter's win loss analysis graded the work: win rate up four points, with the insights trail to prove why.
Every team's example will differ; teams that analyze their own quarter this way find the template's job is making the story this legible.
Making the Template Stick
Templates fail socially before they fail structurally, so make the win loss analysis template easy to love.
Pre-fill what the CRM already knows: deal id, close date, value, and company arrive automatically, and reps only add the reason and the note. The best win loss analysis template asks humans for exactly what systems cannot supply.
Review the template quarterly like any instrument: if a field goes unfilled across teams, cut it; if analysts keep deriving the same extra column, promote it into the win loss analysis template officially.
And publish the insights where deals happen: a monthly one-pager in the sales channel keeps the loss analysis visible, and visible analysis is the analysis teams keep feeding.
Win-Loss Records, Charts, and Sheets
The same eight-field structure answers the spreadsheet questions that bring most people to this page.
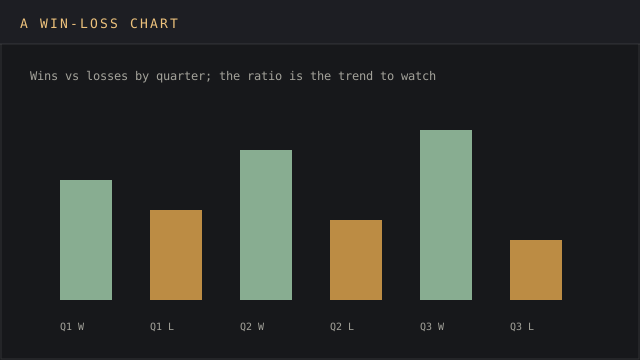
How to write a win/loss record: one row per deal with outcome and date, and the record is whatever the log accumulates. How to record wins and losses: the same way, immediately after close, with the primary reason tagged.
In Google Sheets, import the XLSX and the formulas carry over: COUNTIF totals wins and losses, and the ratio divides them; a win-loss chart in Sheets is an insert-chart away, wins and losses as paired columns per quarter.
In Excel the path is identical: log deals, let the ratios sheet compute, select the quarter totals, and insert a column chart. A win-loss chart is that pairing drawn over time, and the trend line is what to watch.
FAQ
How to do a win-loss analysis?
Log every closed deal in the eight-field template, interview buyers within 2-4 weeks, tag the reason, report the top three headlines, fix the biggest pattern, and re-measure win rates next quarter.
How to write a win/loss record?
One row per deal: deal id, company, outcome, close date, size, competitor, reason, notes. The download above is exactly that record with the ratios pre-built.
How to record wins and losses?
At close, well before quarter end; memory decays fast enough that a week's delay blurs the reason column, and that column is the point.
How to make a win/loss record in Google Sheets?
Import the XLSX into Sheets; the COUNTIF and ratio formulas survive the import, and the log works identically with the whole team editing.
What is a win-loss chart?
Paired columns of wins and losses per period, usually quarterly, with the ratio as the line to watch; it turns the log into a trend leadership reads at a glance.
How to create a win-loss chart in Excel?
Select the quarterly win and loss totals from the ratios sheet and insert a clustered column chart; add the win rate as a secondary-axis line if leadership prefers one number.
How to make a win-loss chart in sheet?
Same totals, Insert > Chart, column type; Sheets suggests the pairing automatically once the totals sit side by side.
Is there a SWOT analysis template?
Yes: our free SWOT analysis template covers the four-quadrant method, and win-loss findings feed its strengths and weaknesses quadrants with evidence.
Bottom Line
Win loss analysis is the cheapest coaching a sales organization can buy: the buyers already know why deals close, and the win loss analysis template is how their answers accumulate into strategy. Insights per deal are small; insights per hundred deals run the roadmap.
Download the log and the interview guide, book the first five interviews, and let the loop run; the win loss programs that compound into an 84% lift are the ones that never stopped, and the example worth copying is the team that treats every closed deal, won or lost, as prepaid research. Our sales intelligence rankings cover the platforms that feed the log automatically.