Publishing industry statistics: US revenue, book sales and market size data
 By Jan Suski. I go deep on every review, checking every number against its source and digging up details other coverage misses, a habit from six years of SEO and link building for tech companies. Publishing is also a field I trained in directly: I hold a diploma in desktop publishing and passed the professional exams for Digital Graphic Process Technician, certificates on file. Bylines at Surfer, Brand24, and Senuto. How the scoring works.
· Prefer this source on Google
The numbers US and Canadian publishing, checked 30 August 2026
Revenue grew because readers paid more per book. Traditional-channel output barely moved.
Self-publishing accounts for 84.6% of new US titles and a fraction of tracked industry revenue at the same time.
Six research firms price the global market up to 60% apart for the same year, because they don't count the same activities.
Canadian publisher margins are falling even as revenue rises, on the same paper and shipping costs squeezing US publishers.
Books with heavy AI-generated text are a fifth of one tracked ebook catalog and a fifth of its sales, up from near zero in 2023.
I'll write a 2,500+ word report on the slice you name, every figure linked to its source. Yours to publish, from $200.
The US publishing industry generated $33.4 billion in revenue in 2025, up 2.5% from $32.5 billion in 2024, according to the Association of American Publishers. That headline sits next to a second number nobody in the trade press connected to it: publishers registered 4.17 million new ISBN titles the same year, and 84.6% of them were self-published. Revenue grew because readers kept paying more per book. Traditional-channel output barely moved.
This report pulls current US and Canadian revenue, unit-sales and title-count figures from the bodies that collect them, to help publishers, authors and analysts understand how much readers spent and why global market-size figures disagree by tens of billions for the same calendar year. It's one of several market intelligence examples we publish for a single vertical; the rest of our category reports cover software, and this one's built the same way.
The gap between "revenue is up" and "output is up" is the real story of 2025. Cost pressures on paper, shipping and distribution commissions are the reality behind healthy-looking sales figures, and the numbers below show exactly where that pressure lands.
Why the headline numbers don't agree
Six research firms priced the 2025 global book-publishing market between $97.7 billion (Research and Markets) and $156.6 billion (Grand View Research), a 60% spread for the same year. Straits Research landed at $136.1 billion, Metastat Insights at $144.9 billion, Market.us at $120.0 billion and Future Market Insights at $103.7 billion.
| Research firm | 2025 global market-size estimate |
|---|---|
| Research and Markets | $97.7 billion |
| Future Market Insights | $103.7 billion |
| Market.us | $120.0 billion |
| Straits Research | $136.1 billion |
| Metastat Insights | $144.9 billion |
| Grand View Research | $156.6 billion |
Copy these lines into an email, fill them in and send. I reply with scope and a price within 2 to 3 business days.
Open the emailEach row is that firm's own headline estimate for calendar year 2025. See below for what differs in scope and method between them; the figures aren't a like-for-like comparison without that context.
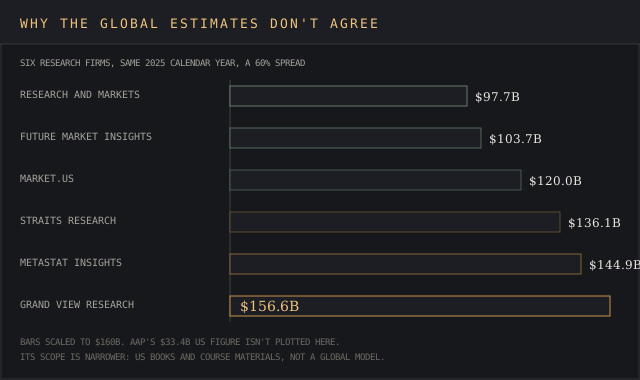
The $58.9 billion spread comes from scope: some firms count trade books alone, others fold in course materials, professional and scholarly publishing, or print-on-demand services sold as a separate line, and some model publisher-reported revenue while others model retail sell-through, which counts a different dollar at a different point in the supply chain.
AAP's $33.4 billion figure is narrower and more traceable than any global estimate: it's US-only, covers books and course materials, and is built from publisher submissions, Census Bureau data and Circana's point-of-sale panel, with no market model behind it. The narrower the definition, the more the figure can be checked.
North America's share of the global estimate
Regionally, Grand View Research puts North America at 33.2% of its $156.6 billion global estimate, or roughly $52 billion, the largest single region in its model. That share lines up with AAP's US-only figure sitting well below any global total: one country can hold a third of the category and still be a fraction of the worldwide number.
US ebook sales, audiobook sales and print revenue
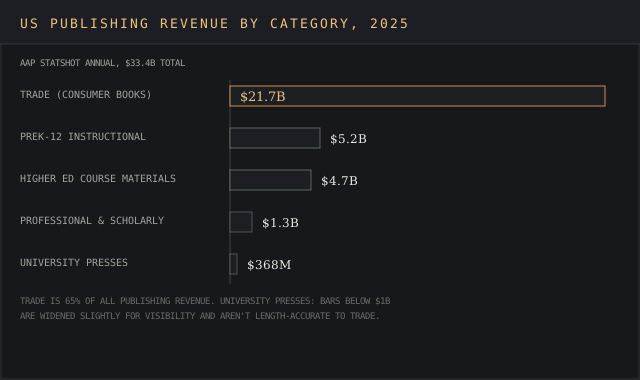
Trade (consumer book) revenue reached $21.7 billion in 2025, up 2.7%, building on 4.4% growth to $21.2 billion in 2024. Religious presses posted the largest single-category gain, up 9.3% to $2.2 billion, while adult fiction grew 3.9% to $7.1 billion and adult non-fiction grew 1.3% to $6.0 billion. Both categories grew; neither swung the way some secondhand market commentary has claimed.
Want a revenue-by-category chart like this for your list? Send the categories.
Email a briefPrint books still carry the industry: hardback and paperback formats made up 50.6% of total publisher revenue, and within trade publishing specifically, the two formats combined for 73.1% of revenue. Hardback revenue rose 3.9% to $8.2 billion; paperback rose 2.1% to $8.0 billion. Digital formats (audiobooks and ebooks) made up 14.2% of total revenue, up 4.3% year over year.
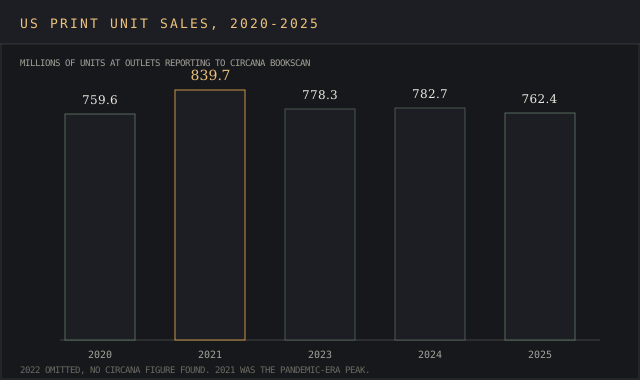
Unit sales tell a tighter story than dollar revenue. Circana BookScan counted 782.7 million print units sold in 2024, the first annual increase in three years and up from 778.3 million in 2023. Sales rose again in 2025, to 762.4 million units, a 0.3% gain by Circana's own year-over-year count, a second straight annual increase.
Both years remain below the 839.7 million sold at the 2021 pandemic-era peak. Online retail remained the largest sales channel at $12.3 billion, up 3.1%, ahead of physical retail's $6.7 billion.
BookScan revises its retailer panel most years, so the 782.7 million and 762.4 million totals rest on different underlying store coverage. A plain subtraction between them works out to a 2.6% drop, but Circana's own panel-consistent year-over-year calculation puts 2025 at a 0.3% gain, and that consistent calculation is the one this report cites.
Younger readers are a documented part of that rebound. In a Publishers Association-backed survey covered by the World Economic Forum, 68% of Gen Z readers said #BookTok had led them to read a book they might not have picked up otherwise, and 49% of those readers went to a physical store to buy it. NPD Group data credits the platform with helping sell 20 million print books in 2021 alone.
Who publishes it: major houses and where trade revenue concentrates
Penguin Random House, HarperCollins, Simon & Schuster, Hachette Book Group and Macmillan are the five publishing houses most commonly grouped together as the industry's largest trade publishers, the segment carrying $21.7 billion of the year's $33.4 billion total. Recorded music is concentrated too, with the three major labels holding 53.3% of the global market in 2023, per our music industry statistics report.
None of the sources in this report break out revenue by individual publisher; the figures above are tracked at the category level, and a publisher-by-publisher breakdown would need each company's own filing or a market-research firm willing to name its methodology for splitting share.
The self-publishing surge behind the title count
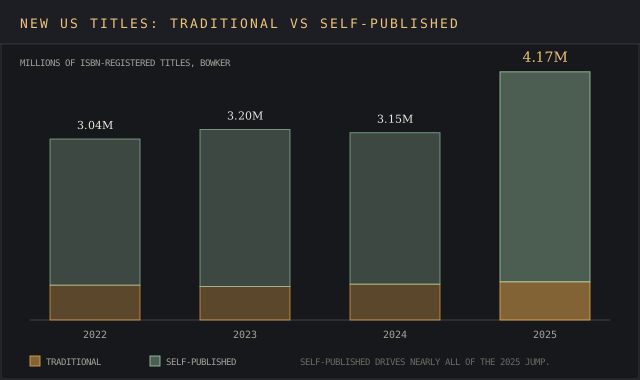
Bowker's ISBN registration data shows 4.17 million new US titles in 2025, up 32.5% over 2024. Self-published titles drove nearly all of that growth: 3.53 million titles, up 38.7% from 2.55 million in 2024, now 84.6% of everything published. Traditionally published titles rose a comparatively modest 6.6%, to 642,242.
- The segment, region or format to cover
- Regions, years and segments
- Where it runs: blog, white-label, gated or lead magnet
- Whose byline goes on it
- Deadline
- 2,500+ words, human-written
- Every figure linked to its source
- Yours to publish, under your name or none
- Hosting here for +$200, with your sponsored links
Bowker product marketing manager Andrew Kovacs attributes the jump to wider access to the tools a traditional contract used to gate: editing, cover design, distribution and marketing services authors can now use to reach their audience directly, "at a comparable level of quality" to what publishers offer in-house.
The top self-published categories in 2025 were fiction, juvenile non-fiction, and games and activities. On the traditional side, adult fiction led again, followed by juvenile fiction and business and economics.
Individual publisher distribution data adds a data point on where the digital growth concentrates: PublishDrive, an aggregator serving independent authors, reported its own publishers' ebook sales grew 29% in 2024, well above the industry-wide 3.2% ebook growth AAP recorded for the following year.
That gap is consistent with the surge above: independent authors distributing through a single platform can outgrow the traded market by a wide margin without moving the industry-wide number much.
How much of that surge is AI-written text versus AI-assisted work
A working paper from researchers at Columbia and the University of Michigan tracked 14,419 self-published genre-fiction ebooks from January 2023 through June 2026, matched to a daily sales panel covering roughly 95% of Amazon's ebook unit volume.
Books with substantial AI-generated text, over a quarter of the full manuscript, made up 20.0% of the sample. They earned only 12.1% of sales and 11.3% of revenue. Books with no detected AI text held 62.9% of the sample and a larger 71.7% of sales and 72.5% of revenue.
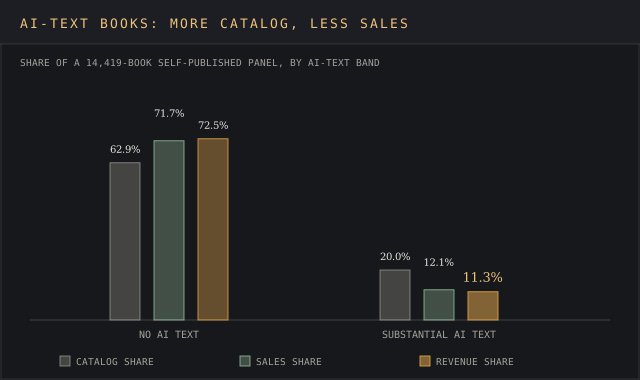
That volume still reached the top of the market. AI-heavy books' share of new entrants into weekly Top-25 sales-rank slots rose from near zero to 31% over the study period. Their overall sales share rose from near zero in 2023 to roughly 20% by the second quarter of 2026, even as no-AI-text books recovered to about 62% retention in those same Top-25 slots after an earlier dip.
Releases outran the money behind them. The paper's authors report the cumulative released catalog grew 38.3-fold between the first quarters of 2023 and 2026, quarterly unit sales grew 7.3-fold, and revenue grew 8.9-fold. Revenue per selling book fell in most of the genres tracked.
The effect concentrated in genres with heavy Kindle Unlimited availability, where the no-AI-text revenue lead over AI-heavy books narrowed by 8.4 percentage points compared with genres carrying less Kindle Unlimited exposure.
A narrower, genre-specific study points the same direction. Originality.ai scanned 844 books in Amazon's "Success" self-help subcategory published between August and November 2025 and found 77% were likely AI-written, with 90% carrying AI text somewhere on the product page. Human-written books in that category drew five times as many reviews on average, 129 versus 26, and were six times as likely to be discounted.
Originality.ai scanned 844 self-help books on Amazon published between August and November 2025 and rated 77% likely AI-written.
Self-help titles in one Amazon subcategory likely AI-written
Source: Originality.ai, 844 bookse.g. AI text share in your genre
Source: linked, checked, datedNeither study is the final word. The genre-fiction paper is a working paper still under peer review, and both rely on AI-detection tools that estimate authorship; neither confirms it. What they agree on is direction: AI-generated text has moved from a rounding error to a measurable, growing share of what self-published readers buy, without Amazon requiring the disclosure that would let a reader tell the difference before purchase.
Publishing commentator Jane Friedman flagged this failure mode in August 2023, after a reader alerted her to AI-generated books credited to her own name on Amazon.
In a post titled "I Would Rather See My Books Get Pirated Than This," she wrote that Amazon's infringement process initially asked her for a trademark registration number, then closed her case when she said she had none. The fraudulent titles came down only after she posted publicly and got the Authors Guild involved.
The data above shows what that early warning became. Three years on, AI-heavy text has grown from near zero to a fifth of tracked self-published ebook sales, and Amazon still has no listing requirement flagging a language model credited as the author.
Where AI fits into publishing workflows
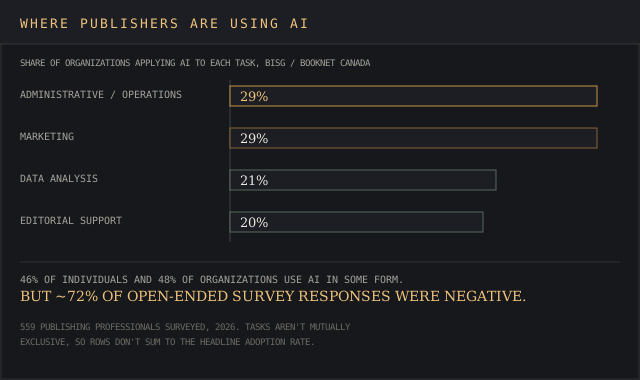
AI tools are part of that shift, though adoption is uneven. A 2026 BISG and BookNet Canada survey of 559 publishing professionals found 46% used AI individually and 48% worked at organizations using it, most commonly for administrative tasks (29%), marketing (29%), data analysis (21%) and editorial support (20%).
Open-ended responses ran heavily negative even so, at roughly 72%, on concerns over copyright, job impact and output reliability. Adoption is running ahead of comfort with it.
Who does the publishing: diversity in the industry's workforce
Distinct from sales, the industry also tracks who does the publishing. Lee & Low Books' 2023 Diversity Baseline Survey measures publishing's workforce. Author demographics are a separate question it doesn't cover. It found white respondents made up 72.5% of the publishing and review workforce, down from 76% in 2019 and 79% in 2015.
How the Canadian market compares
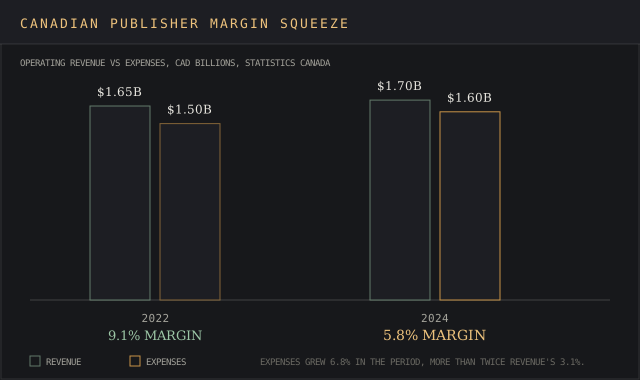
Statistics Canada's most recent survey (calendar year 2024, released February 2026) put Canadian book publishers' operating revenue at $1.7 billion CAD, a 3.1% change from 2022.
Expenses grew faster: operating costs rose 6.8% to $1.6 billion, driven by packaging, shipping, pulp and paper input costs, pushing the operating profit margin down to 5.8% from 9.1% in 2022, the worst margin StatCan has recorded since it began tracking the industry in 2014. StatCan's own note on the release described "stress mounting across the supply chain," language that matches what US publishers report.
Ebook sales rose 15.0% to $376.0 million, the fastest-growing format in the country. Independent bookstores held roughly steady on books sold in print, while major chains gained share. Foreign authors represent 51.2% of Canadian book sales, the first time they've cleared half since 2018, as their export sales climbed 25.3% and new foreign-author titles turned in a 26.2% increase from 2022, to 3,764 in the thousands.
What's squeezing margins on both sides of the border
Rising input costs are compressing publisher margins in both countries at once. Statistics Canada attributes its margin decline directly to packaging, shipping and paper costs; PublishDrive CEO Kinga Jentetics, writing about the same trend in the US market, points to a specific projection:
Paper costs are projected to grow 4.3% annually through 2032. USPS just announced 3-4% rate hikes. And if you're using commission-based distribution, you surrender 10-20% of every sale before you even calculate your actual costs.
For authors distributing through commission-based aggregators, that last figure stacks on top of the paper and shipping costs neither side can negotiate away.
How the industry tracks these numbers
No single trade publication or agency owns this data, and each one tracks sales differently. AAP's StatShot Annual aggregates publisher-submitted revenue with Census Bureau figures, published on its own website. Circana BookScan tracks unit sales through retail point-of-sale data, the panel Publishers Weekly and other trade publications draw on for their weekly articles and sales charts.
Bowker tracks title output through ISBN registrations, a count of what got published, and says nothing about what sold. Statistics Canada runs its own biennial survey. Four pieces of information, and the conversation around "industry size" moves faster than any one of them updates, which is why a total-size figure needs a source attached.
It's the same reason we built this report the way we built our construction market report, our business travel market report, our life science market report, our UK retail market report and our retail real estate market report: name the house behind every figure, and let the reader see where they disagree.
What the market-size estimates leave out
None of the six research-firm estimates above, and none of AAP's or StatCan's tracked revenue, count secondhand book sales, library circulation through services like OverDrive, or serialized fiction sold directly to readers through Patreon and Substack-style platforms. Open-access academic publishing and educational materials distributed outside a commercial rate card sit outside the count too.
That's the same kind of scope gap our sales intelligence market report found among four analyst houses sizing a software category: every published estimate is a real number measuring a defined slice, never the whole activity a casual reader assumes it covers.
Delivered for your site and your byline. Hosting here is optional.
Frequently asked questions
Is the publishing industry doing well?
By revenue, yes: US publishing revenue is up 16.1% since 2021, and 2024 marked the first annual increase in print units in three years. Margins are the weaker spot. Canadian publishers' operating profit margin fell to a 2014-era low in 2024 on rising input costs.
Are book sales increasing or decreasing?
Print unit sales in the US rose in 2024 and again in 2025, up 0.3% to 762.4 million units by Circana's own year-over-year count, after three years of decline through 2023. Both years remain below the 2021 peak of 839.7 million. Revenue has grown every year since 2021 across both the US and Canada.
What share of new books are self-published?
84.6% of the 4.17 million new US titles registered with ISBNs in 2025 were self-published, up from a smaller share in 2024, according to Bowker.
Who are the big five publishers?
Penguin Random House, HarperCollins, Simon & Schuster, Hachette Book Group and Macmillan are the five publishing houses most commonly grouped together as the industry's largest trade publishers.
Bottom line
Publishing revenue is growing in both the US and Canada, and readers are paying premium prices for the formats they already prefer, especially print. But rising input costs are eating into that growth from the other direction, and title output is being reshaped by self-publishing tools that didn't exist a decade ago.
Anyone quoting a "size of the publishing industry" figure should ask what it counts. AAP's $33.4 billion and StatCan's $1.7 billion CAD are source-attributable numbers with a fixed scope.
The global estimates ranging from $97.7 billion to $156.6 billion are model outputs from firms that define the category differently, and neither end of that range is wrong so much as answering a different question. This is one of several category reports we publish at /reports/, each built the same way.
Presses and author-service companies publish reports like this one for agents, authors and trade press.
A report on your topic for a blog page, gated content or a lead magnet.
Written for your client and published under their brand, with my name left off.
Your report on marketintelligencetools.com, with 2 to 3 CTAs carrying your sponsored links.
Default terms: the report is yours to publish, and I keep the right to republish it on this site behind a gate, outside Google's index.
Sources, and what none of them publish
US revenue and format figures are the Association of American Publishers' StatShot Annual report for calendar year 2025, published 10 August 2026 at publishers.org. Print unit figures are Circana BookScan, reported through Publishers Weekly. Title-output figures are Bowker's ISBN registration data, also reported through Publishers Weekly.
Canadian figures are Statistics Canada's book publishing industry survey for calendar year 2024, released 5 February 2026. Global market-size estimates are each named research firm's own published report, accessed 27 August 2026: Research and Markets, Future Market Insights, Market.us, Straits Research, Metastat Insights and Grand View Research.
The BookTok reading statistic is a Publishers Association survey reported by the World Economic Forum, with supporting NPD Group data reported by Book Riot. The AI-adoption figures are the 2026 BISG and BookNet Canada industry survey. The workforce-diversity figures are Lee & Low Books' 2023 Diversity Baseline Survey. PublishDrive's own distribution figures come from a LinkedIn post by its CEO, Kinga Jentetics.
None of these sources publishes a combined North American figure that reconciles AAP's US total with Statistics Canada's Canadian total on the same basis; the two are compiled by separate agencies using separate methodologies. No source here breaks out revenue by individual publishing house.
The AI-generated-text figures come from Chakrabarty, Liu, Ginsburg and Dhillon, "Generative AI floods and dilutes the market for books" (arXiv:2607.20349), posted 22 July 2026 and last revised 3 August 2026, a working paper not yet through peer review.
The self-help-category figures come from Originality.ai's scan of Amazon's "Success" subcategory, published 28 January 2026. The Jane Friedman account is from her own blog, first published August 2023 and updated since. All three sources accessed 28 August 2026.