Stakeholder Map Template
 By Jan Suski. I go deep on every review, checking every number against its source and digging up details other coverage misses, a habit from six years of SEO and link building for tech companies. Bylines at Surfer, Brand24, and Senuto. How the scoring works.
· Prefer this source on Google
A stakeholder map is used to identify individuals or groups involved in or affected by a project, sorted by how much power they hold and how much interest they take in the outcome.
This stakeholder map template gives project managers and project teams a working grid, already structured: identify key players, plot them, and turn the plot into an engagement plan before the project moves past the point where feedback still changes anything.
Stakeholder mapping is a method for identifying and categorizing project stakeholders, and it sits inside the broader discipline of market intelligence the same way a customer intelligence template does: both turn a list of names into a plan for who gets told what, and when.
Download the Free Stakeholder Map Template
Download the stakeholder map template (XLSX)A stakeholder list with power and interest ratings, an auto-assigned quadrant, and an engagement-plan column, plus a worked example row filled in.
The grid imports cleanly into Google Sheets; the tab layout matches the customer intelligence template, so a project team already using one adapts to the other in minutes and hits the ground running from day one.
What Is a Stakeholder Map?
A stakeholder map visualizes stakeholder relationships: who reports to whom, who influences whom, and which stakeholder groups move together on a decision. Stakeholder mapping visualizes relationships: who influences whom, who leads decisions. A list of names in a spreadsheet is not a map.
Stakeholders can be classified as internal or external, and most teams that map stakeholders start with that split before layering power and interest on top.
- Internal stakeholders: employees and managers within the organization, the project sponsor, the delivery team, and the department that inherits the finished work.
- External stakeholders: customers, suppliers, and regulators, plus anyone outside the organization whose approval, money, or cooperation the project depends on.
A map that only records internal and external stakeholders without rating either one is a directory. A stakeholder mapping matrix rates them.
Primary stakeholders have direct interest in project outcomes, while secondary stakeholders influence projects indirectly, like media and analysts. A stakeholder map usually plots both, but weights primary stakeholders more heavily when deciding where to spend engagement time.
Different stakeholder groups need different handling. A regulator and a delivery contractor might both sit in the "high power" band of a power interest grid, but a regulator responds to compliance evidence while a contractor responds to a delivery timeline, so the stakeholder mapping process has to record their response mechanism. Treat them the same way and the engagement plan ends up barking up the wrong tree for one of the two.
Why Stakeholder Mapping Is Important
Stakeholder mapping can identify potential risks and resistance towards a project before either one becomes a delay. A stakeholder who feels ignored in month one is the stakeholder who blocks sign-off in month six, and a map built early gives a project team the lead time to prevent that, proof that a stitch in time saves nine.
Stakeholder mapping helps prioritize stakeholders based on influence and interest. No project has the budget to run the same engagement plan for every stakeholder at once.
Mapping strengthens communication strategies for projects by matching the channel and frequency of contact to how much a given stakeholder needs to know, and it slots into the same market intelligence process that governs how a project gathers and acts on information generally.
Key stakeholders rarely announce themselves as important stakeholders on day one; a project manager who only tracks the obvious names misses the potential stakeholders whose significant influence shows up later, a vendor who suddenly holds schedule risk, a regulator whose position shifts after a filing.
Creating a stakeholder map early gives a project team deeper insights into who else might carry vested interest before the project moves forward, and categorizing critical stakeholders based on power and interest is what keeps that early view honest as the project runs.
The same view stakeholders differently depending on where a decision sits: a stakeholder with power high interest in one phase of a project can become a power low interest stakeholder once their specific deliverable ships, which is exactly why stakeholder mapping is a recurring exercise in project planning and strategic planning.
Visualizing stakeholder relationships aids in conflict resolution and collaboration. When two stakeholders disagree, a shared map showing both of their positions relative to the project is often a faster route to resolution than another status meeting, putting both sides on the same page immediately.
The purpose of a stakeholder map should be defined before its creation. A map built for a software rollout tracks different stakeholder relationships than one built for a construction permit, so naming the project, the decision, and the timeframe first keeps the mapping exercise from sprawling into a company-wide org chart.
Stakeholder Mapping Techniques
Several stakeholder mapping techniques cover the same ground from different angles, and most stakeholder mapping tool options in the market implement two or three of them side by side.
| Technique | What it plots | Best for |
|---|---|---|
| Power/Interest Grid | Power on one axis, interest on the other, four quadrants | Fast triage of a large stakeholder list |
| Salience Model | Power, legitimacy, and urgency | Politically sensitive or regulated projects |
| Stakeholder Circle | Stakeholder importance through concentric rings | Visualizing proximity to the project core |
| Force Field Analysis | Support and opposition for a specific decision | A single contested go/no-go call |
| Sociograms | Social relationships and communication patterns | Mapping informal influence alongside formal power |
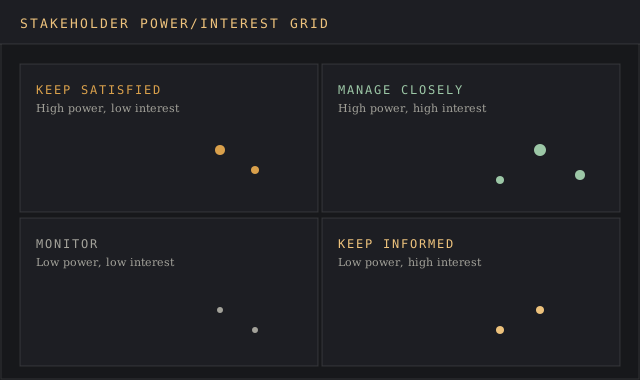
The Power/Interest Grid divides stakeholders into four quadrants, and it remains the default stakeholder mapping tool for most project teams because it answers the one question a busy project manager has time to ask: who needs the most attention this week.
The Salience Model categorizes stakeholders by power, legitimacy, and urgency, which is useful when a stakeholder has little formal power but a legitimate, time-sensitive claim, a community group ahead of a permit hearing, for example. Teams that also run a SWOT analysis template often plot salience-model findings into the threats quadrant, since an urgent but low-power stakeholder frequently is the threat and the clearest red flag a project gets early.
The Stakeholder Circle visualizes stakeholder importance through concentric rings, and Force Field Analysis maps support and opposition for project decisions specifically. Sociograms illustrate social relationships and communication patterns among stakeholders, which is the technique to reach for when the org chart says one thing and the actual influence runs somewhere else.
The Salience Model's Seven Stakeholder Types
The Salience Model, developed by management researchers Mitchell, Agle, and Wood, scores each stakeholder on three attributes: power, legitimacy, and urgency. A stakeholder holding all three is definitive; a stakeholder holding none of them barely counts as a stakeholder at all, which is the model's real contribution: stakeholder identification stops being a yes/no question and becomes a matter of degree.
Dormant stakeholders hold power but neither legitimacy nor urgency, a regulator who could intervene but hasn't yet been asked to. Discretionary stakeholders hold legitimacy alone, a community group with a real stake but no power to force the issue. Demanding stakeholders hold urgency alone, the individual stakeholders who call constantly but cannot move a project on their own, all bark and no bite.
Dominant stakeholders combine power and legitimacy, the kind of stakeholder groups that expect and receive regular attention without having to ask twice. Dangerous stakeholders combine power and urgency without legitimacy, the coercive case a project team hopes not to meet. Dependent stakeholders combine legitimacy and urgency without power, relying on a dominant stakeholder to act on their behalf.
Definitive stakeholders hold power, legitimacy, and urgency together and get treated the way a power interest grid treats its manage-closely quadrant: full attention, immediately, with no waiting for a scheduled review.
Classifying stakeholders this way takes longer than a power interest grid, which is why most stakeholder mapping models reach for it only on politically sensitive or heavily regulated projects, environmental groups and permit-issuing agencies among the more common examples of different stakeholder groups whose legitimacy or urgency shifts faster than their formal power does.
How to Create a Stakeholder Map
To create a stakeholder map, start by identifying and analyzing all relevant stakeholders. The stakeholder mapping process includes five structured steps, and skipping any one of them is where most maps go stale within a quarter.
- Identify stakeholders. Pull names from project documents, the org chart, and the contract, then ask the project sponsor who else has a vested interest that the paperwork missed.
- Classify stakeholders based on power and interest. Rate each one on both axes, using a simple high, medium, low scale.
- Plot stakeholders on the map. A power interest matrix, a salience model, or a sociogram, chosen for the project type described above.
- Develop engagement strategies. Assign a contact cadence and a preferred channel to each quadrant, which keeps the plan usable at scale.
- Update the map throughout the project. Regular updates to stakeholder maps maintain their relevance throughout projects, since a stakeholder's power or interest rarely stays fixed for an entire project lifecycle.
High power and high interest stakeholders should be managed closely during a project. This group gets the most frequent contact, the most detail, and the first call when a decision changes, since they have both the standing and the motivation to act on what they hear, and on this project, they're the ones calling the shots.
Building a Stakeholder Engagement Plan
A power interest grid tells a project team where a stakeholder sits; it doesn't write the communication plan on its own. Engagement strategies have to be developed per quadrant, one strategy covering every stakeholder who lands in it, or the plan collapses back into a spreadsheet with a name attached to every row and no shared logic behind any of it, right back to square one.
Develop strategies around three variables for each quadrant: contact frequency, level of detail, and channel. A manage-closely stakeholder gets a direct line and a seat at decision points; a monitor-quadrant stakeholder gets a quarterly note and nothing more, and the communication strategies for each should be written down once and reused for every new name that lands in the quadrant.
A stakeholder engagement plan is also where a stakeholder map earns its keep past the workshop that produced it: the plan is the artifact a project manager consults on a Tuesday morning. The grid stays in the workshop deck.
Managing Each Quadrant of the Power-Interest Grid
The four quadrants of a power interest grid each call for a different engagement strategy, beyond a different label.
Manage Closely: High Power, High Interest
These are the critical stakeholders who can stop a project or clear its path. Give them full detail, a direct line to the project manager, and a seat in any decision that touches scope, budget, or timeline.
Keep Satisfied: High Power, Low Interest
Dormant stakeholders in this band have the influence to become dangerous stakeholders if surprised, so don't let them slip under the radar between updates. Send summary updates on a fixed schedule, and escalate immediately if something in their domain changes.
Keep Informed: Low Power, High Interest
Demanding stakeholders here care a great deal but cannot move the project alone. Regular, detailed updates keep them from becoming a bottleneck through repeated questions, and they often become useful advocates if kept in the loop.
Monitor: Low Power, Low Interest
Discretionary and dependent stakeholders in this quadrant need the least effort: light-touch, infrequent contact, with a plan to promote them to a higher-attention quadrant if their power or interest changes.
Stakeholder Analysis vs Stakeholder Mapping
Stakeholder analysis is the research step: gathering names from project documents and organizational charts, then rating each one's power, interest, and stake in the outcome. Stakeholder mapping is the visual representation of that research, the step that turns a spreadsheet of ratings into a picture a project manager can read in five seconds.
Stakeholder management is the ongoing discipline both feed: acting on the map. Teams that stop at analysis produce a list nobody consults again; teams that map relationships without doing the analysis first produce a pretty chart built on guesses about who holds power.
Visualizing stakeholder relationships on a grid works because a picture surfaces stakeholder information a plain list hides: it becomes obvious when two different stakeholders sit far apart on the grid but need to hear the same message anyway. A project's long-run project success tracks closely with how honestly that picture got built in the first place.
Polish on the document counts for nothing.
Common Mistakes in Stakeholder Mapping
Overlooking critical stakeholders is the most common failure, usually because the mapping exercise pulled only from a formal org chart and missed the external stakeholders, a regulator, a key customer, a community group, who never appear on that document.
Misclassifying stakeholder influence levels is the second failure: rating a stakeholder by title produces a map that looks tidy and predicts nothing. Base ratings on actual behavior on past projects.
Static stakeholder maps are the third failure. A map built once at kickoff and never revisited stops matching reality within weeks on any project longer than a month, because a stakeholder's power and interest are never set in stone, which is why regular updates to stakeholder maps are essential for accuracy.
A Worked Example
Take a mid-size company rolling out a new internal finance system. The project team starts by listing stakeholders: the CFO, the finance department staff, the IT security team, the external auditor, and the software vendor's implementation lead.
Plotting the group on a power interest grid puts the CFO and IT security in the manage-closely quadrant, the auditor in keep-satisfied since their interest is periodic, finance staff in keep-informed since they will use the system daily but don't control the budget, and the vendor's implementation lead in manage-closely alongside the CFO for the duration of the rollout specifically.
The engagement plan that follows assigns weekly steering updates to the manage-closely group, a pre-launch and post-launch briefing to the auditor, and a dedicated internal newsletter to finance staff, turning a list of five names into five different, appropriately sized commitments.
FAQ
What is a stakeholder map?
A visual tool used to identify individuals or groups involved in or affected by a project, plotted by power and interest so a project team can direct the most engagement toward the stakeholders who carry the most power and interest.
How do I make a stakeholder map?
Identify all relevant stakeholders, classify each one by power and interest, plot them on a grid or model that fits the project, develop an engagement strategy per quadrant, and update the map throughout the project lifecycle.
What are the four steps of stakeholder mapping?
Identify stakeholders, classify them by power and interest, plot the map, and develop engagement strategies; a fifth step, regular review, keeps the first four from going stale.
What is the difference between stakeholder map and RACI matrix?
A stakeholder map plots power and interest to guide communication and engagement; a RACI matrix assigns who is Responsible, Accountable, Consulted, and Informed for specific tasks. Many project teams use both: the stakeholder map decides who to talk to and how often, the RACI decides who signs off on what.
Bottom Line
A stakeholder map earns its place on a project the same way any market intelligence template does: by turning a list of names into a plan that changes what a project manager does this week. Identify the stakeholders, classify them honestly, plot the map with the technique that fits the project, and revisit it on a schedule. Actions speak louder than words here, and revisiting the map is the action that counts most.