Automotive industry statistics for 2026, and where the sources disagree
 By Jan Suski. I go deep on every review, checking every number against its source and digging up details other coverage misses, a habit from six years of SEO and link building for tech companies. Bylines at Surfer, Brand24, and Senuto. How the scoring works.
· Prefer this source on Google
The numbers global and US automotive data, through Q1 2026
The fleet keeps getting bigger while it gets more efficient: two of every three new US vehicles built in model year 2024 were trucks.
New-vehicle prices cleared $50,000 before EV adoption caught up: US buyers pulled back once federal incentives ended in September 2025.
Global EV growth and US EV growth stopped being the same story in 2025: worldwide sales kept climbing while the US share of new-vehicle sales fell by nearly half in two quarters.
Scale still concentrates at the top: Toyota alone outsold BYD, the fastest-growing name on the list, by more than double in 2024.
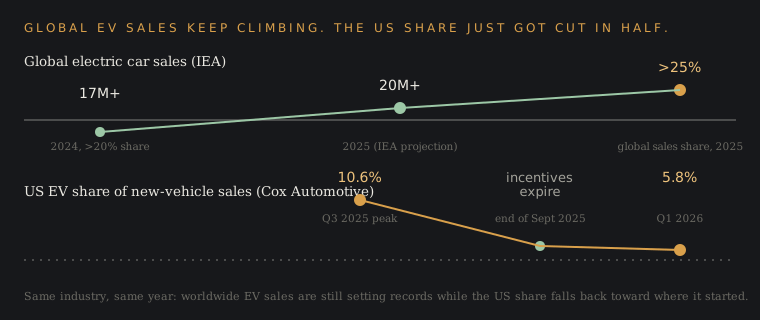
In the first quarter of 2026, US electric-vehicle sales fell 27% from a year earlier, and EVs held 5.8% of new-vehicle sales, about half the 10.6% share they held in the third quarter of 2025, before federal purchase incentives expired at the end of September. Global EV sales moved the opposite way: they cleared 17 million cars in 2024, and the International Energy Agency expects that number to pass 20 million in 2025.
Two data sets, both accurate, both describing "the auto industry" at the same time.
This report pulls automotive industry statistics from primary sources: the EPA's Automotive Trends Report, the IEA's Global EV Outlook, PwC's automotive industry outlook, Cox Automotive and Kelley Blue Book's transaction-price data, the Alliance for Automotive Innovation's economic-impact reporting, and Cars Commerce's monthly market reviews. It lines up the figures these sources measure differently, or disagree on outright.
It's built for anyone who has quoted a single "auto industry" statistic and later found a different one that contradicts it. Several of the splits below are exactly that: US truck share against European car share, a global EV market that's still growing against a US EV market that just lost half its share in two quarters, one research house's market-size estimate against another's.
One thread in this data got its own full report. Automakers are charging monthly or one-time fees to unlock features, heated seats, faster acceleration, driver assist, on hardware already built into the car. A companion piece, Subscription based car features: what's paywalled right now, brand by brand, checks nine automakers' current pricing against Louis Rossmann's Consumer Rights Wiki and traces what happened to the two state bills written to stop it.
How big the automotive industry is, depending who's counting
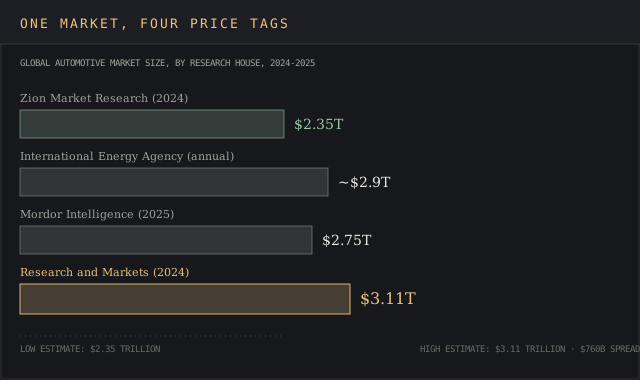
Ask four research companies to size the global automotive market and four different numbers come back. Zion Market Research puts it at $2.35 trillion for 2024. Research and Markets puts the same year at $3.11 trillion. Mordor Intelligence puts 2025 at $2.75 trillion. The International Energy Agency, framing the same industry in its own car-market analysis, lands near $2.9 trillion a year. The gap between the low and high estimate is $760 billion.
That's 32% of the smaller figure.
Each house is correct on its own terms. The spread comes from scope: what counts as "automotive," how far into parts, financing, dealership margin and aftermarket services a given estimate reaches, and if it's measuring wholesale manufacturer revenue or retail transaction value. A number quoted without its scope attached is close to meaningless for comparison, which is why this report names the house behind every figure and skips averaging them into one number.
A team sizing its own slice of a market can start from a market sizing template built around the same scope questions.
| Research house | Estimate | Year |
|---|---|---|
| Zion Market Research | $2.35 trillion | 2024 |
| International Energy Agency | ~$2.9 trillion | Annual, current |
| Mordor Intelligence | $2.75 trillion | 2025 |
| Research and Markets | $3.11 trillion | 2024 |
Global production and sales, and a small gap between two trackers
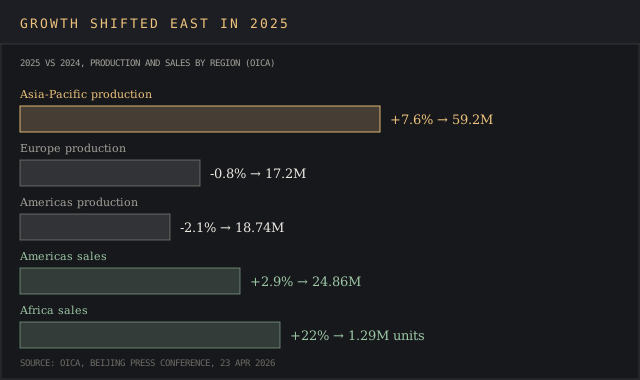
Unlike the dollar figures above, unit counts have one clear source of record. The International Organization of Motor Vehicle Manufacturers (OICA) reported at a Beijing press conference that global vehicle production climbed from 92.7 million units in 2024 to 96.4 million in 2025, a 3.9% increase, while global sales rose from 95.3 million to 99.8 million units, up 4.7%.
Passenger cars have historically made up the bulk of that output: OICA's 2024 breakdown counted 67.7 million passenger cars against 24.8 million commercial vehicles, putting passenger cars at roughly 73% of total production.
The growth wasn't spread evenly. Asia-Pacific production rose 7.6% to about 59.2 million vehicles, more than 61% of the global total, with China alone adding 3.25 million units to reach 34.53 million produced and India climbing to 6.49 million. Europe stayed flat, with production down 0.8% to 17.2 million and sales down 0.4% to 18.63 million.
The Americas diverged internally: regional production fell 2.1% to 18.74 million even as regional sales rose 2.9% to 24.86 million, and OICA flagged growing exposure to tariff risks and localization pressure as a reason for that gap.
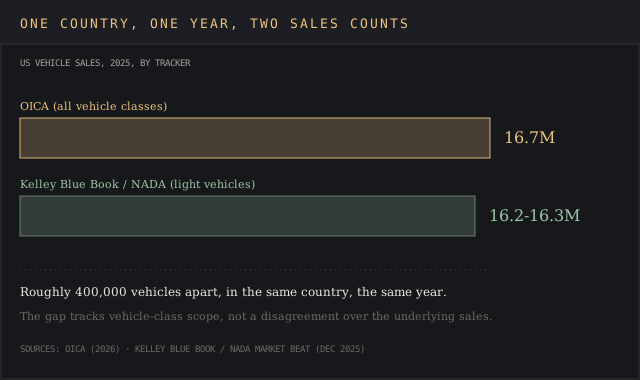
Even the US total isn't a single number. OICA counted 16.7 million vehicles sold in the US in 2025; Kelley Blue Book and NADA counted 16.2 to 16.3 million light-vehicle sales over the same year. Both trackers are correct: OICA's global count folds in vehicle classes that the US industry's own "light-vehicle" trackers exclude, which is a small, checkable version of the same scope problem behind the $760 billion market-size gap above.
The jobs and paycheck numbers, and the ones that don't check out
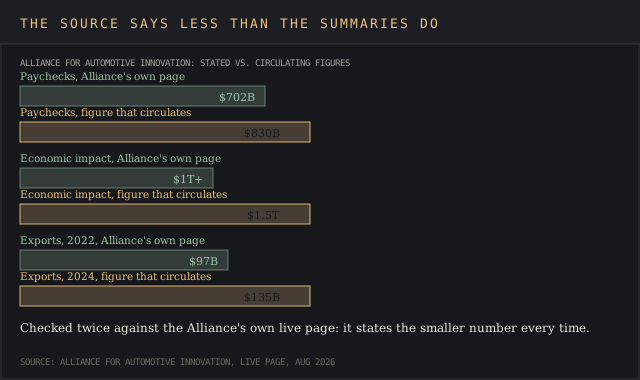
The Alliance for Automotive Innovation's own current page states that the industry supports 9.7 million American jobs, about 5% of private-sector employment, generating $702 billion in paychecks. Its multiplier effect, 11.5, means every direct auto-manufacturing job supports nearly 10.5 additional positions elsewhere in the economy.
Auto manufacturing drives more than $1 trillion into the economy each year, contributes roughly $280 billion in federal, state and local tax revenue, and remains the largest manufacturing sector in the US, with 20 automakers running 55 light-vehicle assembly plants across 15 states. The same page states $97 billion in exports, dated to 2022.
Larger versions of several of those figures circulate: an $830 billion paycheck total, a $1.5 trillion economic-impact figure and a $135 billion 2024 export number all turn up in AI-generated summaries and in search snippets tied to the same domain. Checked twice against the Alliance's own live page, that page states the lower figures above.
This report uses what the source states today. It doesn't repeat a bigger number absent from the source itself. If a newer, dated report supersedes it, contact the Alliance directly and update the figure from that report. The same gap between a stated figure and a circulating one runs through this report's companion piece on software pricing errors, which checks each figure directly against SaaS vendor pricing pages.
Current trends reshaping who buys what
The clearest current trend in US vehicle production is the one away from cars. Under the National Highway Traffic Safety Administration's regulatory definitions, 66% of new US vehicles built in model year 2024 were classified as trucks and 34% as cars, and truck SUVs alone now account for half of all new-vehicle production.
That 66% is a regulatory count, built on weight and drivetrain thresholds, apart from the labels used on a dealership lot. It's part of why the Alliance for Automotive Innovation's own 2022 figure for "light truck market share" comes in higher, at 79.3%, using a market-segment definition of what counts as a truck.
The efficiency numbers moved with the mix. Average new-vehicle fuel economy hit 27.2 mpg in model year 2024, a record in the report's history, up 41% from model year 2004 and improving in 16 of the last 20 years, according to the EPA.
Electrification and battery technology did most of the recent work, increasing fuel economy even as the fleet mix shifted toward heavier SUVs: without battery-electric and plug-in hybrid vehicles, MY2024 fuel economy would have been 1.7 mpg lower. Thirty percent of car SUVs sold that year were battery-electric.
Fuel economy by manufacturer varies more than the fleet average suggests. Tesla's all-electric lineup averaged 117.1 mpg-equivalent in MY2024, ahead of Honda at 31.0 and Hyundai at 29.8. Stellantis posted the lowest figure among large manufacturers at 22.8 mpg, and fuel economy for pickups held flat industry-wide while truck SUVs gained ground.
Automakers keep submitting this compliance data to the EPA every model year, which is how the report's fuel-economy figures get audited independently, against submitted compliance data and not a manufacturer's word alone.
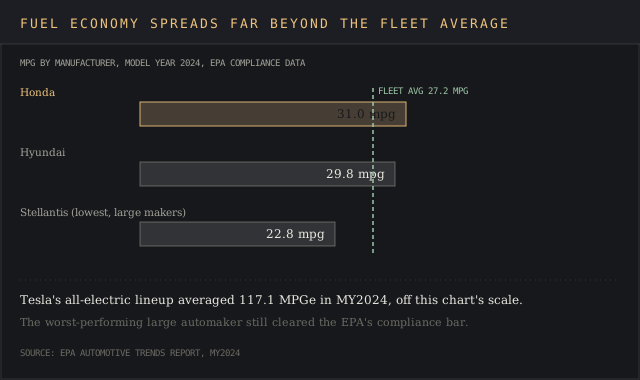
Toyota gained the most ground over the last five model years, up 3.3 mpg since 2019, reflecting a broader shift toward hybrid volume across the industry; Tesla, conversely, was the only large manufacturer whose fuel economy posted a decline over that period, as its car-SUV production grew.
Market share among the world's largest automakers
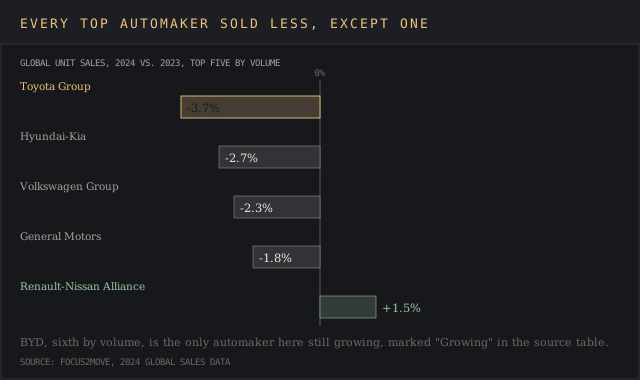
Global market share sits with a small group of manufacturers, and it barely moved in 2024. Toyota Group sold 10.8 million vehicles to hold the top spot for a fifth straight year, even as its own volume posted a 3.7% decline compared with 2023. Volkswagen Group held second with 9.03 million, down 2.3%. BYD, the one name on the list that grew, sold 4.3 million, enough to put it within reach of the established five but still well behind Toyota's total.
| Automaker | 2024 global sales | Change vs. 2023 |
|---|---|---|
| Toyota Group | 10.8 million | -3.7% |
| Volkswagen Group | 9.03 million | -2.3% |
| Hyundai-Kia | 6.82 million | -2.7% |
| Renault-Nissan Alliance | 6.24 million | +1.5% |
| General Motors | 5.96 million | -1.8% |
| BYD | 4.3 million | Growing |
Every established name on that list sold fewer vehicles in 2024 than in 2023. Renault-Nissan was the exception among the top five, gaining 1.5% on stronger European sales.
Falling volume at the top five alongside growth concentrated in the one Chinese entrant matches the same pattern PwC's 2026 outlook describes for OEM financial health, which increasingly takes the form of margin compression more than falling volume: peer-average EBITDA fell from near 11% in the third quarter of 2024 to below 8% a year later, even as transaction prices hit records.
Electric vehicles are growing worldwide, and stalling in the US
Globally, 2024 was the strongest EV year on record. The IEA counted more than 17 million electric cars sold, over 20% of all new-car sales worldwide, and the 3.5 million-unit increase over 2023 alone exceeded total global EV sales from 2020. China accounted for over 11 million of those sales, nearly half of all cars sold in the country, and produced more than 70% of the world's electric cars, a lead the IEA expects it to hold through 2030.
The IEA's 2025 outlook, issued before the year closed, projected global EV sales would exceed 20 million and cross a 25% sales share, and expects the growth to continue past 2025 as more model choices reach the market.
The United States is the outlier inside that growth story. EV sales grew about 10% year-over-year through 2024, but that reversed last year, once federal purchase incentives expired at the end of September 2025. Cox Automotive counted a 36% year-over-year sales drop in the fourth quarter of 2025 and a further 27% drop in the first quarter of 2026, with EV share stabilizing near 5.8%, down from a 10.6% peak in the third quarter of 2025.
Some individual automakers posted year-over-year declines of 60% to 70% in the first quarter of 2026. One in three EVs sold in that quarter was a Tesla Model Y.
PwC's read on the underlying economics explains part of the split. US battery-electric vehicles carry a 15% to 20% price premium over the market average, and only 16% of available US BEV models are priced under $45,000, the price point nearly half of US consumers say they want. Charging infrastructure adds a second set of challenges: PwC counts US public charging access as still behind EV deployment, a gap that slows adoption independent of price or battery technology.
In China, BEVs have already reached first-cost parity with equivalent gasoline vehicles, helped by battery costs PwC estimates at roughly 30% below US levels and 50% below European levels. Automakers on both sides of the Pacific are speeding the development and introduction of new BEV models to close that gap, per PwC's outlook, but PwC still projects the US won't reach cost parity until 2028 or 2029.
New-vehicle prices crossed $50,000 before paychecks caught up
The average transaction price for a new US vehicle hit $50,080 in September 2025, according to Kelley Blue Book, the first time the figure has cleared $50,000. The average sticker price, before incentives, reached $52,183 the same month, up 4.2% from a year earlier. Incentive spending covered 7.4% of the transaction price, or roughly $3,700 on average across new-vehicle purchases, which kept the increase from running even higher.
PwC's outlook frames the same trend from the demand side: new-vehicle prices in the US and Europe have risen 15% to 25% since 2020, driven largely by inflation, semiconductor scarcity and raw-material cost surges, pushing the average transaction price in both regions past $45,000.
Nearly half of US buyers are shopping for a vehicle under that price, and the mismatch between what buyers want and what automakers are building is one reason PwC expects unit sales in mature markets to stay flat through 2030.
China's pricing looks nothing like it. The average transaction price there sits near $25,000, about half the US or European figure, supported by an integrated domestic supply chain and battery costs that PwC estimates run 30% below US levels.
That price gap is also why Chinese exports have grown to roughly 3 million vehicles a year since 2020, concentrated in Europe, Latin America and Southeast Asia, where a $25,000-built vehicle competes directly with $45,000-built ones.
Used cars are absorbing the affordability squeeze
Used-vehicle prices rose 2.7% year-over-year in November 2025, the eighth straight month of increases, according to Cars Commerce's monthly market insights report. That rise is concentrated at the bottom of the market: inventory of used vehicles priced under $20,000 fell 1.3% year-over-year, and the vehicles that remain in that band carry higher mileage than a year earlier.
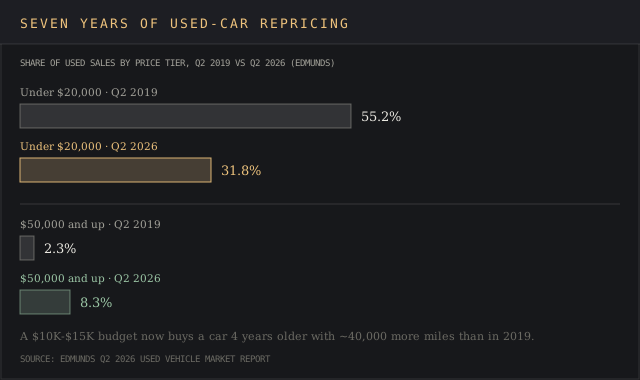
Edmunds' Q2 2026 used-vehicle report puts a sharper number on the same squeeze. The average price of a 3-year-old used vehicle hit a record $32,461 that quarter, up 4% from a year earlier and 15.5% above Q2 2021. Since Q2 2019, the share of used sales under $20,000 has fallen from 55.2% to 31.8%, while the share above $50,000 has nearly quadrupled, from 2.3% to 8.3%.
A $10,000-to-$15,000 budget now buys a vehicle four years older and carrying nearly 40,000 more miles than the same budget bought in 2019, per Edmunds.
Cars Commerce traces the shortage to two sources: underproduction during the 2021-22 semiconductor shortage, which left a hole in the three- and four-year-old vehicles now aging into the used market, and the ordinary attrition of older cars leaving service. Body style compounds the problem: used SUV and pickup inventory grew while used sedan inventory kept shrinking, narrowing the choice for buyers who want a smaller, more fuel-efficient used car.
New-car prices are adding pressure from the other direction. The average new-car list price reached about $49,700 in November 2025, up only 0.7% year-over-year, but that modest average masked a faster shift: 2026 model-year vehicles made up more than half of new-car inventory by that point, arriving earlier than in prior years and carrying updated, higher price tags.
Every buyer priced out of a new vehicle by that shift is a buyer competing for the same shrinking pool of affordable used ones.
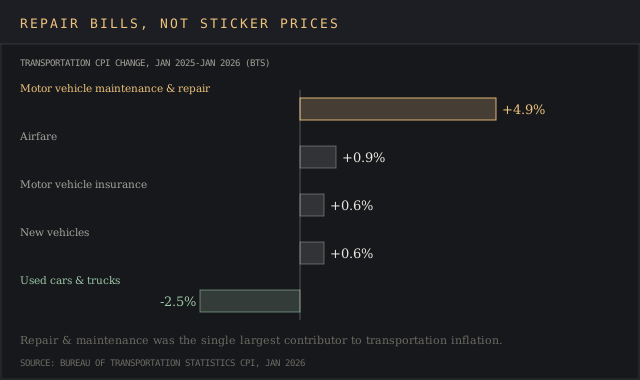
Ownership costs are rising alongside purchase prices. The Bureau of Transportation Statistics' Consumer Price Index found motor vehicle maintenance and repair up 4.9% year-over-year between January 2025 and January 2026, the single largest contributor to transportation inflation that year, ahead of airfare (up 0.9%) and motor vehicle insurance (up 0.6%).
New-vehicle prices in the same report rose a comparatively modest 0.6%, while used cars and trucks fell 2.5%, a reminder that the sticker price and the cost of keeping a vehicle on the road move on separate tracks.
Where the supply chain is exposed
Production geography is shifting toward the US even as prices climb. More than 55% of vehicles sold in the US today are built domestically, according to PwC, and North American production volumes are projected to return to mid-2019 levels by 2030 as automakers balance capacity between battery-electric, hybrid and updated combustion models.
That shift is a direct response to tariff risks and a push toward supply chain resilience: production closer to the point of sale and less exposure concentrated in one region, the same exposure that supply chain intelligence platforms are built to track.
Suppliers have carried more of that adjustment to their business than automakers have. PwC's data shows supplier EBITDA margins holding steady by passing rising costs upstream to OEMs, though unevenly: electronics, chemicals and metals suppliers saw margin pressure from cost volatility, while exterior trim and powertrain suppliers held steadier demand and pricing.
The share of suppliers in financial distress fell from 31% in 2024 to 24% in 2025, and supplier merger activity rebounded the same year after 2024's multi-year low. Investors took notice: PwC counts a growing run of deals over $1 billion, concentrated in powertrain and electronics.
China's export growth adds a second layer of exposure. Chinese manufacturers, led by BYD and Chery, have added roughly 3 million vehicles a year in exports since 2020, reaching nearly every major region except the US. That volume is now large enough that PwC treats Chinese OEMs' cost advantage, an integrated domestic supply chain plus the lower battery costs described above, as a competitive threat to incumbent automakers in every market Chinese exports reach.
What the 2030 forecasts assume, and where they've already slipped
PwC's own 2026 outlook already differs from its prior-year projections in one place: European BEV adoption by 2030, previously projected above 60%, is now expected to land closer to 60% or below as new EU emissions regulation details firm up, a downward revision inside a single forecast cycle.
The IEA's 2025 outlook carries a similar caveat for the US, where it frames the 2030 EV sales-share projection as dependent on "today's policy direction," a hedge inserted because federal incentive policy was already unsettled when the report published.
Both forecasters build their 2030 numbers on assumptions that already broke in 2025: US federal EV incentives, priced into most projections made before September 2025, are gone, and Q1 2026 sales data shows the market adjusting to that removal faster than either forecaster's base case assumed. The IEA's own tally has the US reaching a 20% EV sales share by 2030 under current policy, less than half of what its prior-year outlook projected for the same year.
What none of the major 2030 forecasts fully price in is a second incentive change, a new tariff schedule or a battery-cost move outside their stated ranges. PwC's own battery-cost projection through 2028-2029 rests on a Bloomberg-sourced trend line. Every dated figure in this report will be as stale as the ones the AI Search engines already have on file.
The fix is the same one applied here: recheck the primary source before repeating a number that's more than one quarter old.
Frequently asked questions
How is the auto industry doing right now?
It depends on the market. Sales of new vehicles in the US ran near 16.3 million units in 2025, the best year since 2019, and global vehicle production stayed on an upward path. The weak spot is US EV sales, which fell sharply after federal incentives expired in September 2025, and OEM profitability, which PwC's data shows compressing even as transaction prices set records.
What are the current issues facing the automotive industry?
Four stand out in the primary data: new-vehicle affordability, with average transaction prices above $50,000 in the US; a widening China cost advantage in EVs and batteries; tariff-driven pressure to relocate production; and a US EV market correcting hard after its main subsidy ended.
Is the automotive industry slowing down?
2025 was the best US sales year since 2019, and global EV sales kept climbing through it. Margin is the weak spot: PwC's data shows OEM EBITDA falling by roughly three percentage points between the third quarters of 2024 and 2025.
Who are the "Big Three" in the car industry?
The phrase has two answers depending on scope. In the US, it still refers to General Motors, Ford and Stellantis. Globally, the largest three by 2024 unit sales were Toyota Group, Volkswagen Group and Hyundai-Kia.
Is the auto industry in trouble in 2026?
Sales volume held up through 2025 and into 2026 outside the US EV segment. The pressure points sit elsewhere: margin compression at automakers, a supplier base still working through 2024's distress levels, and a US EV market resetting after its incentive ended.
Bottom line
The automotive industry statistics worth repeating in 2026 are the ones that split into two contradictory numbers, US truck share against European car share, a global EV market still setting sales records against a US EV market that just lost half its share in two quarters, four research houses sizing the same global market $760 billion apart.
A primary source is the most accurate data available for its own domain; a secondhand summary of it rarely carries the caveats attached. That split is a reason to ask which fleet, which region and which quarter a number describes before repeating it, the same question this report's UK retail market report asks of a different sector, and to check the primary source behind it: EPA, IEA, PwC, Cox Automotive, Cars Commerce, the Alliance for Automotive Innovation.
Most of them publish free updates through reports, newsletters and podcasts; subscribe to the source directly and skip the secondhand summary.
Sources, and where each figure comes from
Fuel economy and vehicle-classification figures are the EPA's Automotive Trends Report. Global EV sales and production figures are the IEA's Global EV Outlook 2025. Global production and sales unit counts are OICA's own production statistics, reported at a Beijing press conference.
US jobs, paycheck and economic-impact figures are the Alliance for Automotive Innovation's Economic Impact Report, checked against the page's current live figures. New-vehicle transaction-price figures are Kelley Blue Book's own reporting, including its September 2025 record-price release. Used-vehicle price and inventory figures are Cars Commerce's monthly Industry Insights Report and Edmunds' quarterly used-vehicle report.
OEM margin, supplier-distress and China cost-advantage figures are PwC's automotive industry outlook. EV sales-share and quarterly figures for the US market are Cox Automotive's own insights reporting. Transportation-inflation figures (repair, insurance, airfare) are the Bureau of Transportation Statistics' Consumer Price Index data. Truck/car classification thresholds are the National Highway Traffic Safety Administration's regulatory definitions.
None of these sources publishes a single reconciled figure for "the size of the US auto industry"; each measures a different slice, unit sales, dollar revenue, jobs, or margin, on its own schedule, which is why this report names the source behind every figure and keeps each one separate, without collapsing them into a single blended total.