Insurance statistics for 2026: premiums, coverage gaps and where the sources disagree
 By Jan Suski. I go deep on every review, checking every number against its source and digging up details other coverage misses, a habit from six years of SEO and link building for tech companies. Bylines at Surfer, Brand24, and Senuto. How the scoring works.
The numbers global, US and EU insurance, checked 1 October 2026
Real growth drops to 1.3% in 2026 while Swiss Re puts global inflation at 4.0%, so most of this year's nominal gain is inflation.
US property-casualty carriers are in their most profitable stretch in years, with a 92.7 combined ratio through June.
Life insurance ownership sits at 52%, and the gap between what households carry and what they need still covers 38% of adults, about 92 million people.
The world's insurers collected €6.9 trillion in 2025, up 7.1%, according to the Allianz Global Insurance Report 2026. The Swiss Re Institute's sigma 2/2026 expects real growth to slow to 1.3% this year, from 3.9% in 2025. Both houses agree the industry is getting bigger. They count it in different units, and that matters the moment you compare their totals.
This report pulls together the insurance industry statistics published in 2025 and 2026: global volume, US property-casualty insurance results, life insurance ownership and sales, annuities, health insurance coverage, jobs and catastrophe losses. Every one of these statistics links to the body that published the data, with the report title and date.
It's written for analysts, agents and finance teams who need a sourced number fast. Where two publishers disagree, the gap gets its own section with both figures named.
Global insurance market: €6.9 trillion in 2025 and a 1.3% real forecast for 2026
Life insurance remains the largest segment at €2,861 billion, per Allianz data, followed by P&C at €2,320 billion and health at €1,688 billion. Health rose fastest, up 12.3% in 2025, against 6.9% for life and 3.8% for P&C. Allianz's decade trends put health at 6.7% a year, against 5.3% for the market overall, as aging populations and medical costs push demand up.
Forecasts by segment and by country
Swiss Re's forecast runs in real terms, after inflation. It puts 2026 life at 2.3% real, or 7.0% nominal, and non-life at 0.6%, then 1.6% for the total next year before a return to the 2% long-term trend. Non-life volume reaches about $5 trillion in 2026, up from $4.8 trillion in 2025. India is the fastest riser among the 20 largest countries at 7.1% real in 2026.
North America will write 54% of the $2.6 trillion in additional business Swiss Re projects for 2027 to 2036. That's the lion's share of every dollar the industry adds over the decade, and the US alone accounts for 80% of global health insurance volume.
Europe: EIOPA's statistical data on insurance undertakings
The European Insurance and Occupational Pensions Authority publishes quarterly and annual statistics on insurance undertakings and groups across countries in the European Union and the European Economic Area, plus indicators from financial stability reporting. The latest update landed on 1 September 2026.
Its Financial Stability Report of December 2025 counts €6,859 billion in general-account investments and €2,520 billion in unit-linked funds at insurance undertakings in the European Economic Area as of Q2 2025. The median life insurer held a solvency capital ratio of 235%, non-life insurers 214% and composite groups 218%.
The global protection gap
Swiss Re's sigma Resilience Index 2024 put the global protection gap at $1.83 trillion in premium-equivalent terms for 2023, up 3.1% from $1.77 trillion. Health made up $941 billion of it, mortality $414 billion and natural catastrophes $385 billion.
A later Swiss Re estimate puts the global mortality protection gap at a record $432 billion for 2024. The US mortality protection shortfall alone is almost $83 billion.
Why the published estimates diverge
Disagreement is par for the course, and the reasons are mechanical: currency, nominal against real growth, what counts as an insured loss and if a survey asks about one day or a full year. The houses aren't on the same page by design, so the table below names each house's statistics and definitions. Use the CAGR calculator to convert any two endpoints to an annual rate before you compare them.
| Measure | Estimate A | Estimate B | Why they differ |
|---|---|---|---|
| Global premium increase, 2025 | Allianz: 7.1% | Swiss Re: 3.9% | Allianz reports nominal euro change, Swiss Re real change after inflation |
| US share of global health volume | Swiss Re: 80% ($1.8T) | Allianz: above 70% | Swiss Re reports in US dollars, Allianz in euros |
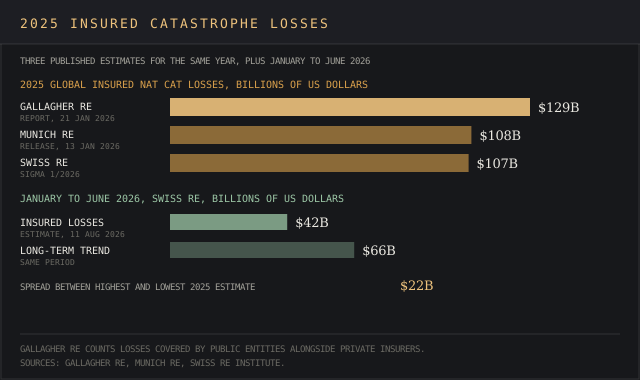
| 2025 insured nat cat losses | Swiss Re: $107B; Munich Re: $108B | Gallagher Re: $129B | Gallagher Re's total includes losses covered by public entities |
| US P&C underwriting gain, 2025 | Verisk and APCIA: $63B, combined ratio 92.9 | AM Best: $60.9B, combined ratio 92.2 | Each house compiles its own industry aggregate |
| US uninsured, 2025 | Census: 7.9%, 26.7M | CDC NHIS: 8.3%, 28.0M | Census counts the full year, NHIS the day of the interview |
| US life insurance in force | ACLI: $22.2T (2023) | ACLI: $22.0T (2024) | Group coverage fell from $8.10T to $7.85T |
The catastrophe spread is the widest. Swiss Re's sigma 1/2026 booked $107 billion, Munich Re's 13 January news release $108 billion and the Gallagher Re Natural Catastrophe and Climate Report of 21 January 2026 $129 billion. Gallagher Re's total counts losses covered by public entities alongside private insurers. The devil's in the details: a $22 billion spread on one year's losses beats the whole global cyber market.
US property-casualty insurance: $1.12 trillion in direct premiums and a $31.7 billion first-half gain
US carriers wrote $1.116 trillion in direct premiums across all P&C lines in 2025, according to the NAIC's 2025 Market Share Reports, published in August 2026. Verisk and APCIA report a $63 billion net underwriting gain for 2025, net written premiums up 4.8% to $971 billion and $148 billion in net income after taxes.
The first six months of 2026 kept going. Net underwriting gain hit $31.7 billion against $11.6 billion a year earlier. The combined ratio fell to 92.7 from 96.5 and policyholders' surplus reached $1.30 trillion, while net written premium growth slowed to 2.1%. Verisk's Saurabh Khemka warned the results "should not be mistaken as evidence that underlying risk has diminished."
Casualty lines remained under pressure, per Verisk, with bodily injury, commercial liability and umbrella hit by rising claim severity.
Largest property-casualty insurance groups
State Farm Group led 2025 with $115.3 billion and 10.33% of the market, per NAIC data. Progressive followed with $84.2 billion (7.54%), then Berkshire Hathaway at $64.5 billion, Allstate at $59.5 billion and Travelers at $43.2 billion. The NAIC ranks groups of affiliated carriers, and the five largest groups hold about 33% of the national market. Plug the shares into the market share calculator to get the concentration index.
Commercial rates, reinsurance and catastrophe losses
Prices are softening for the best accounts, and line-level data lets buyers zero in on where. The Gallagher Insurance Market Report of June 2026 shows a median property rate change of minus 2.8% in Q1 2026, while commercial auto rose 5.3% and umbrella 7.1%. Catastrophe-exposed accounts that carry more risk still see flat to higher outcomes, per Gallagher. Exposure research tools are in our property market intelligence guide.
Reinsurers have the capital to support lower prices. Loss-free US property catastrophe programs got 15% to 20% risk-adjusted cuts at the 1 January reinsurance renewals. Gallagher Re's full-year 2025 report puts global reinsurance dedicated capital at $648 billion, up 11%, with a 19.3% return on equity.
Swiss Re's US P&C outlook of July 2026 says underwriting margins are "gradually compressing as rates decline across several lines." Reserve releases helped produce the lowest first-quarter combined ratio since 2006.
Catastrophes stayed quiet in early 2026. Swiss Re data published 11 August 2026 shows $42 billion in insured losses for January to June, the lowest since 2020 and well under its $66 billion trend. Severe convective storms contribute $28 billion of it, and insured losses are expected to rise 5% to 7% a year. Munich Re puts the Los Angeles wildfire of January 2025 at about $40 billion insured.
Auto and cyber
- Personal auto was 35.8% of the US P&C market in 2023, about $318 billion, per the Treasury's Federal Insurance Office.
- Price trends have turned. The motor vehicle insurance index fell 0.8% in August 2026 after a 0.3% drop in July, per the Bureau of Labor Statistics CPI release. Swiss Re notes personal auto volume fell year on year for the first time outside a recession in decades. Vehicle price data is in our automotive industry statistics.
- Global cyber cover totaled nearly $15 billion in 2025 and should reach about $28 billion by 2030, an average rise of 15% a year from 2020, per the Munich Re Global Cyber Risk and Insurance Survey 2026. That's a drop in the bucket next to the $1.116 trillion US P&C market.
Life insurance statistics: 52% of Americans own coverage and 38% need more
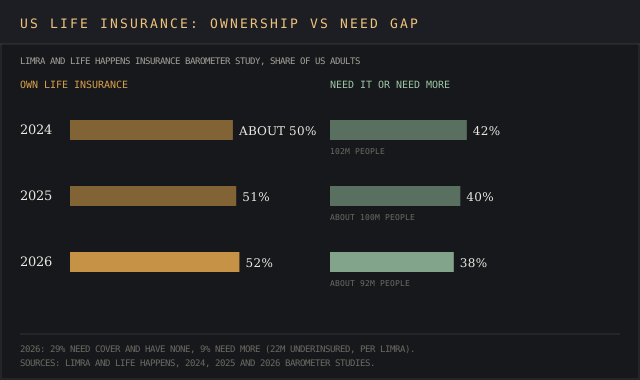
Ownership is flat and the need gap is shrinking slowly. The 2026 Insurance Barometer Study from LIMRA and Life Happens puts total life insurance ownership at 52%. Another 29% of adults need life insurance and don't have it, and 9% need more than they carry. LIMRA puts that combined 38% at roughly 92 million adults, 22 million of them already insured but underinsured; Life Happens, the study's co-publisher, counts 99 million adults who could use help getting coverage.
Ownership and the coverage gap by year
The gap was 42%, or 102 million people, in the 2024 study, released 15 April 2024 from a sample of nearly 5,000 respondents, with ownership at about 50%. Among income groups, middle-income households showed a 40% gap. The 2025 study measured 51% ownership and a 40% gap, about 100 million consumers. Men (57%) carried life insurance coverage more often than women (46%) in the 2024 data.
Parents carry more cover and still report gaps. The Triple-I's life insurance facts page, citing the 2023 Barometer, shows 59% of parents with minor children own life insurance and 47% say they don't have enough coverage. In that same year 39% of consumers planned to purchase life insurance within 12 months, including 44% of Gen Z adults and 50% of millennials.
Why people put the purchase on the back burner
Cost perception is the main brake on demand. In 2026, perceived cost led the reasons for going without coverage at 45%, per Life Happens. In 2025 cost was cited by 48% of millennials and 39% of Gen Z, the two younger groups. Younger buyers misjudge life insurance policies badly: adults aged 30 and younger put a $250,000, 20-year term policy at 10 to 12 times its true cost.
The 2024 study found 72% of Americans overestimate the cost of term cover. A term policy pays a death benefit if the insured dies within a set period. On LIMRA's numbers the real price is a tenth or less of what young adults guess, and few would call that costing an arm and a leg. Half of 2026 respondents also want retirement income or long-term care features built in.
Sales of life insurance policies
New individual life premium set a record of $17.5 billion in 2025, up 10%, and the number of life insurance policies sold rose 7%, according to LIMRA's 19 March 2026 news release. Whole life took 37% of the life insurance market, indexed universal life 25%, term 17%, variable universal life 15% and fixed universal life 6%.
The first quarter of 2026 added $4.5 billion, up 7%, and the second quarter $4.7 billion, up 3%, and LIMRA's quarterly statistics favor whole life. LIMRA forecasts 2% to 6% growth for the full year. Independent agents controlled 54% of the individual life insurance market in 2024 per the Triple-I, against 36% for affiliated agents and 5% for direct response.
Life insurance in force and benefits paid
Life insurance in force across the US reached a record $22.2 trillion in 2023 and eased to $22.0 trillion in 2024, according to the ACLI Life Insurers Fact Book 2025. ACLI data shows individual coverage rose to $14.07 trillion while group coverage fell to $7.85 trillion.
Life insurers paid $89 billion to beneficiaries in 2024 and $110 billion in annuity benefits, the most ever. Earlier editions record $100 billion in life benefits for 2021 and $104 billion in annuity benefits for 2023. Life insurers also hold $181.45 billion in long-term care reserves and $71.45 billion for disability income per the 2025 Fact Book, both carried as liabilities.
Life insurers and annuities: $1.5 trillion in direct premiums and deposits
The US life insurance industry added 6.0%, or $86.2 billion, to reach $1.5 trillion in direct written premiums and deposits in 2025, per NAIC data. Annuities brought in $546.4 billion, up 4.2%, deposit-type contracts $423.8 billion, A&H $236.5 billion and life $233.5 billion. Deposit-type contracts jumped 21.3% and picked up the slack as A&H fell 5.7%. Life insurance premiums rose 4.0%.
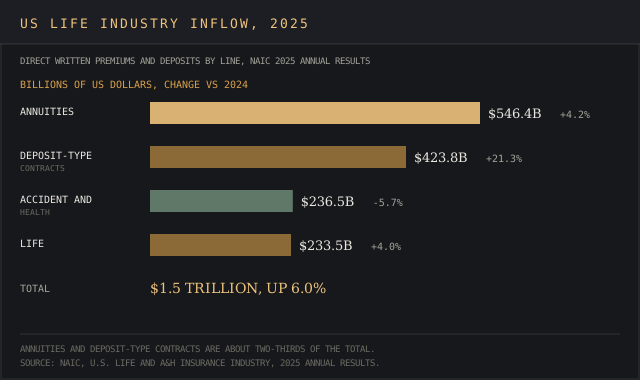
Annuities made up 55.8% of life/annuity direct premiums in 2024 on the Triple-I's count. Retail demand for annuities set a fourth straight record in 2025, with sales up 6% to $461.3 billion, per LIMRA. Buyers paid for guarantees: fixed-rate deferred annuities took $160.6 billion and fixed indexed annuities $128.2 billion.
Indexed annuities, both registered index-linked and the indexed kind with principal guarantees, made up 45% of 2025 sales. Registered index-linked annuities rose 20% to $79.6 billion. The first half of 2026 set another record at $228.7 billion.
Assets, separate accounts and capital
- Life insurance industry assets: $10.0 trillion in total net admitted assets, up 6.9%, with general account funds at $6.4 trillion.
- Separate accounts: $3.5 trillion in assets, up 8.2%, or 35.4% of total assets. Separate accounts hold the funds behind variable annuities, where policyholders carry the investment exposure and any guarantees sit on the general account.
- Cash and invested assets: $5.97 trillion. Bonds were 67.38% of life/annuity investments in 2024, cash and short-term investments 3.49% and mortgage loans 13.99%, which puts life insurers in property lending next to banks.
- Capital and surplus, what's left after liabilities: $540.7 billion, up 5.7%. Net income: $30.6 billion, up 30.7%. Net cash from operations: $219.2 billion.
- Life insurers filing with the NAIC: 727 companies, down from 743. Total benefits: $364.0 billion.
Among life groups, MetLife was the largest life/annuity writer in 2025 with 9.3% of direct premiums, ahead of Equitable Holdings (7.7%) and New York Life (6.2%). In individual life, Northwestern Mutual led with 8.8% and $14.1 billion. The Triple-I website builds these tables on NAIC data via S&P Global Market Intelligence; our ranking of financial data providers covers that vendor and its rivals.
Health insurance statistics: 7.9% of Americans uninsured, family premiums at $26,993
26.7 million people, or 7.9%, were uninsured for all of 2025 per the Census Bureau's Health Insurance Coverage in the United States: 2025, statistically unchanged from 2024. Employment-based coverage reached 53.5% of people, Medicare 20.1%, Medicaid 17.1% and direct purchase 10.5%.
The CDC's National Health Interview Survey found 8.3% (28.0 million) uninsured at interview, 11.6% of those aged 18 to 64 and 5.6% of children. Both sets of statistical data support one reading: health insurance coverage held flat in 2025. The CDC sits inside the Department of Health and Human Services.
Employer health insurance costs keep climbing. KFF data puts the average 2025 family premium at $26,993, up 6% in a year and 26% over five years, with workers paying $6,850 of it, a bitter pill to swallow. Single coverage cost $9,325 and the average single deductible $1,886. Employer plans cover 154 million people under 65, and 61% of firms with 10 or more workers offer health benefits.
National health expenditures hit $5.3 trillion in 2024, or $15,474 per person and 18.0% of GDP, according to the Centers for Medicare & Medicaid Services' NHE highlights. Private health insurance spending rose 8.8% to $1.6 trillion, 31% of the total, and Marketplace exchange enrollment reached 21.1 million. CMS actuaries also publish the detail in Health Affairs articles. Care-side labor cost data is in our nursing shortage statistics.
Five groups write 44% of the $1.915 trillion in 2025 A&H direct premiums in the NAIC's A&H market share report. UnitedHealth leads with 16.33%, then Centene (7.34%), Kaiser (7.27%), CVS (7.00%) and Humana (6.34%). Our healthcare market intelligence guide covers the research tools payer analysts use.
Insurance jobs and AI adoption: 2.93 million workers
Insurance carriers and related activities employed 2,930,000 people in August 2026 (preliminary), down from 2,946,400 in May, according to the Bureau of Labor Statistics industry profile. Average hourly earnings were $48.98 in July, per the same Bureau of Labor Statistics series. The sector covers carriers plus agencies, brokers and related services such as claims adjusting and third-party administration services.
The agent workforce is large. BLS data counts 572,600 insurance sales agent jobs in 2025 with median pay of $62,280, and projects 43,100 openings a year. Actuaries earn median pay of $130,000, hold 31,200 jobs and should add 9% from 2025 to 2035, per the Occupational Outlook Handbook.
Most health insurers already use AI. An NAIC survey of 93 health insurers in 16 states, released 20 May 2025, found 84% use AI or machine learning in some capacity. Adoption data from other sectors is in our AI statistics report, and the wider financial services research stack is in our financial market intelligence guide.
How these insurance figures were collected
Each number above comes from the body that produced the data: regulators (NAIC, EIOPA), statistics agencies (Census, BLS, CDC, CMS), trade and research groups (ACLI, LIMRA, Triple-I, KFF) and reinsurers and brokerage firms that publish their own data (Swiss Re, Munich Re, Gallagher Re, Allianz). NAIC figures come from statutory annual statements filed under its reporting guidelines.
Undated stat lists are a dime a dozen, so treat them as a red flag: AI search answers for this topic still quote 2023 Barometer figures.
The specific topics covered differ by publisher, with the NAIC reporting statutory premiums, LIMRA new sales and ACLI coverage in force. The specific topics covered on each website also shift between editions, so check the release date and the definition before quoting any of these statistics. The method is set out in our guide to secondary market intelligence.
Where each insurance figure comes from, and the 2026 totals nobody has yet
Global volume and forecasts: allianz.com (Allianz Global Insurance Report 2026, 28 May 2026) and swissre.com (sigma 2/2026 and its 8 July 2026 release, sigma 1/2026, the sigma Resilience Index 2024, the US P&C outlook of July 2026 and the first-half catastrophe estimate of 11 August 2026). Europe: eiopa.europa.eu (statistics updated 1 September 2026, Financial Stability Report of December 2025).
US property-casualty: content.naic.org (2025 Market Share Reports, August 2026), verisk.com (Verisk and APCIA, 2 September 2026, plus the full-year 2025 release), ajg.com (Gallagher Insurance Market Report of June 2026, Gallagher Re's full-year 2025 reinsurance report and its catastrophe report of 21 January 2026), munichre.com (release of 13 January 2026, Global Cyber Risk and Insurance Survey 2026), home.treasury.gov and bls.gov (CPI release).
Life and annuities: limra.com (Insurance Barometer studies of 2024, 2025 and 2026, sales releases from 19 March 2026 onward), lifehappens.org (2026 Barometer summary, 17 June 2026), acli.com (Life Insurers Fact Book 2025), iii.org (Triple-I life insurance facts) and content.naic.org (2025 life and A&H annual results).
Health and jobs: census.gov (15 September 2026), cdc.gov (National Health Interview Survey), kff.org (Employer Health Benefits Survey 2025), cms.gov (NHE highlights), content.naic.org (A&H market share report, AI survey of 20 May 2025) and bls.gov (industry profile, Occupational Outlook Handbook). Law and commentary: law.cornell.edu and berkshirehathaway.com (2024 shareholder letter).
Every figure was checked against its source on 1 October 2026. No publisher cited here has full-year 2026 premium, loss or claims totals yet, so the 2026 numbers on this page are forecasts, half-year and quarterly results, monthly readings and survey answers.
Frequently asked questions
What percentage of people get life insurance?
52% of US adults own life insurance in 2026, per LIMRA and Life Happens. In 2025 the figure was 51%.
What percentage of Americans are not insured?
7.9% of Americans, 26.7 million people, had no health insurance at any point in 2025, per Census Bureau data. The CDC's survey puts it at 8.3% at the time of interview.
Is the insurance industry growing?
Yes. Allianz measures 7.1% nominal growth to €6.9 trillion in 2025. Swiss Re forecasts 1.3% real growth for 2026 and 1.6% for 2027.
Who is the #1 insurance company in the USA?
It depends on the line. State Farm leads property-casualty with 10.33% of direct premiums, UnitedHealth leads accident and health with 16.33%, and MetLife leads life and annuity with 9.3%.
Why is insurance rising so much?
Claims costs drive it. Catastrophe losses topped $100 billion again in 2025 on all three published estimates, US health expenditures rose 7.2% in 2024 and employer family coverage rose 6% in 2025. Auto is the exception, with the CPI index falling in July and August 2026.
How are statistics used in insurance?
Actuaries use mathematics, statistics and financial theory to analyze the economic costs of uncertainty, per the BLS. Insurers set rates from loss data by line, territory and age groups, and regulators read the same filings to judge solvency.
What is the 3-year rule for life insurance?
Under 26 U.S.C. section 2035, life insurance policies transferred within three years of the insured's death are included in the gross estate as if the decedent still owned them, and the Internal Revenue Service applies estate tax on that basis.
What does Warren Buffett say about life insurance?
His insurance commentary centers on Berkshire's property-casualty book. In his 2024 shareholder letter he wrote that Berkshire receives "payment upfront and much later" learns the cost, and that its float grew from $46 billion to $171 billion.
Why do most insurance agents quit?
BLS data shows commissions are the most common pay structure, and many of its projected 43,100 yearly openings come from replacing agents who switch occupations or retire.
Bottom line
Insurance keeps getting bigger in money terms, but against 4.0% inflation a 1.3% real forecast means most of the 2026 rise is price. US P&C carriers posted a 92.7 combined ratio through June, and soft property rates show where that margin goes next.
Life insurance ownership sits at 52%, while 38% of adults, about 92 million people, carry less cover than they need or none. Health is the fastest-rising segment worldwide, and the US pays for most of it.
When two publishers disagree, check the unit before quoting the statistics. For the same method applied to another market, see our advertising industry statistics.