Risk Assessment Matrix Template
 By Jan Suski. I go deep on every review, checking every number against its source and digging up details other coverage misses, a habit from six years of SEO and link building for tech companies. Bylines at Surfer, Brand24, and Senuto. How the scoring works.
· Prefer this source on Google
A risk assessment matrix evaluates risks by likelihood and impact, plotting each one on a grid so a team can see which risks need immediate attention and which can wait. This risk matrix template gives project managers a working grid already laid out: list the risk, score it, plot it, and act on what the plot shows.
Creating a risk assessment matrix doesn't require specialized software and can be done using common tools like Excel or Google Sheets, which is exactly what this risk matrix template is built for. It slots into the same market intelligence toolkit as a SWOT analysis template: both convert a scattered set of judgment calls into a document a team can compare over time.
Download the Free Risk Assessment Matrix Template
Download the risk assessment matrix template (XLSX)A 5x5 scoring grid, a risk register tab with owner and mitigation columns, and a worked example row filled in.
Both tabs import cleanly into Google Sheets; the risk-scoring formulas recalculate automatically once likelihood and impact are entered.
What Is a Risk Assessment Matrix?
A risk matrix has two axes: likelihood and impact. Risks are plotted on a grid with likelihood on one axis and impact on the other, and where a risk lands on the risk matrix decides how much attention it gets. How loudly someone argued for it in the planning meeting does not.
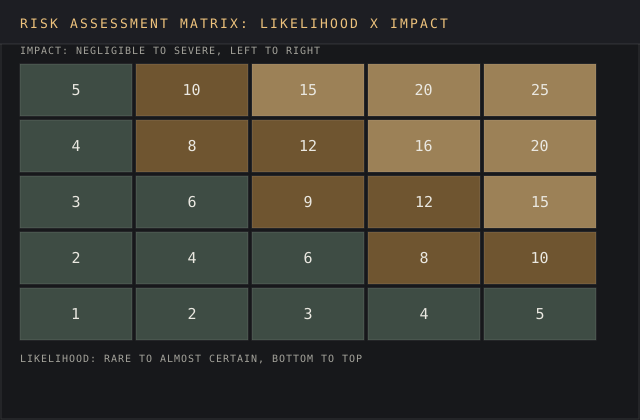
A risk matrix typically uses a 5x5 grid format, though a simpler 3x3 grid suits smaller teams and lower-stakes decisions. A 5x5 risk matrix categorizes risks into five severity levels, from negligible to severe, crossed against five likelihood bands, from rare to almost certain, for 25 possible cells.
Risk scores in a 5x5 matrix range from 1 to 25. Scores of 1 to 6 indicate low risk, moderate risks sit in the middle bands, and high-risk scores of 15 to 25 require immediate corrective actions.
Color-coding is used to indicate risk levels: green for low, yellow for medium, and red for high, which is why most risk assessment tools default to a traffic-light palette on a risk assessment matrix.
How to Build a Risk Assessment Matrix
The first step in building a risk matrix is identifying potential risks. Teams identify risks through brainstorming sessions and document them in a risk register, pulling from past incidents, industry checklists, and input from every function the project touches.
- Identify the risks. Log each one in the risk register with a short description and an owner, so the risk management plan has a name attached to every entry.
- Assess likelihood and impact. Risks are assessed using predefined qualitative scales, typically five bands each, so two reviewers using quantitative methods or qualitative judgment land close to the same likelihood rating.
- Calculate the risk score. Multiply likelihood by impact, or use the matrix's built-in cell value, to get a single numerical value for sorting.
- Plot the risks on the matrix. Placing every identified risk on the grid at once is what turns a list into a matrix a team can act on visually, and mapping risks this way surfaces clusters a spreadsheet sort never would.
- Develop mitigation strategies. Mitigation actions can include reducing likelihood, reducing impact, transferring risk, or accepting risk, chosen per cell.
High probability and high impact risks receive the highest priority. Work the top-right corner of the matrix first; a long tail of low-likelihood, low-impact risks can wait for the next scheduled review.
Risk Levels and What They Mean
| Risk score | Risk level | Response strategy |
|---|---|---|
| 1-6 | Low risks | Monitor, no immediate action required |
| 7-14 | Medium risk | Assign a risk owner, schedule a mitigation plan |
| 15-25 | Severe risks | Immediate corrective action, executive visibility |
The matrix categorizes risks as high, moderate, or low based on scores, and a risk assessment matrix's real value is forcing the same scoring discipline onto every risk event, so a loud stakeholder's pet concern doesn't outrank a quiet risk that would cause more financial loss.
A risk owner is assigned to each risk for monitoring and management purposes, and the owner, and never the matrix, is who moves a risk from identified to resolved. Risk ratings should be revisited whenever new information about likelihood or severe consequences comes in, ahead of the fixed review calendar.
How Often to Update the Matrix
The risk assessment matrix is regularly updated to reflect new threats or changes in risk status. Update the risk matrix at least quarterly for most projects, and more often for anything moving fast through a volatile risk environment.
High-velocity risks require continuous monitoring. A data breach risk or a supply disruption risk can move from low likelihood to high impact within days, and a matrix that only gets touched once a quarter will miss that window entirely.
Document each matrix update with management sign-off, trigger off-cycle reviews for significant business changes, and refresh the matrix annually at minimum to meet framework requirements even on projects where nothing dramatic happened all year. Financial institutions in particular tend to formalize this cadence in writing.
How Risk Probability Is Determined
Assessing likelihood starts by evaluating risks against past data where it exists: incident logs, near-miss reports, and industry benchmarks for how often a given risk occurring has happened before. Where no history exists, teams fall back on quantitative methods, expert judgment scored against defined probability levels, so two different reviewers land on comparable numbers.
A risk with high likelihood gets flagged for monitoring even at low impact, since frequent, small failures compound into an operational drag a single severe-but-rare event never causes. A risk with low likelihood and high impact gets the opposite treatment: cheap insurance in the form of a written response plan, checked periodically. An active mitigation program here would cost more than the risk itself.
Manage risks by revisiting probability levels whenever a project's environment changes, a new regulation, a new vendor, a new market, since the identified risks logged at kickoff rarely carry the same likelihood six months later.
Allocating Resources by Risk Priority
A risk assessment matrix exists to answer one resource-allocation question: which of the identified risks deserves budget and attention this quarter, and which can wait. Ranking project risks by score, then reading down the list until the budget runs out, is a more defensible way to allocate resources than funding whichever risk got mentioned most recently in a meeting.
High priority risks, the ones in the top-right cells, get first claim on mitigation budget, a dedicated owner, and a shorter review cycle. The risk rankings below them still matter for informed decisions about contingency planning, even though they don't receive active mitigation spend, since decision making about where to underspend is itself a documented choice.
This ranking approach protects organizational success from a different failure mode: a project that spends evenly across every risk in the register looks disciplined but is undirected in practice. The projects that hit the most significant threats hardest, and treat the rest as tracked but tolerated, are the ones whose project success rate holds up when a significant threats event lands.
Risk Assessment Matrix vs Other Risk Assessment Tools
A risk assessment matrix is one of several risk assessment tools, and it helps to know where it fits against the others. Hazard identification checklists catch risks a matrix assumes are already logged; a risk register captures the narrative detail a matrix's single cell can't hold; and quantitative risk analysis, expected monetary value, Monte Carlo modeling, gives a dollar figure a qualitative risk matrix only approximates.
Most project management and risk management programs use a risk matrix as the fast, visual first pass, then apply one of these other risk assessment tools to the handful of risks that land in the high-priority band, since running a full quantitative risk analysis on every entry in the risk register would take longer than the project itself allows.
A risk control matrix template extends the same idea one step further, adding a column for the specific control in place against each identified risk based on its likelihood rating, which is useful once a team moves from assessing risk to auditing if the planned response happened.
Pairing this matrix with a stakeholder map template keeps the sign-off list for each mitigation plan honest, since the owner assigned in the risk register should match a named quadrant on the stakeholder map.
Why Use a Risk Matrix
Risk matrices improve decision-making through clear visual representation: a grid communicates relative risk severity in a glance in a way a bulleted list of concerns never does. They improve communication and collaboration across teams, since finance, operations, and legal can look at the same plotted risk and agree on what informed decisions it demands.
The matrix helps prioritize risks for effective resource allocation, and risk matrices help drive risk mitigation strategies targeted to each identified risk's actual severity matrix position and its risk impact on the wider risk environment.
The matrix is a visual tool first and a scoring system second: risk matrix work happens in the room where the plot gets discussed. The spreadsheet cell that generates the number is bookkeeping. That's also why the matrix stays important even for risk events whose severe consequences are well understood, since agreeing on where a risk sits is often harder than agreeing on what to do once it's there.
Response strategies and mitigation efforts still need a name and a date attached, or the matrix becomes a wall chart nobody manages risks against.
Minor consequences deserve a lighter response plan than severe consequences, and writing that distinction down is what separates a risk matrix that changes behavior from one that just decorates a status report.
Risk Matrix Templates Across Project Types
A single risk matrix template rarely fits every project a risk management program covers. Construction and infrastructure work plots potential risks around safety and weather; software projects plot potential risks around security and vendor dependency; financial projects plot potential risks around compliance and market exposure. The grid stays the same five-by-five shape; the risk levels attached to each axis change with the domain.
Project managers running several projects at once benefit from keeping one risk matrix template shared across teams, even when the specific risks differ, since a common scoring scale lets a portfolio view roll up low risks and high risks the same way a single project would. A risk rated 20 on one project should mean the same thing, and demand the same immediate attention, as a risk rated 20 on another.
Plot risks on the shared template consistently and risk ratings become comparable across a whole portfolio. That's the leap from risk management as a per-project habit to risk management as an organizational capability.
Common Mistakes with a Risk Assessment Matrix
Treating the matrix as a one-time exercise is the most common failure: a risk register built at project kickoff and never revisited stops reflecting reality within a month on any project of real length, and critical risks that emerge later go untracked.
Skipping the qualitative detail behind each risk score is the second failure. A cell on the grid tells a team the risk score; it doesn't explain why the risk exists or what would reduce it, so the register entry behind each plotted point still needs a real description tied to the project's actual risk environment.
Letting one department own the whole assessment process is the third failure. Risk identification is strongest when it pulls from every function a project touches, since finance sees financial loss and most pressing threats to budget first, security sees data breach risk first, and operations sees delivery risk first.
A Worked Example
A mid-size company launching a new payment feature builds a risk register with entries including a data breach, a vendor API outage, a compliance filing delay, and a slower-than-planned user adoption curve.
Scoring each on a 1-to-5 likelihood and 1-to-5 impact scale places the data breach risk at high impact but low likelihood, plotting it in the upper-left of the matrix; the vendor API outage lands high on both axes, in the manage-immediately corner; the compliance delay scores moderate on both; and the adoption curve risk scores low impact, moderate likelihood.
The mitigation plan that follows puts a contractual SLA and a fallback vendor against the API outage risk first, since it sits in the highest-priority cell, while the data breach risk gets a response plan on file but no immediate project delay, since its likelihood is low even though its potential consequences are severe (the average cost of a data breach hit $4.99 million in 2026). Security, legal, and product leads all sign off on the plan before the launch date.
FAQ
What are the 5 steps of risk assessment?
Identify the risks, assess likelihood and impact, calculate a risk score, plot the risks on the matrix, and develop mitigation strategies for the highest-priority cells first.
What is the 5 by 5 risk assessment matrix?
A grid with five likelihood bands on one axis and five impact or severity bands on the other, producing 25 cells and risk scores from 1 to 25 once likelihood and impact are multiplied together.
What are the 5 pillars of risk assessment?
Hazard identification, risk analysis, risk evaluation, risk control or mitigation, and ongoing monitoring, the same structure a risk assessment matrix supports visually.
What are the 5 types of risk assessment?
Qualitative, quantitative, generic, site-specific, and dynamic risk assessment; a risk matrix most often supports the qualitative form, since it relies on rated likelihood levels.
Bottom Line
A risk assessment matrix turns a scattered set of worries into a ranked, owned list: identify the risks, score likelihood and impact honestly, plot the matrix, and put a name against every cell that scores high. Update it on a fixed schedule, ahead of anything going wrong, since the projects that get surprised by risk are almost always the ones whose risk matrix went stale months before the risk landed.