Root Cause Analysis Report Template
 By Jan Suski. I go deep on every review, checking every number against its source and digging up details other coverage misses, a habit from six years of SEO and link building for tech companies. Bylines at Surfer, Brand24, and Senuto. How the scoring works.
·
A root cause analysis report template is a fixed document structure that walks an investigation from what happened to why it happened to what stops it from happening again.
The person running the root cause analysis works from a fixed set of sections: a problem statement, a timeline, the root cause itself, the contributing factors, the corrective actions, and a verification plan. Skip any one of those sections and a root cause analysis report turns into a summary nobody can act on.
This page covers what belongs in each section of a root cause analysis report template, four RCA tools you can use to identify the root cause itself, a full worked example with real numbers, and the mistakes that show up most often in a finished root cause analysis RCA template. A downloadable version sits at the top of the page in Word and Excel formats.
The template suits maintenance teams investigating equipment failure, quality teams tracking a defect, and operations teams documenting a process breakdown for a customer or a regulator. An analysis template earns its keep once more than one person has to read the same failure.
Key takeaways
A root cause analysis report template forces a structured approach: problem statement, timeline, root cause, contributing factors, corrective actions, verification plan, in that order, every time.
Root cause analysis templates only work if the team keeps digging past the first answer. A cause that still has a deeper "why" behind it is a symptom. The true root sits one level deeper.
Corrective actions solve the immediate failure. Preventive measures and a consistent template prevent recurrence and cut down on recurring problems, the same benefit every set of root cause analysis templates should deliver.
An analysis template only helps if it gets filled in the same way every time; a half-finished one is worse than none.
Download the free root cause analysis report template
Download the RCA report template (DOCX)The six-section report structure, pre-built, with the Ridgeline Components example filled in for reference.
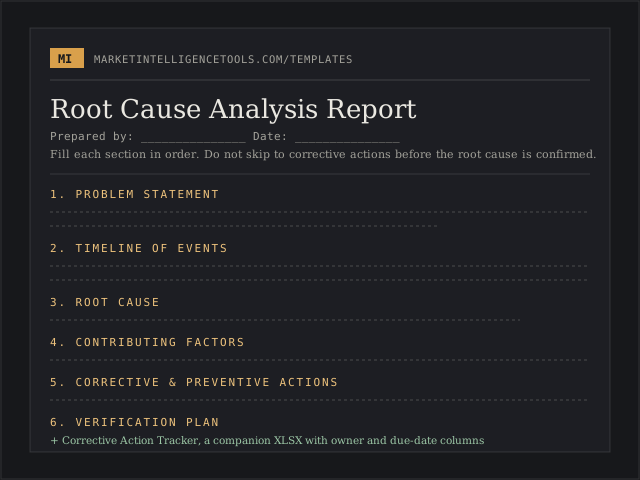
Download the corrective action tracker (XLSX)A companion spreadsheet with owner, due-date, and status columns that compute themselves.
The template ships as a Word document with the six sections pre-built, plus an Excel version for teams that track corrective actions in a spreadsheet next to a due-date column. Both root cause analysis templates open the same six-part structure, so a template started in one format moves into the other without renaming a section.
This root cause analysis RCA template also works as a corrective action template once the six sections are filled in, and it joins the rest of our market intelligence templates library.
What a root cause analysis report documents
A root cause analysis RCA report is the written output of an investigation, separate from the interviews, sensor logs, and inspection records that feed it. The template turns that raw material into something a manager, a customer, or an auditor can read in ten minutes and trust: what happened, why it happened at a level deep enough to solve the problem for good, and which solutions close the gap. It's problem solving with a paper trail.
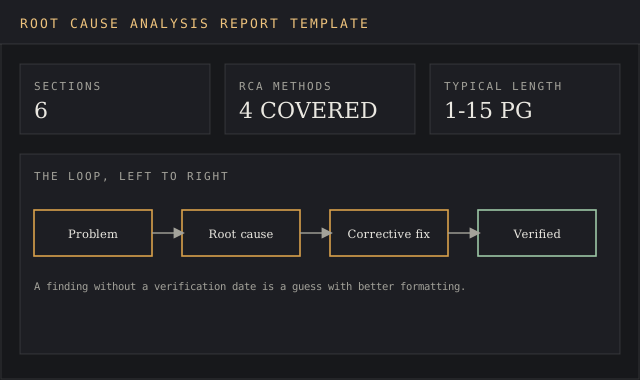
Teams that skip the template still do the analysis. They talk it through in a meeting, someone jots a few notes, and three months later the same failure repeats because nobody documented the root cause the first time. Without proper documentation, a different shift rediscovers the same underlying causes from zero.
Why a consistent template beats writing from scratch
A consistent template gives every report the same structured approach, so results from different shifts or plants sit side by side. That comparison makes trend analysis possible: the same root cause analysis RCA problem on three separate lines points at one systemic gap. Our benchmarking report template covers the same cross-plant comparison for KPIs that live outside a single RCA.
Skip it and a facility keeps solving problems that keep coming back, since nobody connected the root cause analysis templates to each other; the same recurring problems and recurring challenges resurface every few months. Keeping every past template in one platform makes that pattern visible fast: fewer safety incidents, fewer future issues, real continuous improvement.
The parts of a root cause analysis report
Six sections repeat across almost every set of root cause analysis templates, in the same order, because each depends on the one before it. Treat the six-part process as fixed, even when the content inside each section changes; every section here exists to prevent recurrence. The table below shows what each section documents.
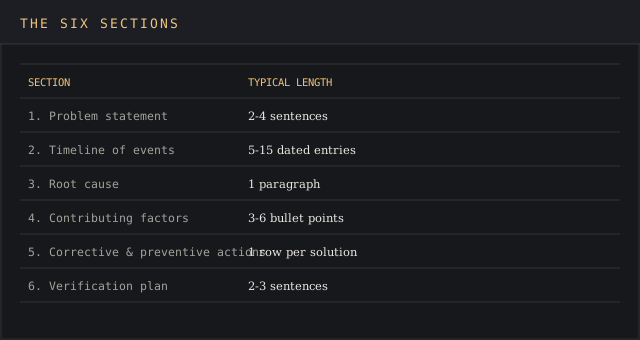
| Section | What it documents | Typical length |
|---|---|---|
| Problem statement | What failed, when, where, and the measurable impact | 2-4 sentences |
| Timeline of events | Chronological sequence of what happened before, during, and after the failure | 5-15 dated entries |
| Root cause | The single underlying condition that, once fixed, prevents recurrence | 1 paragraph |
| Contributing factors | Conditions that raised the odds or severity of the failure without causing it alone | 3-6 bullet points |
| Corrective & preventive actions | Specific solutions, each with a named owner and a due date | 1 row per solution |
| Verification plan | How and when the team confirms the fix worked, plus any follow ups still open | 2-3 sentences |
The problem statement is the section most templates get wrong: "the machine broke" carries no data anyone can act on. A clear problem statement names the asset, the timestamp, the downtime duration, and the cost: "CNC station 4 produced 58 out-of-tolerance brackets between 06:40 and 14:10 on a Tuesday shift, a 7.5-hour disruption that triggered a $22,400 customer return."
Skipping a clear problem statement is the single biggest reason a finished RCA report gets sent back for revision.
The root cause section is where teams stop too early. A root cause is the fundamental cause: the one underneath the symptom and every contributing factor. Keep asking "why" until the answer stops producing a deeper "why," or the investigation hasn't identified the true root yet.
"The pin wore out" is a symptom. Use the evidence to identify the fundamental cause standing behind that symptom: the pin's preventive maintenance schedule tracked replacement by calendar date, on a station running above its typical load for six weeks, when the interval should have been tracked by cycle count. Corrective actions exist to prevent recurrence, and a root cause stated this precisely gives them something real to fix.
Download the RCA report template (DOCX)
Root cause analysis tools worth knowing
The method a team picks decides how fast the team can identify a workable fix. Four tools cover most root cause analysis templates, and picking the right one is part of improving processes long after this failure closes.
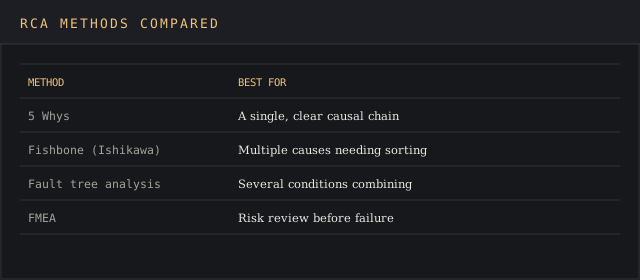
| Method | How it works | Best for |
|---|---|---|
| 5 Whys | Ask "why" repeatedly until the answer stops producing a deeper "why" | A single, clear causal chain |
| Fishbone diagram (Ishikawa) | Sorts potential causes into categories, commonly machine, method, material, man, environment, and measurement, branching toward the failure | Multiple potential causes that need sorting before the root cause is confirmed |
| Fault tree analysis | A top-down logic diagram connecting the failure to every possible cause through AND/OR gates | Complex failures where several conditions have to combine to cause the event |
| Failure mode and effects analysis (FMEA) | Rates every possible failure mode by likelihood and severity before it happens | Proactive risk review during design or process change |
A fishbone diagram, also called an Ishikawa diagram, maps cause and effect relationships across those categories. It sorts underlying causes into groups; a fishbone diagram usually feeds into a second tool once the categories narrow the field.
The DMAIC method (define, measure, analyze, improve, control) is the Six Sigma method most associated with improving processes through a quantified before-and-after. A Pareto chart, a bar graph ranking causes by frequency, ranks the possible causes so the team can identify which one to analyze first.
Most investigations combine two tools: a fishbone diagram to sort potential causes across categories, then the 5 Whys on the branch that looks most likely. Structured problem solving beats guessing, and every method on this list exists to replace a hunch with evidence. A team already scoring likelihood and severity on a risk assessment matrix can carry the same scale straight into an FMEA review.
How to fill in the template, step by step
Follow the seven steps common to most root cause analysis templates, in order, without skipping ahead to a corrective action before the root cause is confirmed.
Define the problem statement first. Name the asset or process, the date and time, and the measured impact, so the team can identify what needs fixing before anyone proposes a cause.
Gather data before you analyze it. Collect relevant data: logs, inspection records, interviews, photos, and a first list of possible causes. Treat this as evidence and keep it separate from conclusions.
Build the timeline. Order every event chronologically from the last normal state through the failure. A clean timeline helps identify the exact moment things went wrong.
Analyze the data with a structured method. Pick a tool from the table above (a fishbone diagram identifies possible causes fast) and document which one the team used, so the choice is documented in the chosen template.
State the root cause, then identify contributing factors separately. A contributing factor made the failure more likely or more severe; the root cause is what caused it.
Assign every solution to a named owner with a due date. "Improve the maintenance schedule" isn't a solution anyone can verify. "Switch PM tracking for CNC station 4 from calendar days to cycle count, owner: J. Alvarez, due in 10 business days" is one.
Set a verification date. Confirm the solution worked before closing the template, and log any follow ups the team still owes.
Download the corrective action tracker (XLSX)
Worked example: a bracket-tolerance failure
Ridgeline Components runs a 60-person contract machine shop producing aluminum brackets for two automotive suppliers. A shipment of 340 brackets went out on a Tuesday; incoming inspection rejected 58 units, 17% of the batch, for exceeding a 0.010-inch tolerance on a mounting hole. The return cost $22,400 in scrap and freight and stopped the production process for two weeks.
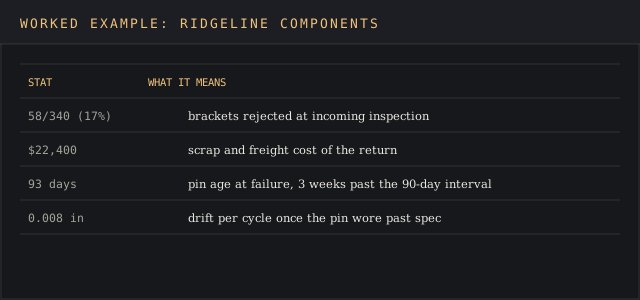
The investigative team pulled CNC station 4's tracking system log and identified a locating pin last replaced 93 days earlier, 3 weeks past its rated 90-day interval. Measurement showed the worn pin let the part drift by 0.008 inches per cycle, enough to push later units past tolerance. Analyze that sequence and the root cause emerges: a pin replacement interval tracked by calendar date on a station running above its typical load for six weeks.
Two contributing factors made it worse. The daily inspection checklist for CNC station 4 didn't include a fixture wear check, so nobody caught the drift before the batch shipped. A better tracking system, of the kind covered in our supply chain intelligence rankings, would have flagged the overdue interval automatically; the maintenance log supplied the evidence for both factors once the team went looking.
Solutions: replace the locating pin immediately (owner: maintenance lead, done same day); switch PM tracking for all four CNC stations from calendar date to cycle count (owner: reliability engineer, due in 15 business days); add a fixture wear check to the daily inspection checklist (owner: quality supervisor, due in 5 business days).
Verification plan: measure the first 25 units of the next batch at the 30-day mark and confirm they land inside tolerance, with a follow up review at 60 days.
Common mistakes that weaken an RCA report
Every analysis template fails the same six ways under deadline pressure. Fixing the process costs less than repeating the investigation.
Naming a person as the cause, when the process is what failed. "Operator error" closes the investigation before it starts. Ask what let the error happen: no checklist, no training, an ambiguous procedure.
Stopping at the first answer. One "why" rarely reaches a root cause. If a solution wouldn't solve the failure on its own, dig one level deeper.
Skipping data collection. A root cause built on memory, with no logs or photos behind it, gets challenged the first time someone disagrees. Our data source attribution guide covers how to keep that evidence traceable.
Vague solutions with no owner. "Improve training" never gets tracked to completion because nobody owns it and no date forces a check-in.
No verification step. A template that closes the moment solutions are assigned sets up the same failure to repeat.
One long paragraph in place of six labeled sections. A reader who wasn't in the room needs to identify the root cause and the corrective actions in seconds.
The goal is long term solutions. A quick patch that fails again next quarter isn't worth the paperwork, and skipping verification is how recurring problems turn into permanent fixtures.
Download the RCA report template (DOCX)
Word, Excel, or Google Docs: which format to use
A Word or Google Docs template suits a report built around narrative sections, since the problem statement, timeline, and root cause read as prose. Excel-based root cause analysis templates suit teams tracking several solutions across owners and due dates, the same way a tracking system built into a review process would. Both hold the same six sections; the choice comes down to if the solutions list needs sorting across multiple open investigations at once.
FAQ
What should a root cause analysis report include?
A complete RCA report includes a problem statement, a timeline of events, the root cause, the contributing factors, corrective and preventive actions with named owners and due dates, and a verification plan confirming the fix worked. Every section needs evidence behind the claim.
What is an RCA template?
An RCA template is a pre-built document structure with the same sections in a fixed order; the root cause analysis templates arrive pre-shaped, which saves starting from scratch every time a failure happens.
What are the 5 steps of root cause analysis?
Define the problem, gather data on it, identify possible causes and confirm the root cause among them, implement solutions, and verify the fix worked.
Can I use an Excel template for root cause analysis?
Yes. Excel-based root cause analysis templates work well for the corrective-action tracker, since a spreadsheet sorts open items by owner or due date.
What's the difference between a root cause and a contributing factor?
A root cause is the fundamental condition that, once fixed, prevents the failure from happening again. A contributing factor raised the odds or severity of the failure without causing it by itself.
How long should a root cause analysis report be?
A minor failure with a single, clear cause often fits on one or two pages; a failure affecting safety or more than one department can run five to fifteen pages once supporting data and a longer list of solutions are attached, especially inside a formal review process.
Bottom line
Reach for a root cause analysis report template when a failure needs a documented, defensible answer: an equipment breakdown, a shipped defect, a safety incident, anything a customer or an auditor will ask about again.
The six-section structure earns its place because it forces the same discipline every time: state the problem with numbers, dig past the first answer, name an owner for every solution, and confirm the fix before calling it closed. Every step here exists to help a team identify what to do next, and every family of root cause analysis templates shares that requirement.
A simpler running list handles a minor, one-off glitch. For anything that cost real money or could hurt someone if it repeats, the structured RCA template turns a one-time fix into continuous improvement the next time a similar failure shows up. Solve it once, and the next process moves faster. A template that never gets used doesn't solve anything.