Benchmarking Report Template
 By Jan Suski. I go deep on every review, checking every number against its source and digging up details other coverage misses, a habit from six years of SEO and link building for tech companies. Bylines at Surfer, Brand24, and Senuto. How the scoring works.
· Prefer this source on Google
This benchmarking report template turns performance comparisons into a document an organization can act on: which metrics trail the industry, why, and who closes the distance by when.
This benchmarking template set is part of our market research template library, and it downloads free in two pieces: a report template and a KPI analysis template with live gap formulas, the best of both worlds for a team that needs a polished narrative and a working sheet from a single download.
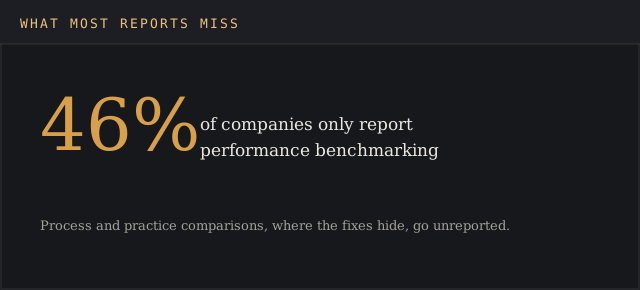
The case for structure is a number: 46% of companies only report performance benchmarking, leaving process and practice comparisons, where the fixes usually hide, out of the reporting entirely.
Download the Benchmarking Templates
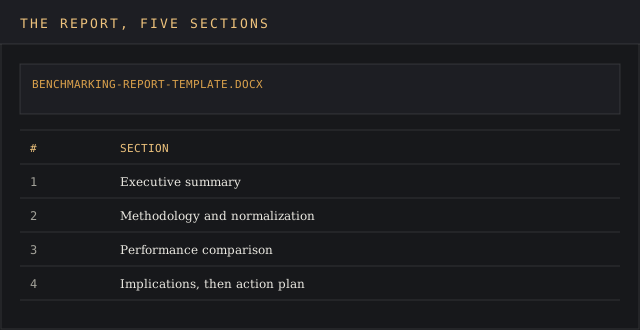
Download the report template (DOCX)Executive summary, methodology, performance comparison, implications, and an action plan with owners and deadlines.
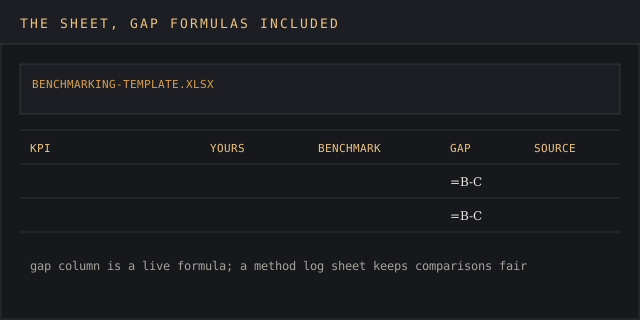
Download the benchmarking template (XLSX)A KPI comparison sheet where the difference column computes itself, plus a methodology log so every comparison stays fair.
Both carry our branding and open in Excel or Google Sheets; each benchmarking template ships with an example row to overwrite. Venngage offers ready-to-use benchmark report templates and SlideTeam provides 20 benchmarking layouts for slide formats, if the deliverable must be a deck; the analysis template above focuses on the document and the data.
What Is a Benchmark Report?
A benchmarking report is a data-backed document comparing processes and performance against industry leaders, industry standards, or other units of the same organization.
It uses key metrics like growth, conversion, and efficiency, and an effective benchmarking report translates benchmark data into actionable insights.
The purpose is direction: benchmark reports help identify strengths and weaknesses, set improvement targets, and inform strategic decision making with data driven insights.
Why Use a Benchmarking Template?
A benchmarking template does for comparative analysis what any template does for research: it fixes the parameters and scope up front, so every quarter's benchmarking analysis measures the same things the same way and keeps every team on the same page about what a gap means.
The business case is priorities: benchmarking results show where improvement buys the most, which turns resource allocation into an evidence question and surfaces improvement opportunities instinct misses.
It also compounds. Companies that create a benchmarking template once, then reuse the template, can evaluate progress across quarters, measure outcomes against industry standards, and inform strategies and business decisions with trend lines.
Shortfalls get found sooner: shortfalls against industry standards in efficiency or profitability get found sooner, and the fixes feed business growth while competitors still benchmark annually.
Access matters too: a benchmarking template the whole business can open beats a private analysis, and insights that every team using the report can check get acted on, so the reporting habit and the insights both stick.
The Three Types of Benchmarking
Benchmarking includes competitive, functional, and internal types; the benchmarking template works for all three, and so does the reporting structure.
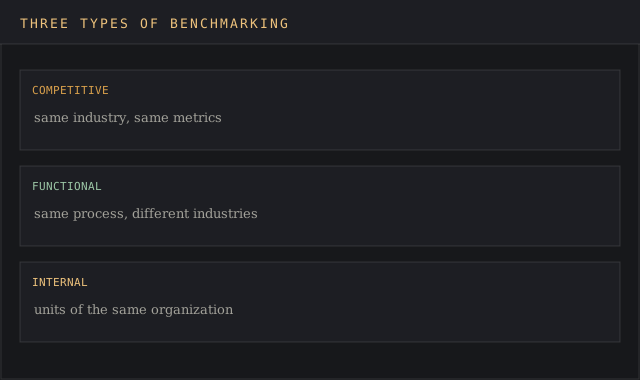
Competitive benchmarking compares performance within the same industry: your conversion rates against competitors' published numbers, your pricing and services against theirs.
Functional benchmarking compares processes across different industries; a hospital studying hotel check-in is the classic example.
Internal benchmarking assesses performance within different units of the same organization, useful when external benchmark data is thin and internal performance varies by region or team; the same template and the same analysis serve all of it. One build kills two birds with one stone: it standardizes internal comparisons and slots straight into competitive or functional benchmarking whenever the data allows it.
The Benchmarking Process
A full benchmarking process involves planning, data collection, analysis, and reporting, in that order; a structured benchmarking process also includes selecting meaningful comparisons and documenting methodologies before any benchmarking numbers move.
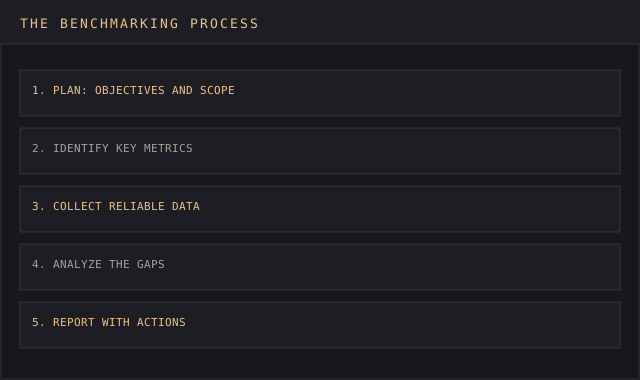
Define objectives and scope before creating a benchmark report; clear objectives decide everything downstream, including which companies and industry benchmarks are relevant at all.
Identify key metrics that align with your objectives, then collect data from reliable internal and external sources: industry reports, government statistics, public filings, and your own CRM and analytics systems.
Analyze and compare data to identify performance gaps, then present the findings with clear insights and actionable recommendations; the report is the process's product, and reporting quality decides if anything changes.
What Goes in the Report
Key components of a benchmarking report include an executive summary, methodology, and performance comparison, followed by implications and an action plan.
The implications section explains the significance of performance gaps: a benchmarking report should contextualize data to explain why gaps exist, because a number without context is noise, and executives challenge unexplained numbers first; a report that hits the nail on the head names the cause behind the gap, with a number attached to it.
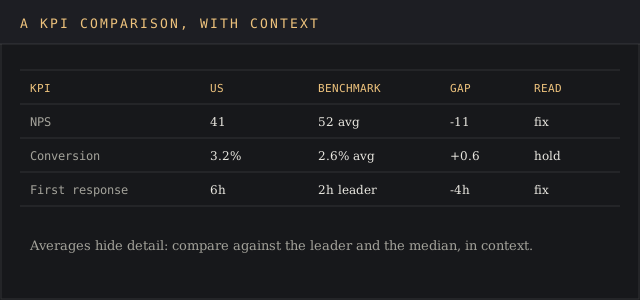
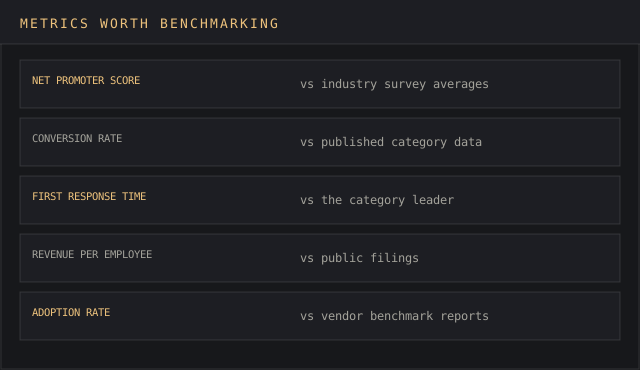
A good benchmarking report focuses on a small set of critical KPIs; performance metrics can include net promoter score, conversion rates, and adoption rates, and data visualization aids in comparing performance metrics against benchmarks at a glance; reporting stays honest when every chart names its source.
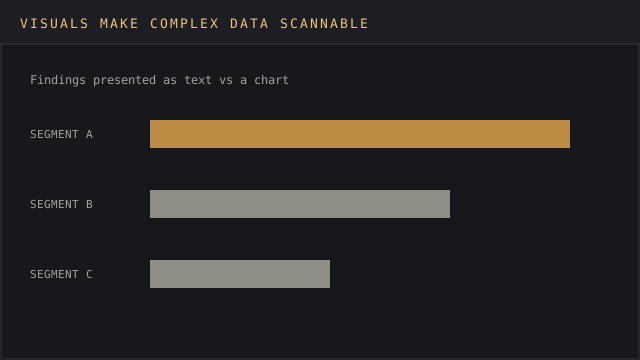
Benchmarking reports should include an action plan with assigned ownership and deadlines; identify best practices by analyzing the performance and processes of top performers, then borrow the practices that fit. That is where benchmarking helps improve processes and gauge effectiveness, and where business growth starts.
Common Reporting Mistakes
Comparing mismatched data leads to misleading insights: different periods, currencies, or definitions have to be normalized first, and the methodology log in the analysis template exists to normalize data and keep fair comparisons on record. Mismatched data is the elephant in the room in most benchmarking decks: everyone sees the gap, few confirm the two sides are measuring the same thing.
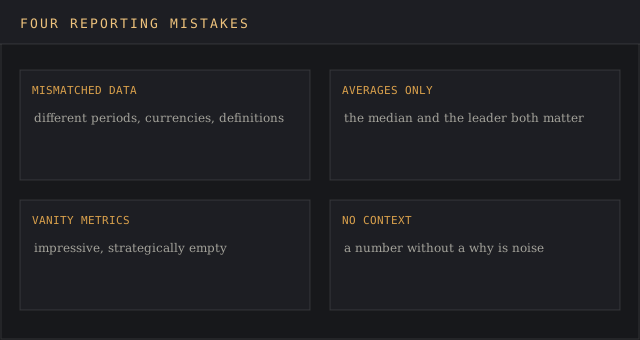
Reporting only averages misses critical performance details; compare against the median and the leader. Vanity metrics provide little strategic value in reports, leaving out context makes numbers meaningless, and ignoring data quality can skew benchmark analysis results badly enough to reverse a business conclusion and the strategies built on it.
Data sources deserve the same scrutiny: current, well-documented sources improve benchmarking reliability, and stale industry standards benchmark you against a market that has moved. Our sources of market intelligence guide covers where reliable benchmark data lives, and the market intelligence tools ranking compares the platforms, Similarweb among them, that supply competitors' performance data at scale.
Benchmarking Against the Market
Competitors make the hardest column to fill, because competitors publish selectively. Market research covers part of it: industry reports carry the industry average, analyst services carry medians, and platform data fills the rest. For pay, the compensation benchmarking tools we rank publish market medians by job, level and location.
For customer-side metrics, benchmark against what customers of the whole category report: review platforms publish customers' satisfaction and adoption statistics per industry, ready benchmark data by relevant segment. Our G2 review covers mining those numbers.
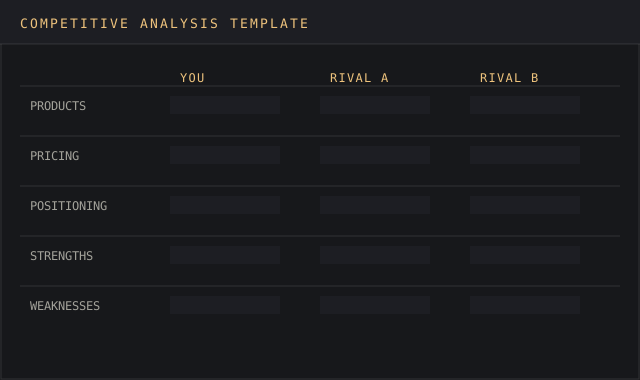
Accuracy beats coverage. Three relevant, current benchmarks against named competitors inform more decisions than thirty stale ones, and the findings and the reporting stay defensible when systems of record back every cell and source systems get named.
Benchmarking in Excel and Google Sheets
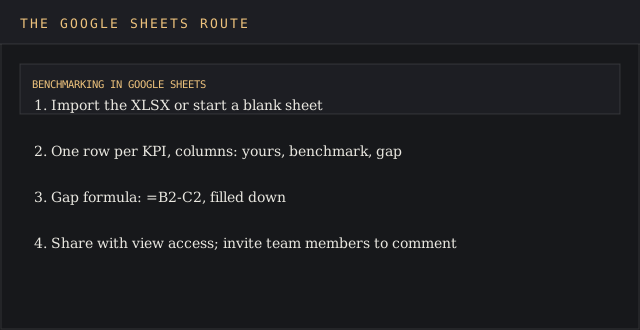
How to do benchmarking in Excel: one row per KPI, columns for your value, the benchmark, the delta, and the source, with the delta as a formula. The XLSX benchmarking template above arrives built exactly that way, an analysis template ready for the first benchmarking pass.
The same file imports into Google Sheets cleanly, and Google Sheets is often the better home for the working copy: share it with view access, invite team members to comment, and the benchmarking template becomes the living scoreboard while the DOCX stays the quarterly reporting layer.
A practical Google Sheets habit: keep one tab per quarter and duplicate forward. Track progress across tabs and the trend line becomes its own insights layer; access history in Google Sheets also shows who checked the numbers, and easy access decides which metrics the business watches, keeping the whole team up to speed without a separate status meeting.
Teams already deep in Google Sheets can skip Excel entirely; the benchmarking template's formulas are plain subtraction, so nothing breaks in translation, and organizations can use the same analysis template for competitive, functional, and internal benchmarking by adding a type column.
FAQ
What are the 5 phases of benchmarking?
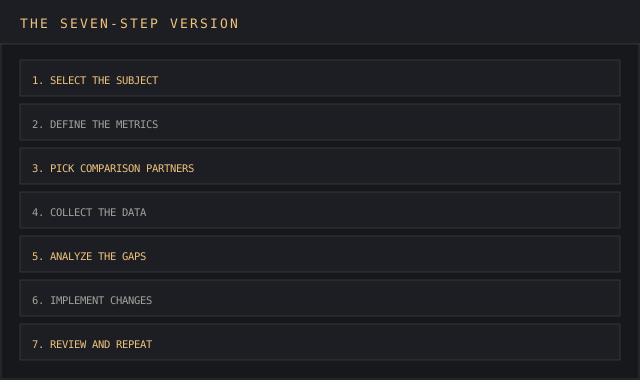
Plan, identify metrics, collect data, analyze the deltas, report with actions, the five-step process shown above. Some frameworks split reporting into implement and review, which yields the seven-step version.
What are the four types of benchmarking?
Competitive, functional, and internal are the standard three; frameworks that list four add strategic benchmarking. The first three compare processes or performance; strategic benchmarking compares long-term business models.
What are the 4 stages of benchmarking?
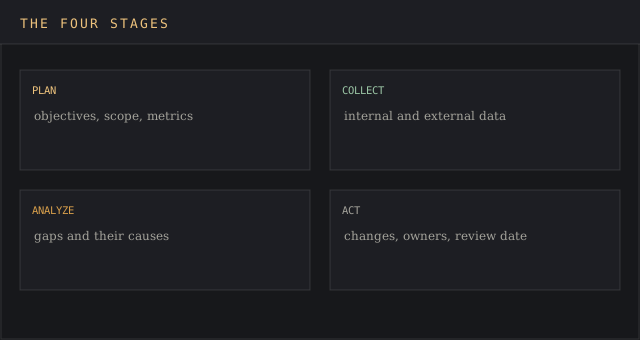
Plan, collect, analyze, act, the compressed version of the same process; the reporting step lives inside act.
What is a benchmark template?
A pre-built template for the comparison: KPI rows, benchmark columns, a difference calculation, and a place for sources and context. Both downloads on this page are benchmark templates, one shaped as a reporting template and one as an analysis sheet.
What is the purpose of a 2x2 matrix in competitive analysis?
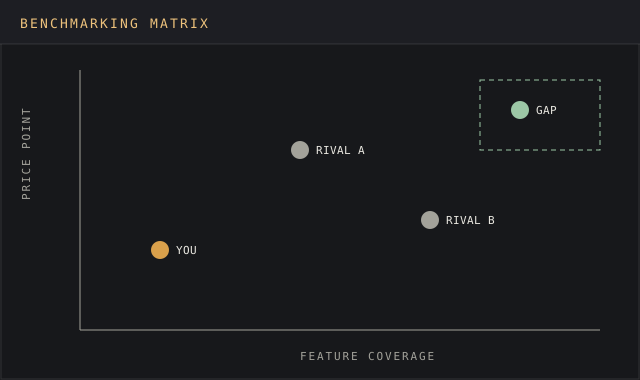
It plots competitors on two dimensions, price against breadth is common, so the open market position becomes visible before strategies get set. The competitive analysis template includes the matrix and the data sheet behind it.
How do you write a benchmark report?
Define objectives and scope, identify the metrics, collect and normalize data, analyze the gaps, then create the reporting in order: summary first, methodology, comparison, implications, action plan. The DOCX template holds the order.
What is an example of benchmarking?
A support team measuring its 6-hour first-response time against a 2-hour category leader, tracing the shortfall to staffing windows, and setting a staffed-hours change with a deadline: comparison, context, action, in one example.
What is an example of a benchmark assessment?
Any scored comparison against defined parameters: a quarterly review measuring conversion, NPS, and efficiency against industry benchmarks, with each metric graded hold or fix, and the outcomes filed where the next review can create a comparison.
Bottom Line
Benchmarking works because it forces an organization to face the music: it replaces "we think we are doing fine" with a measured shortfall and a named owner; benchmarking informs strategic decision making and drives improvement only when the reporting survives scrutiny.
Download the report and the sheet, pick a small set of metrics that matter, and put the first comparison on the calendar; most companies create benchmark reports quarterly or annually, and the quarterly ones learn faster. Excellence in the report is simple to define: every number has a source, every delta has a context, and every implication has an owner with a deadline.