Compensation Benchmarking Tools: 10 Salary Benchmarking Platforms Ranked (2026)
 By Jan Suski. I go deep on every review, checking every number against its source and digging up details other coverage misses, a habit from six years of SEO and link building for tech companies. Bylines at Surfer, Brand24, and Senuto. How the scoring works.
· Prefer this source on Google
Quick comparison of compensation benchmarking tools
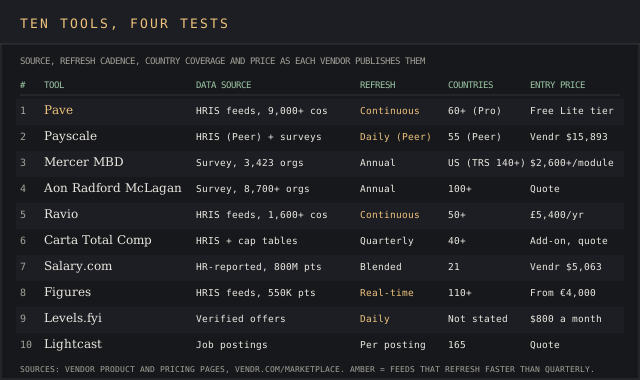
Ten compensation benchmarking tools in ranked order, with each vendor's data source and published sample, its refresh cadence, the entry price and the buyer each fits.
| # | Provider | Data source and sample | Refresh | Entry price | Best fit |
|---|---|---|---|---|---|
| 1 | Pave | HRIS feeds, 9,000+ companies | Continuous | Free Lite; $36,000 Vendr median* | VC-backed tech and equity-heavy pay |
| 2 | Payscale | Peer HRIS data, 5,400+ organizations, plus surveys | Daily (Peer) | $15,893 Vendr median* | Mid-market HR teams pricing many jobs |
| 3 | Mercer Benchmark Database | Survey, 3,423 organizations, 8.1M incumbents | Annual | $2,600 per module (participants) | Enterprises with formal job architecture |
| 4 | Aon Radford McLagan | Survey, 8,700+ organizations | Annual | Quote | Tech, life sciences and finance |
| 5 | Ravio | HRIS feeds, 1,600+ companies | Continuous | £5,400 a year at 250 staff | European startups and scale-ups |
| 6 | Carta Total Compensation | HRIS and cap tables, 1M+ employees | Quarterly | Add-on quote | Startups already on Carta |
| 7 | Salary.com CompAnalyst | 800M HR-reported data points | Blended | $5,063 Vendr median* | US employers outside tech |
| 8 | Figures | HRIS feeds, 550K data points | Real-time | From €4,000 | European companies facing the EU directive |
| 9 | Levels.fyi | Verified offers, 1,200+ companies | Daily | $800 a month | Recruiters pricing engineering offers |
| 10 | Lightcast | Job postings, 165 countries | Per posting | Quote | Workforce planners sizing new markets |
Medians marked * are anonymized buyer-reported contract values published by Vendr. Everything else is the price the vendor publishes itself.
Where these figures come from
Sample sizes, refresh cadences and entry prices are each vendor's own published figure, linked from its entry below. Medians for Pave, Payscale and Salary.com are Vendr's anonymized buyer data, and Mercer's $2,600 is the participant price for one US module. Salary.com's row reads Blended because it publishes no refresh cadence for its HR-reported data. Aon, Carta and Lightcast quote every contract, and Levels.fyi publishes no country count.
Lightcast also ranks #3 on our workforce intelligence software ranking, scored there on skills and headcount data. This page scores each tool on its pay data alone.
Compensation benchmarking tools compare what you pay against what the market pays for the same job, level and location. The good ones read salary data straight from employer payroll and HRIS feeds. The rest rely on annual salary surveys, self-reported offers or the ranges printed in job postings.
HR teams use that benchmarking to set fair pay ranges, attract candidates and stay competitive under current market conditions, while finance uses the same compensation data to size the merit budget before the board meeting.
This page ranks ten salary benchmarking tools for HR teams, compensation specialists and the finance leads who sign the merit budget. It covers the pay side of recruitment market intelligence. Prices run from Pave's free Market Data Lite tier to $48,000 a year for Levels.fyi Enterprise.
Timing matters this year for pay decisions. EU member states had to write the Pay Transparency Directive into national law by 7 June 2026, and US employers planned 3.5% total increases for 2026. A pay range you can't defend with market data is now a legal exposure as well as a retention problem.
Evaluation criteria for salary benchmarking tools
Five criteria decide the shortlist, and the ranking below weighs them in this order. Each one gives a buyer a number or a yes or no, and each changes the compensation decisions a team can defend. The research behind every score comes from vendor product, pricing and documentation pages, as set out in our methodology, and every figure links to its source.
Data source and sample size
Where do the numbers come from, and how many employers sit behind them? Payroll and HRIS feeds score above employer surveys, which score above self-reported or posting-derived pay data. The published count of companies or incumbents breaks ties, the same provenance test we apply to any market intelligence data.
Data freshness
Count the days between a pay change in the market and its arrival in your benchmark. Daily and continuous feeds score highest, a quarterly retrain sits in the middle, and an annual survey cycle scores lowest.
Data coverage by country
Count the countries the vendor publishes data for and check every location where you hire. A tool covering 21 countries is no use for a team in Lisbon if Portugal isn't one of them.
Published price or Vendr median
A list price, a published starting price or a Vendr median with its purchase count scores. "Contact sales" with no outside figure scores lowest.
A free way in
Yes if a buyer can test real benchmarks before signing: a free tier, free searches, or a participant discount for submitting your own employee data.
The 10 best compensation benchmarking tools, ranked
Pave
Best fit
VC-backed and public tech companies that pay in equity as well as cash.
Pave pulls real-time salary and equity data from 9,000+ companies through persistent connections to HRIS, ATS and equity management platforms, with no survey to fill in. Its pricing page lists 290+ job families, and the paid tier adds geo differentials for 60+ countries and 90+ metros.

Key features
- Market Data Lite: free base salary and new-hire equity benchmarking for the US plus one more market.
- Market Data Pro: custom peer groups, recent-hire filtering and unlimited exports.
- AI job matching against 290+ job families.
- Pave Agent add-ons for job architecture, a Market Pricing tool, Compensation Planning and Total Rewards.
- Pay equity analysis across roles, levels and teams.
Pricing
Lite is free with no strings attached, and every paid plan is quoted. Vendr's anonymised buyer data puts the median at $36,000 a year across 255 purchases, range $8,469 to $73,734.
Pave's dearest contract in Vendr's buyer data, $73,734, against its cheapest, $8,469. The $36,000 median says little about your own quote at either end.
Pros
- 9,000+ HRIS-connected companies, against Payscale Peer's 5,400+.
- Free tier includes new-hire equity benchmarking.
- 4.7 stars across 46 G2 reviews.
Cons
- The $36,000 median is the highest Vendr figure among the ten ranked tools.
- Lite stops at two locations.
- Data coverage thins outside US tech roles.
That last con comes up in reviews. Zak S., an HR director at a mid-market company, wrote on G2 in December 2025:
"The platform is strong overall, but the depth of available market data varies by region and role. For a global organization, the coverage does not always go far enough, which sometimes requires us to use outside benchmarks."
Why it's ranked #1. Pave wins criterion one outright with 9,000+ HRIS-connected companies against Payscale Peer's 5,400+, and its Lite tier gives away salary and equity benchmarks that Payscale keeps behind a quote. Its $36,000 median costs more than double Payscale's.
Payscale
Best fit
Mid-market HR teams pricing hundreds of jobs across several industries.
Payscale merged with Payfactors and runs both its own HRIS-fed dataset and the surveys you buy elsewhere. Its Peer dataset covers 5,400+ organizations and 9 million employees in 55 countries, refreshed daily from employer HRIS systems. The company says 60 million+ jobs were priced through Payscale in 2024 for 16,000+ customers, and it credits ZoomInfo with a 70% cut in back-and-forth over comp decisions.
Key features
- Payscale Peer: 100% employer-reported data, 5,900+ jobs, 112 industries.
- Survey load and participation: 20 surveys on Premier, unlimited on Elite, per the plan page.
- MarketPay dashboards and Smart Price for market pricing.
- Paycycle for merit cycle management, with real-time budget visibility across merit cycles.
- JobNav Recruiter for pay-transparent job postings.
Pricing
Core, Premier and Elite are all quoted. Vendr's anonymised buyer data shows a $15,893 median across 93 purchases, range $6,800 to $40,680.
Pros
- Daily HRIS refresh on 9 million employee records.
- Blends Peer data with Mercer, Radford or any survey you already buy.
- 985 G2 reviews at 4.3.
Cons
- Two-way HRIS sync and bulk structure modeling sit on Elite only.
- Third-party datasets cost extra on every tier.
- One higher education reviewer says market data lands after their own planning deadline.
Scott B., a compensation and benefits manager at an enterprise employer, called a spade a spade on G2 in September 2025: "New additions like Korn Ferry and others are thrown behind a paywall."
Why it's ranked #2. Payscale refreshes 9 million records daily and loads unlimited surveys on Elite, which beats Mercer's single annual window. It trails Pave's 9,000+ HRIS-connected companies with 5,400+ of its own.
Mercer Benchmark Database
Best fit
Enterprises with a formal job architecture and a compensation team that already speaks survey.
Mercer's US Benchmark Database is the classic survey model at scale. The 2026 edition draws on 3,423 organizations and 8.1 million incumbents across 7,232 published positions, collected in one participation window from 2 March to 24 April 2026. Mercer's global Total Remuneration Surveys reach 140+ countries and 50,000+ organizations.

Key features
- Job matching through position families, sub-families and four career streams.
- Add-on modules for Manufacturing & Operations and AI & Emerging Technology.
- WIN, Mercer's reporting tool, for scope filtering and market pricing.
- Total Remuneration Surveys priced country by country.
Pricing
Published per module. Core modules cost $2,600 to $7,100 for participants and $7,800 to $21,300 for non-participants, per Mercer's product page.
Pros
- 8.1 million incumbents, the biggest US sample with a public price.
- Participants pay one third of the non-participant rate.
- A global sister survey in 140+ countries.
Cons
- One cycle a year, so March data ages until the next window.
- Submitting your own data is easier said than done for a lean HR team.
- Extra user seats cost more.
A hospitality reviewer at an enterprise employer wrote on G2 in January 2022: "I also dislike the cost of adding additional users within the organization."
Why it's ranked #3. Mercer publishes a $2,600 participant module price and an 8.1 million-incumbent sample, which beats Aon's quote-only pricing. Payscale ranks above it on freshness, a daily refresh against one survey a year.
Aon Radford McLagan
Best fit
Technology, life sciences and financial services firms that peer against named competitors.
The Radford McLagan Compensation Database covers 8,700+ organizations and 30 million employees, with 2,100+ technology companies and 1,600+ technology jobs in that module. Aon says the database is published annually across 15+ major industries.
Key features
- 16 industry modules, from asset management and banking to retail and wealth management.
- 1,600+ targeted technology jobs in the technology module.
- 2,100+ participating technology companies.
- Fees scoped by countries, job types and headcount.
Pricing
Quote. Aon says fees depend on the number of countries, job types and employee headcount you benchmark.
Pros
- 30 million employees, the largest employee count published in this ranking.
- 2,100+ technology companies in the tech cut alone.
- 15+ major industries covered.
Cons
- Pricing by quote only.
- Annual publication.
- Give-to-get participation rules.
The give-to-get rule is the standing complaint. A mid-market reviewer wrote on G2 in February 2016 that "you have to submit employee data to get employee data." The output has defenders. One Hacker News commenter called it among the "reliable, highly accurate pay-to-access sources" in a February 2023 thread.
Why it's ranked #4. Aon's 8,700+ organizations beat Ravio's 1,600+ companies on sample size, five times over. It sits below Mercer because Mercer publishes a $2,600 module price and Aon publishes none.
Ravio
Best fit
European startups and growing companies that hire across several EU countries.
Ravio reads real-time data from the HR systems of 1,600+ companies through 60+ HRIS integrations, covering 300+ roles in 50+ countries and 618,000+ total reward data points. Base pay, equity, variable pay and benefits all sit in one dataset, so a reviewer can compare total compensation offers line by line.
Key features
- Benchmarking core with Bands and Pay Equity extensions.
- Filters for location, funding stage and headcount.
- Market trends on annual pay, hiring and attrition.
- Level mapping by a customer success manager.
Pricing
Ravio publishes a start price of £5,400 a year for a 250-person company. The homepage offers 3 free benchmark searches.
Pros
- One of four tools here with a published entry price.
- Continuous HRIS sync across 60+ systems.
- Startup peer cuts by funding stage.
Cons
- Thin data in smaller markets.
- Sample is under a fifth of Pave's.
- One G2 reviewer describes a slow implementation.
The head-to-head case for Ravio came from a mid-market insurance reviewer on G2 in March 2024:
"I know that Radford has been used at much larger companies, but that isn't as immediately useful or relevant for startups."
The thin-market con shows up in the same G2 review feed. Elisa H. wrote in December 2023: "We only use the free version of Ravio right now since they don't have enough data in our HQ country Finland yet."
For a Nordic employer, that's a red flag to test with the 3 free searches before signing.
Why it's ranked #5. Ravio publishes a £5,400 starting price, which Carta doesn't, and refreshes continuously against Carta's quarterly retrain. It trails Aon's 8,700+ organizations with 1,600+ companies of its own.
Carta Total Compensation
Best fit
Startups that already run their cap table on Carta.
Carta builds benchmarks from one million+ employees drawn from HRIS integrations and its own cap table product, which holds 40,000+ cap tables. Its ranges come from predictive machine learning algorithms retrained on a dataset updated every quarter, with 120,000+ slices of compensation data and percentiles from the 25th to the 90th.
Key features
- LLM role matching into a department, role and seniority taxonomy.
- Salary and equity benchmarks in one view.
- Geo-adjusted rates in 40+ countries.
- Total rewards statements for employees.
- Open to non-Carta customers since August 2024.
Pricing
An add-on to the Build, Grow and Scale plans, priced by the number of people on your cap table, per Carta's pricing page.
Pros
- Equity benchmarking tied to the cap table you already maintain.
- Percentiles out to the 90th.
- 40,000+ cap tables behind the equity cuts.
Cons
- Quarterly refresh.
- Priced only as a plan add-on.
- International cuts launched with 32 roles.
Grant sizing is the main use case. A startup lawyer on Hacker News wrote in October 2024 that "employee option grants can be benchmarked against comp data that you can find in Carta or Pave."
Why it's ranked #6. Carta's one million HRIS and cap-table employees outrank Salary.com's survey-reported blend on criterion one. It sits below Ravio on freshness, quarterly against continuous, and on price, where Ravio publishes £5,400.
Salary.com CompAnalyst
Best fit
US employers outside tech that need job descriptions and market pricing in one place.
CompAnalyst Market Data blends 800 million HR-reported data points across 21 countries, 225 industry breakouts and 42,000+ geographies. It also tracks pay for 50,000+ named executives at public companies.
Key features
- CompAnalyst Market Data with 27,000+ compensable factors.
- JobArchitect for job descriptions linked to pay.
- Hybrid jobs that blend two benchmark matches.
- Scope filters by industry, location and revenue.
Pricing
Quote. Vendr's anonymised buyer data shows a $5,063 median across 62 purchases, range $2,340 to $12,653.
Pros
- Lowest Vendr median on this page.
- 1,113 G2 reviews at 4.4.
- Job description library tied to market data.
Cons
- 21 countries, the narrowest global reach here.
- Refresh cadence isn't published.
- The AI matcher reads titles, per one reviewer.
The jury's still out on the AI job matcher. A reviewer at a mid-market IT services company wrote on G2 in July 2026:
"I don't trust the recommended matches because it is solely based on the title of the job"
Why it's ranked #7. Salary.com's 800 million data points and $5,063 median beat Figures' 550,000 data points on sample size. It loses to Carta on source quality, survey-reported data against direct HRIS and cap-table feeds.
Figures
Best fit
European companies preparing for the EU Pay Transparency Directive.
Figures holds total reward data on 550,000 data points in 110+ countries, synced from 30+ HRIS systems. Its homepage claims 500+ companies across Europe, including Doctolib, Qonto and KPMG.
Key features
- Structure plan: benchmarking, salary bands and pay equity reporting.
- Companion plan: annual and off-cycle reviews with manager workflows.
- Pay Equity Expert for gap analysis by worker category.
- Filters by company size, funding stage and headcount.
Pricing
From €4,000 a year, per the pricing page.
Pros
- 110+ countries from a €4,000 entry price.
- Second-lowest published entry price, after Mercer's $2,600 participant module.
- Built-in EU directive reporting.
Cons
- Thin US data.
- Only 9 G2 reviews.
- Sales roles with commission show odd on-target earnings, per one reviewer.
A mid-market reviewer in fine art summed up both sides on G2 in September 2024: "Their extensive data in Europe has been a tremendous help to us," followed by "I want to see even more U.S. data/regions."
Why it's ranked #8. Figures covers 110+ countries from €4,000 and beats Levels.fyi's engineering-heavy offer data on breadth. It trails Salary.com's 800 million data points on sample size, with 550,000 of its own.
Levels.fyi
Best fit
Recruiters building competitive offers for software engineers.
Levels.fyi sells its offer data to employers with 245,000+ data points across 1,200+ companies and 150+ titles, 75,000+ of them added in the last six months. Paid tiers refresh every day with up-to-date data checked against verified offer letters and pay statements. The vendor lists Netflix, Bloomberg and ARM among the compensation leaders buying it, and the daily cadence keeps it ahead of the curve on engineering offers.
Key features
- Daily updates on Premium and Enterprise.
- Offer-level base, stock and bonus splits.
- Verification by uploaded offer letters.
- Free public salary pages on levels.fyi.
Pricing
Plus is $800 a month for up to 2 licenses, Premium $2,000 a month for 8, and Enterprise $4,000 a month for 15, all billed annually.
Pros
- Fully published pricing.
- Daily refresh.
- Offer data shows what top talent is being offered this week.
Cons
- Engineering-heavy, with 150+ titles.
- Country coverage isn't published.
- Self-submitted data, verified only where users upload proof.
A Hacker News commenter compared it with Glassdoor in a July 2023 thread: "Glassdoor numbers are BS and levels.fyi is extremely accurate."
Why it's ranked #9. Levels.fyi publishes every price and refreshes daily, which Lightcast doesn't match on either count. Figures ranks above it with 110+ countries against 150+ mostly technical titles.
Lightcast
Best fit
Workforce planners sizing pay in a city or country before hiring there.
Lightcast holds 18 billion+ labor market data points across 165 countries, including job postings, career profiles and compensation data. Its advertised salary figures are extracted from job postings that print a range, with no estimate for postings that don't. Using it well means reading between the lines, because a posted range shows what an employer will publish before any negotiation.
Key features
- Advertised salary from job postings.
- A Salary Benchmarking API with market and national percentiles.
- Occupation earnings from government sources.
- Pay cuts by ZIP code and metro area.
Pricing
Quote.
Pros
- 165 countries, the widest coverage here.
- Shows competitor ranges before you hire.
- 4.6 stars across 30 G2 reviews.
Cons
- Figures reflect advertised ranges, before any negotiation.
- Coverage depends on how many postings print a range.
- Wage curves lean on government data.
Allison Lorraine S., a marketing data analyst, flagged the government-data lag on G2 in November 2023:
"Lightcast relies heavily on BLS data for its wage curves & talent supply by compensation reports which can drastically skew the reports towards outdated data."
Why it's ranked #10. Lightcast covers 165 countries, the widest reach here, though every salary figure comes from an advertised range in a job posting. Levels.fyi beats it with daily verified offers and an $800 monthly price.
Survey data versus real-time salary data
Real-time salary platforms pull benchmarks straight from HRIS integrations, the compensation version of real-time market intelligence. Payscale Peer refreshes daily, Pave and Ravio sync continuously, and the number on screen moves as the market moves. Survey-based market pricing tools update less often. Mercer's 2026 US database came from one window that closed on 24 April.
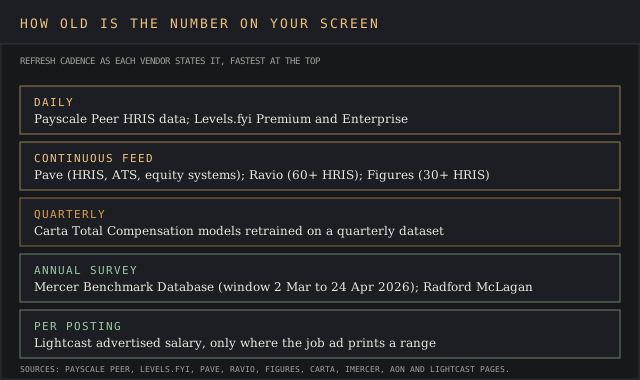
Surveys still hold the larger samples and reliable data on job leveling. Aon's 30 million employees run to over three times Payscale Peer's 9 million, the largest HRIS feed here that publishes a headcount, and standardized survey leveling makes cross-company job matching cleaner. Data quality and integration depth decide which matters more for your roles.
Comparing the two models comes down to the decision in front of you. A quarterly compensation review with executives and leadership can live with survey timing, but an offer to a candidate holding a competing bid needs this week's market rates, or the company loses top talent over a gap nobody saw.
Real-time data helps most in fast-moving industries, where a quarter-old median is already stale. For a hospital system pricing nurses on an annual budget cycle, the annual survey is par for the course.
Compensation leaders can run both. Payscale's Premier plan is built for that pattern, loading 20 third-party salary surveys next to its own Peer data so a comp analyst sees every source against one job.
How to benchmark compensation in five steps
Salary benchmarking tools provide the market data. The method around them decides if a range survives a manager's challenge or a regulator's audit, so document each step in a benchmarking report template.
- Set your goals and peer market. Write the compensation strategy down first, naming the percentile you pay at and how it serves business goals such as hiring 40 engineers in a year. Then define peers by industry, company size, funding stage and the locations where you hire.
- Match jobs by responsibilities. Job matching connects internal roles to market-equivalent positions by responsibilities and level. Write job descriptions first, because a job title alone mismatches.
- Read percentiles. Benchmarks break pay into the 25th, 50th and 75th percentiles, and Carta extends to the 90th. A 50th-percentile target means half the market pays more.
- Build salary ranges and salary bands. Building salary ranges starts with grouping roles into job families and levels. Then set a minimum, midpoint and maximum around your target percentile. That's how you get competitive pay structures that hold across similar roles.
- Run a pay equity analysis. Compare your employee data against the new bands by gender and other protected groups, then model the cost of closing pay gaps before the merit cycle.
Juicebox's guide says benchmarks should be refreshed at a minimum, annually, and Mercer's survey calendar forces that rhythm on its participants. A stitch in time saves nine. Re-pricing a hot job family between survey cycles catches a drifting range before a resignation letter does.
Free compensation benchmarking tools and what they can't do
Free salary benchmarking tools exist, and a few carry real employer data that HR leaders can use to retain talent between budget cycles. Beggars can't be choosers, though, and each free source stops short somewhere specific.
- Pave Market Data Lite. Free base salary and equity benchmarking from 9,000+ companies, limited to the US and one more market.
- Ravio. 3 free benchmark searches from the homepage.
- BLS OEWS. The Bureau of Labor Statistics publishes wage estimates for about 830 occupations by state and metro area at no charge, the standard free secondary data on US pay. The May 2025 estimates came out on 15 May 2026.
- Payscale's free salary reports. Individuals get free reports for 100,000+ job titles. Employer benchmarking needs a paid plan.
- Levels.fyi public pages. Free offer data for tech roles, with the daily employer feed behind the $800 monthly paywall.
- Glassdoor. Self-reported salary information from a community Glassdoor calls 100% free.
The catch is consistent. Free salary benchmarking tools provide market rates for a title and a city, but they won't hold your job architecture, sync with HRIS and payroll systems, or produce defensible pay ranges with an audit trail.
The government sources lag too. The BLS figures published in May 2026 describe May 2025, a gap every labor market intelligence program has to plan around.
Pave's free tier covers base salary and new-hire equity, so bonuses, sales incentives and benefits data still need a paid source or a survey. A free salary benchmarking tool works for pricing one hire. Building new pay structures for 300 employees from it means hand-matching every role in spreadsheets, and the devil's in the details of those matches.
How to evaluate tools in a 20-job pilot
Ask each shortlisted vendor to pull data for the same 20 jobs from your own roster, in a trial or a scoped demo.
Pick five hard-to-fill roles, five high-headcount roles, five roles in your smallest location and five executive or specialist roles. That mix exposes the gaps a polished demo hides.
A pilot also shows if a tool fits your compensation strategy, because a vendor that can't match your highest-paid specialist roles will push that work back to a spreadsheet.
Score four things per tool: how many of the 20 return a usable match, the sample size behind each median, the date the data was last refreshed, and how far each median sits from your current pay. A tool that matches 14 of 20 jobs leaves six salaries to price by hand, and every one of those pay decisions lands back in a spreadsheet.
Run the same jobs through two tools when the budget allows it. Where Payscale and Pave disagree by more than 10% on a median, read the sample counts before trusting either number.
Pricing across salary benchmarking software
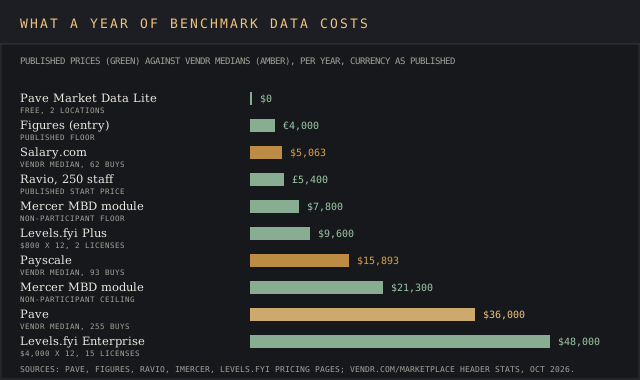
The spread runs from $0 to a $36,000 Vendr median, and four of the paid tools publish an entry price. Figures starts at €4,000, Ravio at £5,400 for 250 staff, Levels.fyi at $9,600 a year, and Mercer's US modules at $2,600 for participants.
The hidden costs sit in three places:
- Participation discounts. Mercer charges non-participants three times the participant rate, $7,800 against $2,600 on the cheapest module.
- Add-on datasets. Payscale sells third-party surveys as add-ons on every tier, and Pave sells its compensation planning tools, Compensation Planning and Total Rewards, separately.
- Seats. Levels.fyi Plus covers 2 licenses, and Mercer reviewers flag the cost of each added user.
Vendr's data shows buyers negotiating 18% off Pave and 19% off Payscale on average. Put all your eggs in one basket only after you've seen a second quote.
Pay equity, pay transparency and compliance
Salary benchmarking helps close pay gaps and keeps pay decisions defensible.
The EU directive requires pay reporting on gender pay gaps for employers with at least 100 employees, plus joint pay assessments where the data points to discrimination.
In the US, the EEOC's pay guidance for small businesses tells employers to set the criteria for compensation decisions, apply them consistently and keep payroll records for at least three years. It also warns against basing pay on prior salary.
Several tools build compliance into the workflow, and each one leaves a record of documented, defensible decisions. Figures ships EU directive reporting, and Payscale's JobNav Recruiter adds compliance automation to job postings. Pave's pay equity analytics flag gaps across roles, levels and teams, and Ravio and Figures sell pay equity modules that break gaps out by worker category.
The data model has critics. On a March 2024 Hacker News thread, one commenter asked of tools like Ravio and Pave that plug into payroll: "Isn't this also price fixing?" Read the data-sharing terms before you connect payroll.
Other tools in the category
Juicebox, a recruiting search tool, says its Talent Insights covers 800 million+ profiles for sizing comp before a survey cycle. It's a sourcing product first. Compa sells offer data to enterprise comp teams at a $80,000 Vendr median, range $16,000 to $80,000.
For the labor market side, our workforce intelligence software ranking covers skills and headcount data, and the talent intelligence tools page ranks sourcing platforms. Revelio Labs and LinkedIn Talent Insights both carry salary signals next to workforce data, and the LinkedIn Talent Insights cost report breaks down what that seat runs.
Salary benchmarking FAQ
What is the best compensation benchmarking tool?
Pave, for companies that can connect an HRIS, with 9,000+ companies of real-time salary data and a free tier. Mercer and Aon Radford McLagan remain the enterprise standards for survey data.
What are the best free tools for salary benchmarking?
Pave Market Data Lite for employer data, Ravio's 3 free searches, and BLS OEWS for government wage estimates across about 830 occupations.
Can I use Payscale for free?
Individuals can. Payscale offers free salary reports for 100,000+ job titles. Employers pay for Core, Premier or Elite, at a $15,893 Vendr median.
Who has the most accurate salary data?
Accuracy follows the source. HRIS and payroll feeds record what employers paid, surveys record what they reported, and job postings record what they advertised. Payscale Peer is 100% employer-reported, and Levels.fyi verifies offers against uploaded letters.
What sources do most employers use to benchmark compensation?
Three sources cover the field: an employer survey such as Mercer or Radford, an HRIS-fed platform such as Pave or Payscale Peer, and public data from BLS. Payscale's survey loading exists to blend them.
Is $80,000 a good salary in the USA?
It's above the median. Full-time workers' median weekly earnings were $1,251 in the second quarter of 2026, about $65,052 a year, so $70,000 and $80,000 both sit above the middle of the US pay distribution. Local cost of living moves the answer.
Is 3% a good salary increase for 2026?
It's slightly below plan. Mercer's survey of 1,013 US organizations found most companies holding 2026 budgets flat to 2025, and projects 3.2% merit increases and 3.5% total increases for 2026. The same BLS release put consumer price growth at 3.9% over the year to the second quarter of 2026, against 4.6% growth in median weekly earnings.
How do I benchmark my own salary?
Match your job by responsibilities, then check Payscale's free report, Levels.fyi for tech roles and BLS OEWS for your metro area. Compare your base salary against the 50th percentile, then add bonus and equity for total compensation.
Bottom line
Pave is the best compensation benchmarking tool for tech companies that can connect an HRIS, with 9,000+ companies of real-time data and a free way in. Payscale suits HR teams that need daily data and the surveys they already buy in one place.
Mercer and Aon Radford McLagan stay the enterprise standards for survey data. Ravio and Figures fit European companies on a published budget, Carta fits startups already on its cap table, and Levels.fyi fits recruiters pricing engineering offers.