Augmented reality statistics 2026: market size, AR users, ads, e-commerce and education
 By Jan Suski. I go deep on every review, checking every number against its source and digging up details other coverage misses, a habit from six years of SEO and link building for tech companies. Bylines at Surfer, Brand24, and Senuto. How the scoring works.
The numbers Global AR market, devices and users, checked 7 October 2026
The highest 2026 augmented reality market estimate is 21.7 times the lowest, and scope explains the gap: hardware only against hardware, software and services.
Meta lost $8.68 in Reality Labs for every $1 of Reality Labs revenue in 2025, while shipping the lion's share of the world's smart glasses.
Mobile AR already reaches a significant portion of Snapchat: 350 million daily AR users equal 75% of its 469 million daily users in the same quarter.
Four research companies published a 2026 figure for the global augmented reality market, and they run from $9.7 billion to $210.96 billion. ABI Research counts AR hardware alone. Fortune Business Insights counts the whole augmented reality market across 12 industry segments, and Grand View Research lands between them at $170.0 billion.
Glasses sales are countable. EssilorLuxottica sold more than 7 million AI glasses in 2025, and IDC put Meta at 68.7% of smart eyewear shipments in Q2 2026. Meta's Reality Labs unit, which builds those AR devices, lost $19.19 billion in 2025 on $2.21 billion of revenue.
These augmented reality statistics cover market size, AR hardware, AR users & engagement, advertising, e-commerce, education and the enterprise sector. Every figure links to the filing, tracker or journal that published it and carries its date, so each of these augmented reality stats can be checked at the source. The key statistics come first.
Global augmented reality market size in 2026
Market size is where augmented reality statistics disagree most, and the augmented reality market size you quote depends on the report you open. Five companies publish a full-market figure for augmented reality (AR), with base years from 2023 to 2025 and forecast horizons from 2032 to 2034. ABI Research publishes a sixth figure for hardware only.
| Research house | Report date | Base-year value | 2026 value | Forecast value | CAGR |
|---|---|---|---|---|---|
| Grand View Research | June 2026 | $120.2B (2025) | $170.0B | $1,050.6B (2033) | 29.7%, 2026 to 2033 |
| Fortune Business Insights | September 2026 | $140.34B (2025) | $210.96B | $2,344.90B (2034) | 35.10%, 2026 to 2034 |
| Precedence Research | September 2026 | $149.57B (2025) | $207.16B | $2,804.82B (2034) | 38.5%, 2025 to 2034 |
| Market.us | March 2024 | $29.6B (2024) | no 2026 figure | $591.7B (2033) | 39.5%, 2024 to 2033 |
| Zion Market Research | November 2024 | $43.98B (2023) | no 2026 figure | $879.86B (2032) | 39.5%, 2024 to 2032 |
| ABI Research (hardware only) | February 2026 | $5.9B implied (2025) | $9.7B | about $38B (2030) | 64.8% growth in 2026 |
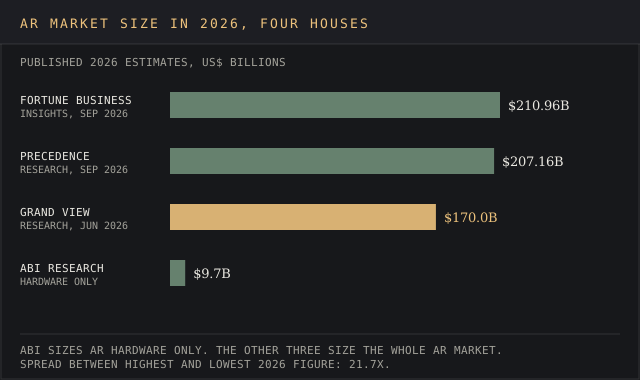
Augmented reality market growth rates agree more closely than sizes. The five full-market reports put the compound annual growth rate between 29.7% and 39.5%, and Market.us & Zion both print exactly 39.5% over different forecast periods. Grand View's global augmented reality market crosses $1 trillion in 2033, the first of the five to name a trillion-dollar year.
On Grand View's numbers, the market is expected to grow 6.2x in seven years, from $170.0 billion in 2026 to $1,050.6 billion in 2033. On Precedence's, the market is expected to reach $2,804.82 billion by 2034. Each long-range figure is one house's model of the future, so it travels with the house's name and date.
IDC sizes the market by spending. Its November 2022 spending guide forecast worldwide AR/VR spending of $50.9 billion in 2026, up from $13.8 billion in 2022, a 32.3% CAGR. VR takes more than 70% of that total, consumer and commercial spending sit close to even, and consumer gaming reaches about 25%.
Why the published augmented reality market estimates diverge
The devil's in the details of each report's scope. The houses size the same global AR market with different definitions, base years and vintages, and the table above mixes all three. Five differences explain most of the spread:
- Hardware only against the whole augmented reality market. ABI's $9.7 billion counts hardware. Fortune's $210.96 billion counts devices, software and applications across 12 industries, from gaming and retail to real estate, architecture and interior design.
- Which component is the majority. Grand View gives hardware 59.0% of 2025 revenue. Precedence gives software 61% of 2024 revenue. Market.us gave hardware more than 61% in 2023. Two houses call hardware the majority, and the third calls it the minority.
- Base year and report vintage. Market.us valued the augmented reality market at $29.6 billion for 2024 in a report dated March 2024. Precedence puts the 2025 augmented reality market at $149.57 billion in a report updated 18 September 2026, a 5x gap one year apart. For the same year, 2023, Market.us put the market at $21.2 billion and Zion at $43.98 billion.
- Regional shares. North America holds 34.0% of 2025 revenue for Grand View, 30.70% ($43.05 billion) for Fortune and 36.14% of 2024 revenue for Precedence. Fortune gives the Asia Pacific region 24.20% of the global market, or $34.03 billion, in 2025.
- AR counted with VR. IDC tracks AR/VR headsets and display-less smart glasses in one unit count, and Meta reports augmented and virtual reality in one Reality Labs segment. Both fold AR into a larger AR/VR technology figure.
The full models sit inside the reports' PDF and Excel files, so businesses reading the headline figure can't audit the gap. The workable fix is the one any market research method starts with: quote the house, the report date, the base year and the scope next to the number. The jury's still out on which model is right, and a dated attribution keeps the reader able to check.
Augmented reality growth statistics: AR hardware and smart glasses
Measured in units, the global AR revolution is a glasses story. IDC counted smart eyewear shipments up 35.3% year over year in Q2 2026, after 130.2% growth in Q1. Audio and camera glasses with no display took 70.3% of the world's units that quarter, up from 61.9% a year earlier.
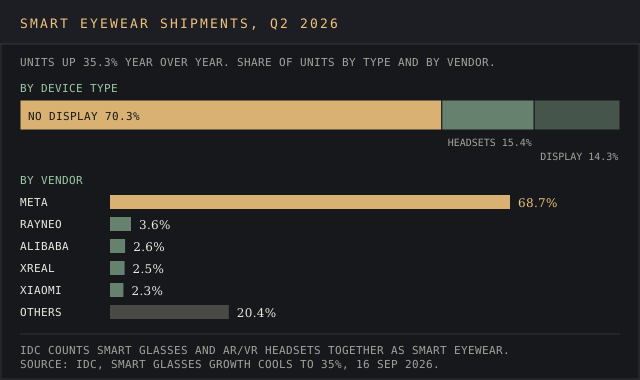
Display glasses held 14.3% of Q2 2026 units and headsets 15.4%. Among companies, Meta shipped 68.7%; RayNeo, Alibaba and Xiaomi jumped on the bandwagon with a combined 8.5%, and XREAL added 2.5%. IDC expected shipments to rise 26.3% for full-year 2026 and 40.5% in 2027. Grand View expects smart glasses to post the fastest CAGR of any AR display type from 2026 to 2033, after head-mounted displays led in 2025.
The 2025 base was explosive growth. In September 2025, IDC expected 14.3 million AR/VR headsets and display-less smart glasses to ship in 2025, up 39.2%, with the smart glasses category up 247.5%. Its forecast puts the future of the category at 43.1 million units in 2029, a 31.8% compound annual growth rate, and it expected spending on AR/VR apps and services to rise 19.7% to nearly $12 billion in 2025.
- EssilorLuxottica: AI glasses sold more than 7 million units in fiscal 2025, "with all the regions and brands contributing" (Q4 2025 release, 12 February 2026).
- Counterpoint Research: global AI glasses shipments up 263% year over year in H1 2026, with display-less models at 96% of the total (21 September 2026).
- ABI Research: the AR hardware market is expected to be worth $9.7 billion in 2026, up 64.8%, and about $38 billion by 2030 (3 February 2026).
- ABI Research, connectivity: cellular AR devices, whose built-in cellular technology gives them a high speed mobile link, grow from about 123,000 units in 2024 to 8.6 million in 2030, a 103.2% CAGR.
Prices separate the two technology tiers and user experiences. Apple's Vision Pro launched to consumers on 2 February 2024 at $3,499 with 256GB of storage, a headset that costs an arm and a leg next to Meta's display glasses. Meta Ray-Ban Display went on sale in the US on 30 September 2025 at $799, Neural Band wristband included, for consumers who want AR features in glasses built for everyday life.
Meta Reality Labs and the cost of AR devices
Meta's filings put a price on building AR technology, straight from the horse's mouth. Reality Labs, the segment that holds Meta's augmented reality (AR) and VR hardware, software and content, lost $17.73 billion in 2024 and $19.19 billion in 2025, per Meta's Q4 2025 earnings release. Revenue was $2.15 billion and $2.21 billion.
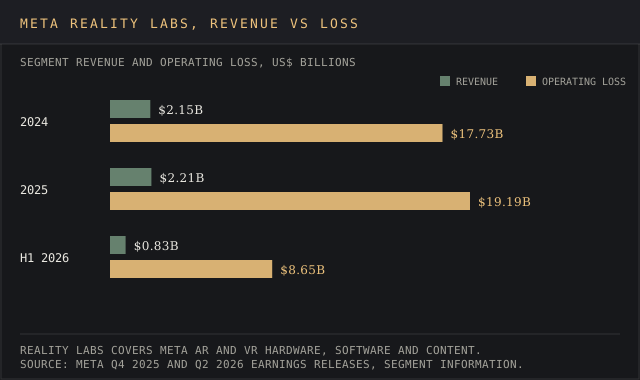
2026 hasn't changed the ratio. The Q2 2026 release shows Reality Labs revenue of $431 million in the quarter and an operating loss of $4.62 billion, the same quarterly loss our social media statistics report cites. First-half 2026 revenue was $833 million, up from $782 million, against an $8.65 billion loss.
Add 2024, 2025 and the first half of 2026 together and Reality Labs lost $45.57 billion in 30 months. Meta's Family of Apps segment, which carries its ad business, had revenue of $60.37 billion in Q2 2026 alone; our Facebook statistics page tracks that side of the company.
Augmented reality engagement statistics and AR users
Global AR user counts come from the companies that run the apps: 350 million daily on Snapchat, 700 million generative AI Lens users and more than 100 million Pokémon GO players in 2024.
Snap counts its daily AR audience in investor letters. The Q2 2025 letter says more than 350 million Snapchatters engaged with AR every day on average, using Lenses more than 8 billion times a day. Snap had 469 million daily active users that quarter, so about three in four consumers on the app around the world used mobile AR daily.
The catalogue of AR experiences keeps growing. Snap's Q4 2025 letter counts more than 450,000 creators who have built over 5 million Lenses with Snap's AR technology, and more than 700 million Snapchatters who engaged with generative artificial intelligence Lenses more than 17 billion times. Snap, the company led by co-founder Evan Spiegel, reported 493 million daily and 971 million monthly users in its Q2 2026 results.
Games built the other mass user base for AR experiences. Pokémon GO drew more than 100 million unique players in 2024, according to the Savvy Games Group announcement of 12 March 2025, when its Scopely unit agreed to buy Niantic's games business for $3.5 billion.
The game has ranked in the top 10 mobile games every year since its meteoric rise in 2016; our video game industry statistics put that in the context of the wider gaming industry. IDC expected AR gaming spending to grow at a 57.8% CAGR through 2026.
In the US, EMARKETER expected in June 2024 that US AR users would pass 100 million in 2025 and reach 116.0 million in 2028. Snapchat Lenses and Pokémon GO are both mobile augmented reality, running on the mobile devices in users' hands.
Augmented reality advertising statistics
AR advertising revenue sits inside broader ad lines in every filing on this page. Snap's advertising revenue was $1.48 billion in Q4 2025, up 5% year over year, and Snap pitches itself to businesses that want to "grow with Gen Z and Millennials". The engagement numbers below come from studies Snap commissioned, so read between the lines on who paid for each one.
- Attention, June 2024: a study by Snap, Omnicom Media Group and Amplified Intelligence of 2,100 respondents and 32,000 ad views across 27 brands found AR Lenses held more than 12 seconds of active attention. Every Lens type lifted short-term brand choice and long-term brand loyalty.
- Attention per mille, September 2025: in Saudi Arabia, AR Lenses drove 8x higher attention per thousand impressions than the social average, and adding AR lifted incremental reach by 19.6%, measured by Snap, OMG MENA and Lumen.
- Try-ons, April 2022: consumers tried on Zenni Optical's AR frames more than 60 million times through Snapchat Lenses, per Snap.
Meta went the other way. It shut down Meta Spark, its platform for third-party AR content, on 14 January 2025, so AR experiences built by businesses and creators stopped working for consumers on Instagram, Facebook and Messenger. Our Instagram statistics cover the platform that lost them, and total ad spend by channel sits in the advertising industry statistics that businesses use to set marketing strategies.
Augmented reality e-commerce statistics
Shopify's merchant data is the source of the 94% figure. Its conversion-rate guide, updated 28 March 2026, says products featuring AR or 3D content "have achieved conversion rates up to 94% higher". Shopify sells the 3D and AR solutions behind those products with AR content to merchant businesses, and "up to" marks the top of a range; our Shopify statistics page covers the company behind the claim.
A Journal of Marketing study by Yong-Chin Tan, Sandeep Chandukala and Srinivas Reddy, summarised by the American Marketing Association in April 2021, found AR use had a positive impact on sales that "appears to be small" overall. The effect was larger for three groups of products and consumers:
- products and brands that are less popular
- products that are more expensive
- consumers new to the online channel or the product category
Virtual try-ons produce the largest count on this page of how consumers interact with retail AR: more than 250 million Snapchatters engaged with AR shopping Lenses over 5 billion times between January 2021 and April 2022, per Snap. Fortune Business Insights expects the retail sector to lead overall AR market performance, with high demand from retail for virtual fitting room applications.
The retail industry statistics report sizes the ecommerce sector and the store sales those consumers buy through.
Augmented reality in education statistics
Of all the augmented reality statistics on this page, the education figures are the ones built on pooled controlled studies. Three meta-analyses put the effect of AR technology on learning in the medium-to-large range:
| Meta-analysis | Journal, year | Studies pooled | Effect size |
|---|---|---|---|
| Garzón, Pavón & Baldiris | Virtual Reality, 2019 | 61 (2012 to 2018) | d = 0.64 on learning effectiveness |
| Chang et al. | Computers & Education, vol. 191, 2022 | 134 (2012 to 2021) | g = 0.739 on performance |
| Wu, Jiang & Chen | Language Learning & Technology, 28(1), 2024 | 35 | g = 0.734 linguistic, 0.692 affective |
An effect size of 0.64 means the average student taught with AR technology scored 0.64 standard deviations above the average student in the comparison group. Chang's team found AR helped all three learning outcomes it measured, with the largest effect on performance. For adoption of AR in the education sector, the language result is the most specific: AR lifted linguistic gains and motivation across 35 studies.
AR in the enterprise sector and healthcare
Enterprise AR solutions ship under the radar. ABI Research expected annual AR smart glasses shipments to businesses in manufacturing, energy, utilities and healthcare to rise from 3.7 million in 2026 to 14.9 million in 2030. Asia-Pacific shipments of AR technology are expected to go from 4.7 million to 22.6 million over the same years, per ABI's regional adoption of AR forecast.
Grand View names industrial and manufacturing the largest AR application in 2025, citing equipment maintenance, remote assistance and assembly line monitoring, and expects healthcare to grow fastest from 2026 to 2033. IDC expected industrial maintenance and training to take about a third of AR spending.
In the healthcare sector, the FDA's list of AR and VR medical devices, current as of 4 September 2026, runs from a 3D echo viewer cleared on 21 January 2015 to the Helion Viewer Suite on 27 May 2026. Surgical navigation technology for spine and knee procedures, such as xvision, NextAR and Knee+, appears most often. Our healthcare market intelligence guide covers how analysts track healthcare companies.
Construction and property businesses use AR solutions on site and in sales. Cupix sells CupixField for augmented reality in the field, profiled in our construction intelligence platforms ranking, and Fortune counts real estate, architecture and interior design as one of its 12 AR industry segments. The real estate statistics report sizes the real estate industry behind those virtual tours.
The research houses, filings and journals behind each AR figure
Market size: grandviewresearch.com (June 2026), fortunebusinessinsights.com (September 2026), precedenceresearch.com (18 September 2026), market.us (March 2024), zionmarketresearch.com (November 2024), abiresearch.com (3 February 2026) and businesswire.com (IDC spending guide, 30 November 2022).
Devices and shipments: idc.com (September 2025 forecast; Q2 2026 smart eyewear tracker), counterpointresearch.com (21 September 2026), essilorluxottica.com (12 February 2026), apple.com and about.fb.com.
Company filings and platform data: Meta's Q4 2025 and Q2 2026 earnings releases, Snap's investor letters (Q2 2025, Q4 2025) and Q2 2026 results on sec.gov, forbusiness.snapchat.com, newsroom.snap.com, spark.meta.com, savvygames.com, shopify.com and emarketer.com.
Research and regulation: ama.org (Journal of Marketing, April 2021), Virtual Reality (2019), Computers & Education (2022), Language Learning & Technology (2024) and fda.gov (AR and VR medical device list, 4 September 2026).
Every figure was checked against its source on 7 October 2026. Each research house sizes the market on its own scope and base year, so the 2026 range on this page compares differently built estimates.
Frequently asked questions
Is AR the next big thing?
Augmented reality (AR), which overlays digital content on the real world, already sits in everyday life through phone cameras, and mobile AR reaches consumers around the world. So far the AR revolution runs through those cameras and through glasses, where the increasing adoption of AR is fastest.
Snap counts 350 million daily AR users, IDC counted smart eyewear shipments up 35.3% in Q2 2026, and EssilorLuxottica sold more than 7 million AI glasses in 2025. Widespread adoption of headsets is further off: they were 15.4% of Q2 2026 smart eyewear units.
How is augmented reality used in marketing?
Retail brands and other businesses use AR mainly for enhancing customer engagement through sponsored camera Lenses, virtual try-ons and 3D product views. The figures are company-published: Snap reports 12 seconds of active attention for AR Lenses and other immersive experiences, and Shopify reports conversion rates up to 94% higher for products with AR or 3D content.
How much has Meta lost on Reality Labs?
Meta's filings show Reality Labs operating losses of $17.73 billion in 2024, $19.19 billion in 2025 and $8.65 billion in the first half of 2026, a total of $45.57 billion. That segment covers augmented and virtual reality together, so the figure includes Quest VR headsets.
How is augmented reality being used in education?
Researchers test lessons built on AR technology against conventional ones and pool the results. Meta-analyses of 61, 134 and 35 studies report effect sizes from 0.64 to 0.739, with the largest gains on performance and language learning.
What are the current trends in augmented reality?
Display-less AI glasses lead consumer applications of AR technology: 70.3% of smart eyewear units in Q2 2026, per IDC, and 96% of AI glasses in H1 2026, per Counterpoint. Generative AI Lenses reached 700 million consumers on Snapchat, and Meta sells display glasses at $799 against Apple Vision Pro's $3,499.
Bottom line
Quote augmented reality statistics with the house, date, base year and scope attached, or quote a range. The four 2026 global augmented reality market estimates span 21.7x, and most of that gap traces to definitions: hardware alone, hardware plus software, AR alone or AR with VR.
For AR adoption, the strongest figures are the filed and tracked ones: Snap's daily AR users, Meta's Reality Labs losses and IDC's shipment counts. Conversion uplifts and commissioned attention studies carry a sponsor's name, and Snap and Shopify, the companies behind them, both sell the AR products those studies measure.
The education research is the most settled data set on this page, and AR glasses are the fastest-moving market in it. Both deserve a second look when the next tracker or meta-analysis lands, because every future figure here is a dated model.