Facebook statistics 2026: 3.6B daily people, 2B+ on Facebook, $59B a quarter
 By Jan Suski. I go deep on every review, checking every number against its source and digging up details other coverage misses, a habit from six years of SEO and link building for tech companies. Bylines at Surfer, Brand24, and Senuto. How the scoring works.
The numbers Facebook and Meta key statistics, checked 4 October 2026
The 3.60 billion is a family-of-apps figure, so no 2026 filing backs a Facebook-only monthly count.
Facebook remains the most popular social media platform in GWI's global survey, yet only 0.15% of a page's followers engage with a typical post.
Meta's ad income grew 27% while daily people grew 3%, so revenue now rises on price and volume per person.
Meta stopped publishing Facebook's own user counts in early 2024, so the latest Facebook statistics come from four places that disagree with each other: Meta's family-wide totals, DataReportal's ad-reach tracking, survey houses like Pew & GWI, and app-panel firms like Similarweb. This report puts each number next to the body that published it, from user counts to Facebook marketing statistics.
The short version: Meta counted 3.60 billion daily active people across its apps in June 2026, and Mark Zuckerberg said Facebook alone has held more than 2 billion daily actives "for a while now." Advertising brought in $59.36 billion in that one quarter.
It's written for marketers sizing a target audience, analysts checking a claim, and anyone who's seen "3 billion Facebook users" quoted without a date. Every figure carries its publisher and its month.
How many Facebook users there are in 2026
The last Facebook-only figures Meta filed date from December 2023: 2.11 billion daily active users (+6%) and 3.07 billion monthly active users (+3%). On the same earnings call, CFO Susan Li said Meta would "no longer report Facebook daily and monthly active users." That's why the 2.989 billion and 3.07 billion counts of Facebook users still circulate in 2026 lists of Facebook statistics.
Since then, Facebook usage gets a sentence on an earnings call at best. On the Q2 2026 call on 29 July, Zuckerberg said: "Facebook has reached more than 2 billion daily actives for a while now." That's the latest Facebook statistics line straight from the horse's mouth, and it's a floor.
Daily active users across the Facebook family of apps
Meta's replacement metric, daily active people, counts each person once across Facebook, Instagram, Messenger and WhatsApp. Its 2025 annual report (10-K) puts daily active people at 3.58 billion in December 2025, up 7% from 3.35 billion a year earlier. By June 2026 daily people across Facebook's apps reached 3.60 billion.
- Average revenue per person across Facebook's apps: $57.03 in 2025, up 15%
- Q4 2025 revenue per person: $16.56, the highest quarter in the series
- Threads: past 500 million monthly actives, per the Q2 2026 call
- Meta Business Agents on WhatsApp and Facebook Messenger: over 1 million businesses a week
Why published Facebook statistics disagree on user numbers
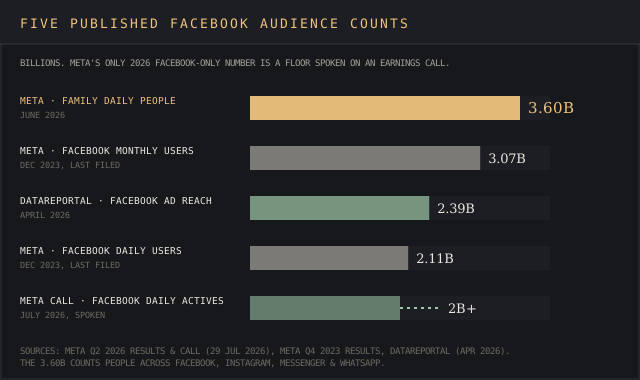
Five bodies publish a Facebook audience figure, and they range from 2.11 billion to 3.60 billion because each counts a different thing. Here's the set side by side.
| Publisher | Figure | What it counts | Date |
|---|---|---|---|
| Meta | 3.60B | Daily people on any of four apps | June 2026 |
| Meta | 3.07B | Facebook monthly active users (last filed) | Dec 2023 |
| DataReportal | 2.39B | Facebook ad reach in Meta's planning tools | Apr 2026 |
| Meta | 2.11B | Facebook-only daily active users (last filed) | Dec 2023 |
| Meta | 2B+ | Facebook daily actives, spoken on a call | July 2026 |
| GWI | 56.3% | Share of internet users 16+ who used it last month | Q4 2025 |
| Pew | 71% | Share of US adults who say they use it | 2025 |
The gaps come from five mechanics:
- People against accounts. Meta's monthly active users counted accounts; daily active people tries to merge one person's accounts across apps. Meta's 10-K puts the error margin at about 3% of worldwide DAP, roughly 107 million people at 3.58 billion (our calculation).
- Ad reach is a planning number. DataReportal reads 2.39 billion from Meta's ad tools, which exclude under-13s and anyone Facebook ads can't target. It sits 680 million under the last monthly count.
- Surveys count claimed use. GWI's 56.3% includes China and Russia, where Western platforms are blocked or restricted. Strip those two out and Facebook users make up 73.4% of respondents.
- Panels count app opens. Similarweb's app index ranks Facebook fourth at 77.1, behind YouTube (100), WhatsApp (86.5) and Instagram (79.9).
- Dates drift. The 3.07 billion is from December 2023; the 2.39 billion is from April 2026.
The devil's in the details: a 2026 page of Facebook statistics quoting "3 billion monthly Facebook users" is citing a December 2023 filing, whatever date sits on the page.
Facebook demographics statistics
Facebook demographics statistics depend on who's counting. Meta's ad tools, as tracked by DataReportal for January 2025, showed a global ad audience that's 56.7% male and 43.3% female, with users aged 25 to 34 the largest age group at 31.2%.
| Age group | Share of ad audience, Jan 2025 | Female | Male |
|---|---|---|---|
| 18-24 | 21.8% | 9.1% | 12.7% |
| 25-34 | 31.2% | 12.7% | 18.5% |
| 35-44 | 20.4% | 8.7% | 11.7% |
| 45-54 | 12.3% | 5.7% | 6.6% |
| 55-64 | 7.9% | 3.9% | 4.0% |
| 65+ | 6.4% | 3.4% | 3.0% |
The US skews the other way. DataReportal's Digital 2026 US report found 53.0% of Facebook's adult ad audience there was female at the end of 2025, and Facebook users made up 71.4% of American adults in Meta's tools. None of these splits is set in stone: US ad reach fell by 500,000 between July and October 2025 alone.
Pew's survey lands within a hair's breadth of that. Its 2025 social media fact sheet puts Facebook users at 71% of US adults, and the age group splits run:
- 18 to 29: 68%
- 30 to 49: 80%
- 50 to 64: 74%
- 65 and older: 57%
- Women 78%, men 63%
Teens are the thin end. Pew's December 2025 teen survey found 31% of US teens use Facebook, rising to 46% in households earning under $30,000 a year. Teens are the next pool of new users, and fewer than a third of them are on it today.
Web traffic tells a third story. Similarweb's August 2026 estimate for facebook.com shows visitors 55.15% male, with 25-34 the largest age group at 24.42%.
Facebook users by country
India holds the lion's share. Meta's ad tools reached 403 million Facebook users there in October 2025, about twice the US total, per DataReportal's India report.
| Country | Facebook ad reach, Oct 2025 | Change in 12 months |
|---|---|---|
| India | 403M | +8.1% |
| United States | 198M | +2.5% |
| Indonesia | 121M | +3.0% |
| Brazil | 109M | -1.3% |
| Philippines | 95.8M | +10.3% |
| Mexico | 93.5M | +3.2% |
| Vietnam | 79.0M | +7.2% |
| United Kingdom | 38.8M | +2.6% |
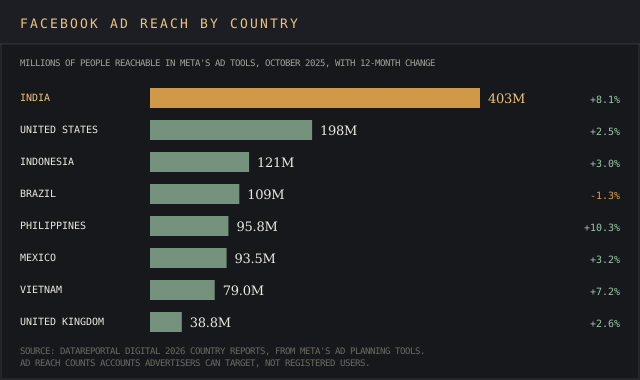
Growth comes from emerging markets: the Philippines added 10.3%, India 8.1% and Vietnam 7.2%, against 2.5% in the US. Figures for each country come from DataReportal's Indonesia, Brazil, Philippines, Mexico, Vietnam and UK reports.
Facebook usage statistics: daily visits, time and devices
About half of US adults visit Facebook daily, and 37% go on it several times a day, per Pew's 2025 survey. Daily use peaks in the middle: 58% of 30- to 49-year-olds and 54% of 50- to 64-year-olds.
Time is harder to pin down. Similarweb's Android panel, cited in DataReportal's Digital 2026 Global Overview, has Facebook users spend 67 minutes a day in the app, behind TikTok (1 hour 37 minutes) and Instagram (1 hour 13 minutes).
On the web, facebook.com logged 11.5 billion visits in August 2026, and the average user stayed 10 minutes 22 seconds across 12.51 pages, per Similarweb. Global rank: third.
Mobile devices carry nearly all of it. Meta's 10-K says "substantially all" daily active people reach its apps on mobile devices, and "the substantial majority" of revenue comes from advertising on mobile devices. Anything a brand posts has to be mobile optimized for mobile phones first.
Why people log in shapes what works:
- Over 7 in 10 Facebook users visit to stay in touch with friends and family (GWI, April 2026), so most Facebook users come for people first
- 53% of Facebook users use it to follow or research brands, behind Instagram's 62.8% (GWI via DataReportal)
- 13% of social media users name Facebook their favourite platform, behind WhatsApp (17.4%) and Instagram (16.4%)
- 38% of US adults regularly get news on Facebook, the top site for news consumption (Pew, September 2025)
Facebook continues to trail YouTube in Pew's US ranking, 71% against 84%, and the typical social media user spreads time across multiple platforms: 6.5 a month, per GWI.
Facebook video, Stories, live videos and Facebook Groups
Facebook video time rose 9% globally year over year in Q2 2026 and over 10% in the US & Canada, Susan Li said on the call, with ranking improvements driving the US & Canada gain. That's the clearest sign of where Facebook usage is heading, and where video ads find their viewers.
The format data has a gap. Facebook Stories last got a daily count in April 2019, when TechCrunch reported 500 million daily users across Facebook and Messenger. Meta hasn't published a Facebook Stories number since, so read between the lines of any 2026 Stories figure.
Facebook live videos have the oldest claim of all. Meta said in April 2016 that people "comment more than 10 times more on Facebook Live videos than on regular videos."
Short vertical videos lead organic engagement. Socialinsider's Q2 2026 data has Reels as Facebook's top format, against video posts and link posts further down. Buffer's 2026 study found images, video posts and text "within one percentage point" on Facebook, so format matters less here than on other social media platforms.
Groups are getting split out. The social media giant launched Forum, a standalone app for Facebook Groups, and Seller, a standalone Marketplace app built for online shoppers, both announced on the Q2 2026 call.
Facebook advertising statistics
Meta's advertising revenue was $196.18 billion in 2025, up 22% from $160.63 billion, and $131.95 billion in 2023, per the 10-K. Meta reports no Facebook-generated revenue line, so every Facebook advertising total is a Meta total. The Q2 2026 figures came hot off the press on 29 July:
- Q2 2026 ad revenue: $59.36 billion, against $46.56 billion a year earlier
- First-half 2026 ad revenue: $114.39 billion
- Ad impressions: +14% in Q2 2026
- Average price per ad: +12%
- Q3 2026 revenue guidance: $61 billion to $64 billion
Forecasters see Meta passing Google. EMARKETER puts Meta's 2026 net ad revenue at $243.46 billion, or 26.8% of global ad spend, per Marketing Dive. The full forecast set sits in our advertising industry statistics report.
Inside the US, Instagram now out-earns Facebook. EMARKETER forecast that Instagram would take 50.3% of Meta's US ad revenue in 2025, and put ad revenue per US user at $191 on Facebook against $223 on Instagram. Our Instagram statistics carry the rest of that split.
Automation is where businesses investing in Facebook ads are putting money. Advantage+, Meta's AI suite for Facebook ads and Instagram campaigns, passed a $75 billion annual revenue run rate in Q2 2026, and Meta said ranking upgrades combined with its GEM ads model generated an 8.3% increase in ad clicks and a 15.7% uplift in conversions on Facebook.
How often the average Facebook user clicks on ads
Meta doesn't publish clicks per user, so the usable proxy is click-through rate. WordStream's 2026 benchmarks give these all-industry averages for Facebook ads:
| Campaign type | CTR | CPC | Conversion rate | Cost per lead |
|---|---|---|---|---|
| Traffic | 1.93% (from 1.71%) | $0.60 (from $0.70) | n/a | n/a |
| Leads | 2.70% | $1.80 | 8.54% | $27.39 |
Traffic campaigns pay for clicks to landing pages; leads campaigns pay for form fills. On a $1,000 marketing budget, WordStream's averages buy about 1,667 traffic clicks or 36 leads (our calculation). Boosted posts bill as Facebook ads too, so the same rates apply. Run your own figures through our CPM calculator.
The old $0.39 CPC from September 2020 is stale: WordStream's 2026 traffic average is $0.60. WordStream's 2026 tables don't split out video ads, so test Facebook video ads against your own image ads and compare cost per result for the video ads.
The "20% rule" is gone too. Facebook dropped its limit on text covering more than 20% of an ad image in September 2020, Social Media Today reported. That changed how mobile ads get built: text-heavy images no longer face a 20% check.
Facebook marketing statistics: engagement and organic reach
Marketers haven't left. HubSpot's 2026 State of Marketing data, a source for marketing statistics across channels, shows Facebook is a marketing platform for 69.6% of marketers, who include Facebook marketing in their marketing strategies, and 43% rank it among their highest-ROI platforms. Those two lines lead most Facebook marketing statistics roundups.
Average engagement rate on Facebook
Socialinsider analysed 25 million posts from 130,683 pages and puts the average engagement rate per Facebook post at 0.15%, flat year over year. Brands cut posting by 22% to 39 posts a month, and follower growth rates rose from 12.20% to 23.20% in 2025.
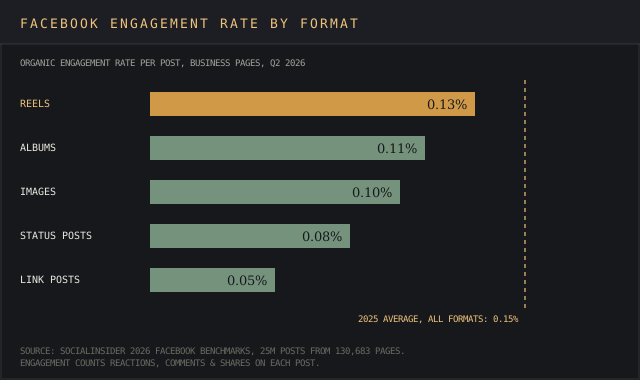
Q2 2026 pushed every format down except one: Reels 0.13%, albums 0.11%, images 0.10%, status posts 0.08% and link posts flat at 0.05%. Link posts were already last.
Buffer measures differently and lands higher. Its 52-million-post study puts Facebook's median engagement rate at about 5.6% in 2025, up from 5.0%, and posts with replied-to comments saw an estimated 9% engagement lift. The average Facebook page engagement rate of 0.15% and Buffer's 5.6% use different denominators, so keep comparisons within one source.
Average organic reach by page size
Socialinsider's views per post are the working measure of organic reach for a page. Socialinsider's averages by page size, read straight off its tables:
- 1,000-5,000 followers: 60 views per image post, 7 likes per status post
- 5,000-10,000: 125 views, 14 likes
- 10,000-50,000: 270 views, 36 likes
- 100,000-1 million: 1,125 views, 78 likes
A business page with 5,000 to 10,000 followers reaches 125 views per image post, which puts average organic reach at 1.3% to 2.5% of followers (our calculation), a drop in the bucket next to 2.39 billion reachable accounts. That's par for the course; boosting is how most brands reach users beyond it.
Customer engagement is moving into messages. Over 1 million businesses use Meta's Business Agents each week on WhatsApp and Facebook Messenger. For influencer campaigns layered on top, our influencer marketing platform pricing report covers eight vendors.
What these Facebook stats mean for a content strategy
Three numbers do most of the work for a Facebook marketing strategy: a massive user base of 2.39 billion reachable accounts, a 0.15% organic engagement rate, and a $27.39 average cost per lead. Organic posts reach a sliver of followers; paid reach is priced and measurable.
- Size the target audience from ad reach, using country figures above. Build segments with our user persona template.
- Put video content first. Users spend 9% more time on Facebook video than a year earlier, Reels lead organic engagement, and Facebook video ads belong in every test.
- Track the rising competition. The ad intelligence software ranking covers tools that log rival Facebook ads and their advertising strategies, and social listening tools track brand mentions across other social media platforms.
- Benchmark traffic with panel data like Similarweb, and schedule posts across channels with tools like Sprout Social.
Platform-wide context for the social media landscape, from TikTok to LinkedIn, sits in our social media statistics report, and video benchmarks in YouTube statistics. Keep an eye on Meta's Q3 2026 release, guided at $61 billion to $64 billion of revenue, for the next round of Facebook marketing statistics.
Frequently asked questions
Who owns the biggest percentage of Facebook?
Meta Platforms owns Facebook. Control sits with holders of Meta's Class B stock, led by founder and CEO Mark Zuckerberg: the 10-K says they hold a majority of the combined voting power as long as Class B shares stay at or above 9.1% of all outstanding shares.
What is the Facebook 20 rule?
It was a Facebook ads rule limiting text to 20% of an ad image. Facebook dropped it in September 2020, so it's no longer enforced at ad review.
How much is a Facebook page with 10,000 followers worth?
Meta's Terms of Service bar users from transferring an account to anyone else without Meta's permission, so there's no sanctioned resale price. In delivery terms, a page with 10,000 to 50,000 followers averages 270 views per image post and 36 likes per status post, per Socialinsider.
What percentage of Facebook users are active?
Meta's last split, December 2023, had 2.11 billion daily users out of 3.07 billion monthly, so 69% of monthly Facebook users logged in on a given day (our calculation). In the US, Pew's survey shows about half of adults use it daily against 71% who use it at all, roughly 7 in 10 users.
Bottom line
Facebook is still the largest single social network by survey, with 56.3% of internet users aged 16 and over, and Meta says it holds more than 2 billion daily actives. Precise counts of Facebook users stopped in December 2023 at 2.11 billion daily and 3.07 billion monthly.
For marketers, the Facebook marketing statistics that matter are the reachable 2.39 billion, the country splits, the 0.15% organic engagement rate and WordStream's cost benchmarks. For anyone citing Facebook statistics, or marketing statistics built on them, check the date: most users quoting 3 billion are reading a 2023 filing.
Where each Facebook figure was published, and the counts Meta stopped filing
Meta's own figures: the Q2 2026 results release and the Q2 2026 earnings call transcript of 29 July 2026, the Q4 2023 results release and its earnings call transcript (investor.atmeta.com and s21.q4cdn.com, February 2024), the 2025 annual report on Form 10-K (sec.gov), the April 2016 live video announcement (about.fb.com) and the Terms of Service (facebook.com).
Audience trackers: DataReportal's social media users page, Facebook stats page (January 2025 data), Digital 2026 Global Overview, Digital 2026 mid-year global update, GWI motivations analysis and Digital 2026 country reports for the United States, India, Indonesia, Brazil, the Philippines, Mexico, Vietnam and the UK (datareportal.com, which republishes GWI survey data, Similarweb's Android panel and Meta's ad-tool reach).
Web traffic: Similarweb's facebook.com profile (similarweb.com, August 2026 data).
Surveys: Pew Research Center's social media fact sheet (2025), Americans' social media use (20 November 2025), teen survey (9 December 2025) and social media and news fact sheet (September 2025), all on pewresearch.org, and HubSpot's marketing statistics (hubspot.com, 2026).
Advertising: WordStream's 2026 Facebook ads benchmarks (wordstream.com), EMARKETER forecasts via Marketing Dive (marketingdive.com) and EMARKETER's own release (emarketer.com), Social Media Today on the September 2020 text rule (socialmediatoday.com).
Engagement and formats: Socialinsider's Facebook benchmarks (socialinsider.io, 25 million posts, Q2 2026 format data), Buffer's 2026 engagement study (buffer.com, 52 million posts) and TechCrunch on Stories (techcrunch.com, 24 April 2019).
Every figure was checked against its source on 4 October 2026. Three numbers appear in no source above: a Facebook-only user count filed after December 2023, a revenue line for Facebook alone, and ad clicks per Facebook user. Meta files users and advertising for its whole family of apps.