YouTube statistics 2026: $60B in revenue, 200B daily Shorts views and 13.8% of US TV time
 By Jan Suski. I go deep on every review, checking every number against its source and digging up details other coverage misses, a habit from six years of SEO and link building for tech companies. Bylines at Surfer, Brand24, and Senuto. How the scoring works.
The numbers YouTube revenue, audience and channels, checked 1 October 2026
YouTube generated $40.37 billion in ad revenue in 2025, up 11.7%, and subscriptions added roughly $19.6 billion on top (our calculation from Alphabet's figures).
The television set is YouTube's main US screen now: Nielsen ranks it first among media distributors, and Google says TV passed mobile by watch time.
India leads on audience size with 500 million users, nearly double the US count of 254 million.
YouTube's revenue passed $60 billion across ads and subscriptions in 2025, according to Alphabet's Q4 2025 earnings release. Ads brought in $40.37 billion of it (our sum of Alphabet's four quarterly figures), and Q2 2026 added another $11.06 billion, up 13% on the same quarter a year earlier.
The audience moved just as fast. Shorts now averages 200 billion daily views, and YouTube held 13.8% of all US television viewing in June 2026, first among media distributors in Nielsen's count.
Lists of YouTube stats are a dime a dozen, and several pages ranking for this keyword still quote a 2017 watch-time figure as current.
These YouTube statistics come from Alphabet filings, YouTube's own blog, Nielsen, Pew Research Center, DataReportal, eMarketer and Social Blade, each linked and dated where it's used, covering revenue, users, YouTube videos, the top YouTube channels and creators. They're written for marketers, analysts and YouTube creators sizing up the platform.
YouTube revenue statistics: $60 billion in 2025, $40.37 billion of it ad revenue
Alphabet reports YouTube ad revenue every quarter. The four 2025 figures sum to $40.37 billion against $36.15 billion the previous year, an 11.7% gain (our calculation from the Q1, Q2, Q3 and Q4 releases). Q4 2025 set the quarterly record at $11.38 billion. In the same year, YouTube's full-year revenue across ads and subscriptions passed $60 billion.
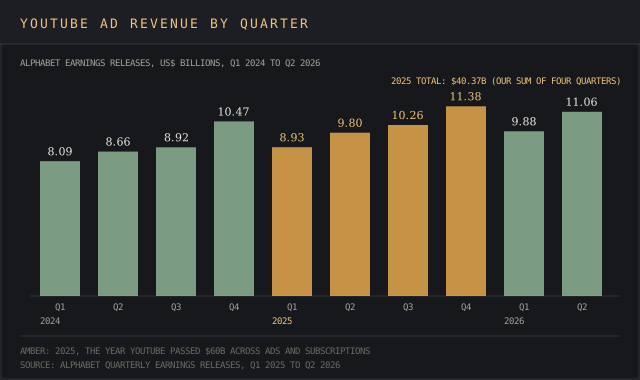
Ads still bring in the lion's share. Sundar Pichai told analysts on the Q4 2025 earnings call that "YouTube's annual revenues surpassed $60 billion across Ads and Subscriptions." Read between the lines and about $19.6 billion is left for YouTube Premium, YouTube Music, YouTube TV and NFL Sunday Ticket together; that split is our arithmetic, and Alphabet gives no per-product figure.
2026 is running ahead of 2025. Q1 brought $9.88 billion, up 10.7%, and Q2 $11.06 billion, up 13% (Q1 2026, Q2 2026). eMarketer's January 2026 forecast puts worldwide YouTube advertising revenue over $45 billion for the year. Our advertising industry statistics report covers the wider advertising market that money comes out of.
YouTube Premium and YouTube Music subscribers
YouTube Red became YouTube Premium on 17 May 2018, at $11.99 a month in the US, with YouTube Music Premium at $9.99 (YouTube). YouTube Premium subscribers are reported together with YouTube Music: 100 million in February 2024 and 125 million in March 2025, trials included both times.
Alphabet's own count covers every Google consumer service: over 325 million paid subscriptions at the end of 2025 and 350 million in Q1 2026, with "YouTube and Google One being the key drivers," per the Q1 2026 release.
How many people use YouTube: 2.77 billion viewers in eMarketer's forecast
eMarketer's forecast puts YouTube at 2.77 billion viewers worldwide in 2026, 1.18 billion of them in Asia-Pacific. Alphabet's releases don't report monthly active users for YouTube, and the last logged-in count from Alphabet itself came on the January 2024 earnings call, where Philipp Schindler said Shorts had "2 billion-plus logged-in users every month."
Country counts come from DataReportal, which reads Google's ad tools and finds YouTube audiences in the hundreds of millions in four countries. India leads with 500 million YouTube users in late 2025, up 9 million in a year. The US follows at 254 million (DataReportal US), then Indonesia at 151 million (DataReportal Indonesia) and Brazil at 150 million (DataReportal Brazil).
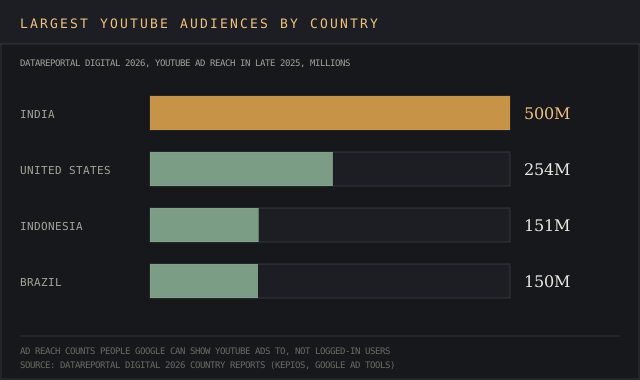
Gender splits depend on the market. DataReportal's January 2025 global data put the ad audience at 54.0% male and 46.0% female, with men aged 25 to 34 as the largest group. In the US it flips to 50.9% female and 49.1% male. Teams that need to zero in on a target audience can start from those splits and our guide to demographic market segmentation.
Why the published YouTube stats on users disagree
Different YouTube stats on users and active users are par for the course, because each publisher answers a different question. A modeled forecast, an ad-tool reading and a mail, web and phone survey don't land on one number.
| Publisher | Figure | What it counts | Date |
|---|---|---|---|
| eMarketer | 2.77 billion | Worldwide viewers, modeled forecast | Jan 2026 |
| Alphabet | 2 billion+ | Logged-in monthly active users of Shorts | Jan 2024 |
| DataReportal | 2.53 billion | Global ad reach, 45.5% of internet users | Jan 2025 |
| DataReportal | 254 million (US) | People reachable with YouTube ads, any age | Late 2025 |
| Pew Research Center | 84% of US adults | Adults who say they ever use YouTube | Feb to Jun 2025 |
DataReportal's global ad reach of 2.53 billion was 30.9% of the world's population in January 2025. Its US figure equals 73.0% of the whole population, children included, while Pew's 84% covers adults only. The devil's in the details: DataReportal warns that its ad numbers "may not be representative of the platform's total active user base," so its figures size an ad audience, and Pew's size a habit.
YouTube usage statistics in the US: 84% of adults, 48% daily
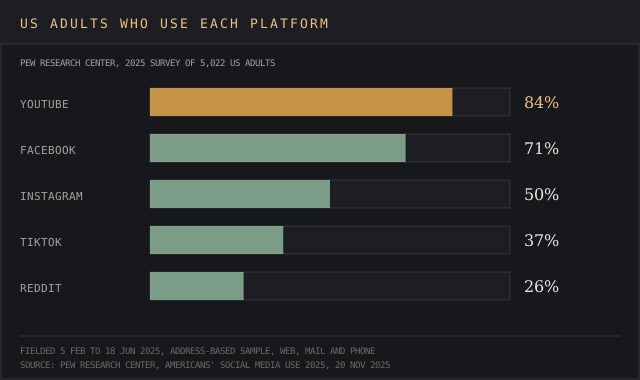
Pew's 2025 survey of 5,022 adults found 84% use YouTube, against 71% for Facebook, 50% for Instagram and 37% for TikTok, so Facebook, Instagram and other social media platforms trail it. That 13-point lead over Facebook makes YouTube the most used of the social media platforms Pew tracks.
Reddit, another of the social media apps in the survey, reached 26%. DataReportal's Digital 2026 report, using Similarweb data on apps, ranks the YouTube app first among social media and messaging apps by active users, ahead of WhatsApp.
Age sets the spread. 95% of adults aged 18 to 29 use YouTube, falling to 58% of those 65 and older, according to Pew's full report. Among YouTube users by gender, men lead women 87% to 81%.
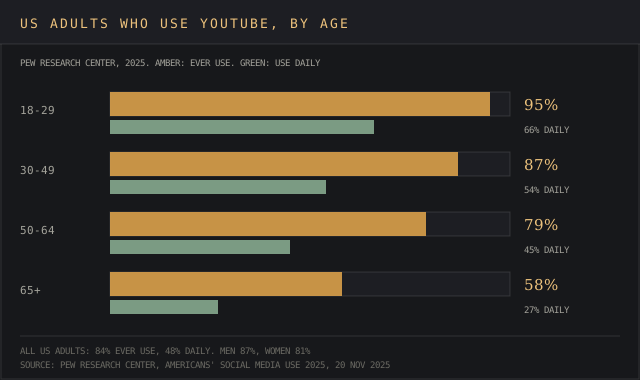
Daily use is lower. 48% of US adults go on YouTube daily and 33% several times a day; adults under 30 lead at 66%. Education barely moves it: 48% of adults with a high school diploma or less, 50% with some college and 47% of college graduates use YouTube daily, per the same Pew report. That daily figure is the closest published measure of YouTube's daily active users in the US.
Traffic data tells the same story worldwide. Similarweb ranks youtube.com the second most visited website in the world in August 2026, behind google.com. YouTube users spend 19 minutes 10 seconds per visit on the site, across 11.97 pages. Our Similarweb review explains how those traffic estimates are modeled, and the website traffic analysis tools ranking compares the alternatives.
YouTube watch time on TV: 13.8% of US viewing and the top streamer
Nielsen's June 2026 Gauge, hot off the press in August, credits YouTube with 13.8% of US TV viewing, first among media distributors, in a month when streaming took 48.5% of television time. YouTube says it has been "#1 in streaming watchtime in the U.S. for nearly three years, according to Nielsen," in Neal Mohan's 2026 letter.
TV became the platform's main US screen along the way. In February 2025 YouTube said TV had become "the primary device for YouTube viewing in the U.S. (by watch time)," ahead of mobile devices, with viewers watching "over 1 billion hours of YouTube content on TVs daily" (Think with Google).
The older "1 billion hours a day" figure across all screens dates from February 2017, when YouTube's Cristos Goodrow announced it. It's still the figure most YouTube stats pages repeat for daily watch time.
eMarketer expects over 180 million people in the US to watch YouTube on connected TVs in 2026 (eMarketer). DataReportal's Digital 2026 report finds YouTube's CTV ads reach 84.6% of its US audience.
YouTube Shorts stats: 70 billion to 200 billion daily views
YouTube Shorts averaged 70 billion daily views when Schindler reported it in January 2024. Neal Mohan put the figure at over 200 billion at Cannes Lions in June 2025, and YouTube's press page still gives 200 billion. Daily views of Shorts videos on the platform nearly tripled in that span.
Money follows more slowly. Creators who monetize Shorts videos keep 45% of their allocated revenue, per YouTube Help, and Schindler said on the Q4 2025 call that "Shorts earns more revenue per watch hour than traditional in-stream on YouTube, including the U.S."
The 2027 rules make it harder for a new Shorts channel to hit the ground running. From 1 February 2027, new applicants will need 20 million qualified Shorts views in 90 days, double today's 10 million (YouTube).
YouTube videos uploaded: 20 million a day
YouTube's press page says "there are over 20 million videos uploaded daily to YouTube." The other common figure, about 500 hours of video uploaded to YouTube every minute, appears in the US Supreme Court's May 2023 opinion in Twitter v. Taamneh; it's the most quoted upload stat and also the oldest one. YouTube runs local versions in over 100 countries around the world, across 80 languages, per the same press page.
First YouTube video and most viewed YouTube video
The first YouTube video, "Me at the zoo," went up on 23 April 2005 on the channel jawed. It runs 19 seconds and had 438.7 million views and 10.6 million comments on 1 October 2026 (YouTube data pulled through DataForSEO): views in the hundreds of millions for a 19-second clip.
The most viewed YouTube video in the world is Pinkfong's "Baby Shark Dance," at 17.40 billion views on the same date. The Baby Shark Dance video runs 2 minutes 16 seconds and was published on 17 June 2016. DataReportal's Digital 2026 report notes that half of YouTube's ten most-watched videos are nursery rhymes.
Top YouTube channels and YouTube channel stats by million subscribers
MrBeast is the most subscribed YouTube channel in the world with 519 million subscribers, 204 million ahead of T-Series at 315 million, per Social Blade on 1 October 2026. Nineteen channels have passed 100 million subscribers, and the ten top YouTube channels by subscribers on that date were these.
| Rank | YouTube channel | Subscribers |
|---|---|---|
| 1 | MrBeast | 519 million |
| 2 | T-Series | 315 million |
| 3 | Cocomelon - Nursery Rhymes | 203 million |
| 4 | YouTube Movies | 199 million |
| 5 | SET India | 190 million |
| 6 | Vlad and Niki | 151 million |
| 7 | Stokes Twins | 147 million |
| 8 | Kids Diana Show | 138 million |
| 9 | KIMPRO | 135 million |
| 10 | Like Nastya | 133 million |
Four of the top YouTube channels make videos for children (Cocomelon, Vlad and Niki, Kids Diana Show, Like Nastya), and two are Indian media companies, T-Series and SET India. That mix lines up with the country audience counts above. Pinkfong's own YouTube channel, home of Baby Shark, sits at 85.2 million. Subscriber counts in the millions run deep down the list: rank 50, El Reino Infantil, has 71.5 million.
The top YouTube channels by subscribers are ranked on a public count, and YouTube publishes no ranking of top channels by revenue or watch time. For YouTube channel stats on rivals, Social Blade's top channels lists are the usual reference, and brand teams that track comments and mentions around those channels use the tools in our social listening ranking.
YouTube creators: over $100 billion paid in four years
YouTube says it has "paid over $100 billion to creators, artists, and media companies" in the past four years, in the January 2026 letter. The YouTube Partner Program counts "over 3 million creators," per the August 2026 announcement. Those YouTube creators, and the YouTubers trying to join them, are the ones the 2027 changes apply to.
Entry gets harder in 2027. Today a channel that wants ads on its videos needs 1,000 subscribers plus 4,000 qualified watch hours in 12 months, or 10 million Shorts views in 90 days (YouTube Help). From 1 February 2027 new applicants need 8,000 hours or 20 million Shorts views, and existing partners must keep 10 million qualified Shorts views per rolling 90 days to earn from Shorts ads.
Other creator figures from the 2026 letter:
- Over 1 million channels used YouTube's AI creation tools daily in December 2025.
- Over 500,000 creators sell through YouTube Shopping.
- YouTube's creator economy added $55 billion to US GDP in 2024 and supported over 490,000 full-time jobs.
- Over 6 million daily viewers watched at least 10 minutes of autodubbed videos in December 2025.
Our AI statistics report tracks how fast those creation tools spread outside YouTube. Gaming channels sit inside two markets we cover separately, in the video game industry statistics and esports industry statistics reports.
Engagement rate and audience retention: long-form view time fell 37%
Metricool's 2026 YouTube study of 799,718 videos from 71,177 accounts found average view duration on long-form YouTube videos fell from 3.98 minutes to 2.51 minutes in a year, down 36.96%. The engagement rate fell from 2.38% to 1.30%, while views rose 75.79%. Those YouTube stats track the trends from 2025 to 2026 across millions of views.
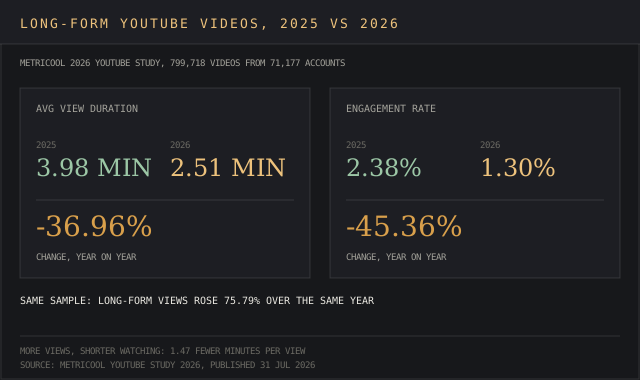
Audience retention is the metric behind those averages. YouTube's key moments for audience retention report "explains how well different moments of your video held viewers' attention," and it sits beside average view duration and watch time in YouTube Studio. Rising views on shorter-watched videos means each extra viewer leaves sooner; the retention curve shows the second they go.
A falling average view duration on a channel with rising views is a red flag worth checking in that report.
YouTube statistics for marketers and the YouTube strategy they point to
Wyzowl's 2026 video survey, which has tracked video marketing trends for 12 years, found 82% of video marketers upload videos to YouTube, and 69% call it effective, the top score of any platform in the survey. The sample is 266 respondents, which is small, so take it as a direction.
Podcasts brought a new audience. YouTube passed "more than 1 billion monthly active viewers of podcast content" in February 2025, and viewers watched over 700 million hours of podcasts on living room devices in October 2025, up 75% on a year earlier, per Pichai on the Q4 2025 call. Our podcast industry statistics report shows YouTube ahead in the listener trackers too.
Three checks for marketers and creators building a YouTube strategy on these numbers:
- Plan YouTube videos for the TV screen: it passed mobile as the main US viewing device by watch time in 2025.
- Use Shorts videos for reach: 200 billion daily views, with a 45% creators' share of allocated revenue.
- Track audience retention next to views: Metricool's sample saw views rise 75.79% while view time fell 36.96%.
Keep an eye on the paid side too. Teams that want to see which brands run YouTube ads can use the tools in our ad intelligence software ranking, and teams tracking what viewers write in comments can price that work with our social listening pricing and Sprout Social pricing reports. YouTube's ad growth sits beside Google's search business, covered in our search engine marketing statistics.
Frequently asked questions
How can I see my YouTube statistics?
YouTube Studio, on the web and in its mobile apps, shows your YouTube stats in the Analytics tab: views, watch time, subscribers, audience retention and revenue for your own channel and each of its videos.
For another YouTube channel, Social Blade publishes public YouTube channel stats, ranks the top YouTube channels by subscribers and shows view counts, which is where the channel figures on this page come from. PR teams that also track press coverage of a channel use media monitoring tools.
Is YouTube growing or declining?
The trends split by metric. YouTube is growing on money and TV share. Ad sales rose 11.7% in 2025 and 13% in Q2 2026, YouTube led US TV viewing in June 2026, and the largest national YouTube audience added 9 million people in a year. The decline shows up per video: long-form view duration fell 36.96% in Metricool's sample.
How many views on YouTube do you need to make $2,000 a month?
There's no fixed per-view rate, so no view count guarantees $2,000. Partners earn a share of the ads served on their videos, 45% of allocated revenue on Shorts, and YouTube Studio shows each channel its own revenue per 1,000 views. For a channel hoping to bring home the bacon, divide $2,000 by that figure and multiply by 1,000 to get the monthly views it needs, once the channel clears 1,000 subscribers and 4,000 watch hours.
What are good YouTube statistics?
Good YouTube stats depend on format. Benchmarks from Metricool's 2026 study: 2.51 minutes average view duration and a 1.30% engagement rate for long-form videos. A channel above both is beating the average in a sample of 799,718 videos.
Bottom line
YouTube is a $60 billion business that grew ad sales by double digits in 2025 and the first half of 2026. Its biggest US screen is the TV, its biggest audience is in India, and its top YouTube channels count subscribers in the hundreds of millions, led by MrBeast and T-Series.
The YouTube stats to treat with care are user counts and old upload stats. eMarketer, DataReportal, Pew and Alphabet each count a different thing, and the 2017 watch-time number and the 500-hours upload number are years old. Use the dated source next to each figure on this page, and check the 1 February 2027 Partner Program changes before planning new YouTube videos or a new channel.
Where each YouTube figure comes from, and three numbers nobody publishes
Revenue figures come from Alphabet's quarterly earnings releases for Q1 2025 through Q2 2026 and its Q4 2025 earnings call of 4 February 2026. The worldwide viewer and ad revenue forecasts are eMarketer's, from January 2026.
Audience figures are DataReportal's Digital 2026 reports (global, India, the US, Indonesia and Brazil) and its January 2025 YouTube data, Pew Research Center's report of 20 November 2025 (5,022 US adults, surveyed February to June 2025), Nielsen's June 2026 Gauge and Similarweb's August 2026 website ranking.
Shorts, Premium and creator figures come from YouTube's blog, press page and Help pages, Neal Mohan's January 2026 letter and Think with Google (February 2025). Channel and video counts are Social Blade's and YouTube's own, both read on 1 October 2026, and the engagement benchmarks are Metricool's 2026 study and Wyzowl's 2026 survey.
Three figures appear nowhere: Alphabet's own current count of YouTube monthly active users, a revenue split across Premium, Music, YouTube TV and NFL Sunday Ticket, and a ranking of channels by revenue or watch time.