B2B marketing statistics 2026: budgets, buyers, AI and LinkedIn
 By Jan Suski. I go deep on every review, checking every number against its source and digging up details other coverage misses, a habit from six years of SEO and link building for tech companies. Bylines at Surfer, Brand24, and Senuto. How the scoring works.
B2B marketing budgets sit at 7.8% of company revenue in 2026, up from 7.7% in 2025, according to the Gartner 2026 CMO Spend Survey of 401 marketing leaders. CMOs now put 15.3% of that budget into AI. Their buyers moved faster. 94% of business buyers used AI during a purchase in 2025, per Forrester.
This page collects the B2B marketing statistics published between late 2024 and October 2026: marketing budget shares, buyer journey length, AI adoption, lead generation, content and LinkedIn. Every figure links to the body that published it, with the report name and date. It's written for B2B marketers and analysts who need a sourced number for a plan.
The numbers B2B marketing, checked 4 October 2026
Budgets grew by 0.1 points of revenue while AI took 15.3% of them, so businesses are funding AI out of other line items.
Two-thirds of buyers want to skip the seller, yet 69% still turn to one to check what an AI tool told them.
The B2B buyer journey runs 272 days in Dreamdata's tracking and 10.1 months in 6sense's survey, and the two publishers start the clock at different events.
B2B marketing budget statistics for 2026
The marketing budget barely moved. Gartner's survey, fielded January through March 2026 among 401 CMOs at businesses in North America, the UK and Europe, puts it at 7.8% of company revenue, and the vast majority of those companies report annual sales over $1 billion. Gartner calls the 0.1-point rise "effectively flat," a drop in the bucket next to the 15.3% now earmarked for AI.
Inside that flat total, the mix moved:
- 15.3% of marketing budgets go to AI initiatives, and AI-ready companies, the ones ahead of the curve, spend 21.3%
- Labor rose from 21.9% of the budget in 2025 to 24.5% in 2026 (Gartner, 8 June 2026)
- Awareness and conversion take 62.6% of total media spend, up more than 10% since 2024
- Loyalty and retention fell 29% over the same period, to under 15% of media spend
- Digital media is more than two-thirds of media investment, up 18% since 2024
CMOs who chase new logos with a shrinking retention line are putting all their eggs in one basket, and Gartner flags it directly, reporting that the most AI-mature teams give loyalty a larger share. Meanwhile 56% of CMOs say they lack the budget to deliver their 2026 marketing strategy. Talent tops their biggest challenges on AI, with 38% citing a lack of internal AI expertise.
Digital marketing channels took 61.1% of total marketing spend in 2025, per the Gartner 2025 CMO Spend Survey of 402 marketing leaders, and paid channels were 69% of digital spend.
| Digital channel | Share of digital spend, 2025 | Change reported by Gartner |
|---|---|---|
| Paid search | 13.9% | Up from 13.6% |
| Digital display advertising | 12.5% | Up 17% year over year |
| Social advertising | 12.2% | Flat share |
| Email marketing | 7.4% | Marginal increase |
| Owned and earned channels overall | Down 9% year over year | Email the only exception |
Search engines take the largest single slice of digital money. For the cost side of that platform, see our search engine marketing statistics, and for the wider ad market, our advertising industry statistics.
Forrester's planning data points the same direction. Its Budget Planning Survey, 2025 found 83% of B2B marketing decision-makers expected increased investment over the next 12 months. Forrester's strategy advice tells B2B marketers to move at least 15% of content or digital marketing spend toward brand visibility in AI search.
Why the published B2B marketing budget figures disagree
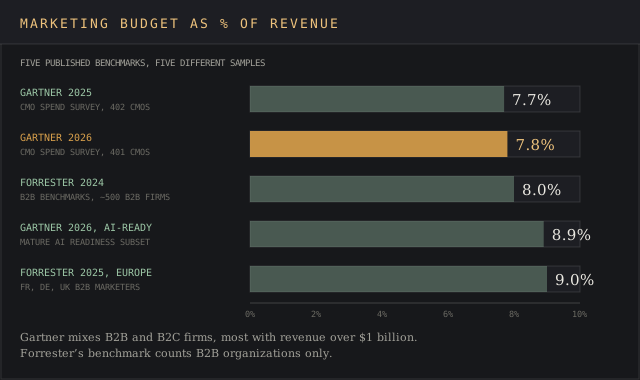
- Gartner, 7.8% (2026): 401 CMOs, mostly at businesses with sales over $1 billion, B2B and B2C combined.
- Gartner AI-ready subset, 8.9% (2026): the organizations reporting mature AI readiness.
- Forrester, 8% (2024): the 2024 B2B Marketing Budget Benchmarks, nearly 500 B2B companies only. The largest group invests 7.1% to 10%.
- Forrester Europe, 9% (2025): French, German and UK B2B marketers in the 2025 planning survey.
The devil's in the details. Gartner's figure mixes consumer and B2B businesses, and Forrester's 8% is a B2B-only mean that hides a wide spread in production and manufacturing. A professional services firm and a component maker can both land on 8% for opposite reasons.
For most businesses, the useful benchmark is the survey whose sample matches their size and sector, and any single "average B2B budget" figure is a starting point for marketers in the conversation with finance.
B2B buyer journey and sales cycle statistics
Buyers decide early, and sales cycles are getting shorter. The 6sense 2025 Buyer Experience Report, published 12 November 2025 and built on nearly 4,000 buyers across North America, EMEA and APAC, found:
- Average buying cycles fell from 11.3 months in 2024 to 10.1 months in 2025
- Buyers first contact a seller 61% of the way through the buying journey, down from 69%
- 94% of buying groups ranked preferred vendors before first contact
- The pre-contact favorite won the deal 77% of the time
That leaves sellers confirming decisions buyers already made, and bottom-funnel conversion rates depend on making that shortlist. The early bird catches the worm here, since a vendor missing from the day-one shortlist is losing deals it never sees.
Dreamdata's benchmarks report, published 10 March 2026 from 3.5 million customer journeys, puts the full B2B customer journey at 272 days, up from 211. Buyers spend the first 220 days forming decisions before they enter the pipeline, and marketers own 81% of the journey. Vendors that want to stay ahead of the shortlist have to be visible in those 220 days.
| Publisher | What it measures | Figure | Sample |
|---|---|---|---|
| Dreamdata, March 2026 | Full customer journey, first tracked touch to close | 272 days | 3.5 million customer journeys |
| 6sense, November 2025 | Buying cycle reported by buyers | 10.1 months (about 307 days at 30.4 days a month, our calculation) | Nearly 4,000 buyers |
| Factors.ai via LinkedIn, September 2026 | Research before a deal enters the CRM | 124 days | 850+ companies, 50,000+ closed deals |
| Dreamdata, March 2026 | Pre-pipeline research phase | 220 days | 3.5 million customer journeys |
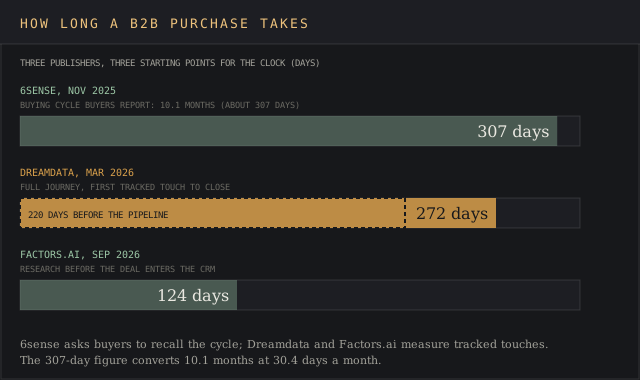
Read between the lines and the three numbers agree on the shape marketers plan around. 6sense asks buyers to recall a cycle, Dreamdata tracks every anonymous touch it can tie to a closed deal, and Factors.ai counts research days before the CRM opportunity exists.
6sense puts first seller contact 61% of the way in and Dreamdata puts 220 of 272 days before the pipeline, so both have more than half of the work done before a seller joins. Sales cycles measured from CRM creation understate the real timeline.
Buying group size depends on who counts. Forrester's State of Business Buying, 2026, based on nearly 18,000 buyers at businesses worldwide, counts 13 internal decision-makers and influencers plus nine external ones, with procurement a decision-maker in 53% of purchases. Dreamdata's count rose from 6.8 stakeholders to 10, and those groups engage sellers earlier, at 61% of the journey in 6sense's data.
AI statistics in B2B buying and marketing
AI became the first stop in the buyer journey. Forrester's survey found 94% of business buyers used AI during a purchase in 2025, up five points. 61% use private AI tools their employer provides.
Gartner's buyer data says sales efforts should shift toward validation. Its survey of 645 B2B buyers, fielded August through September 2025 and released 20 May 2026, found:
- 45% used GenAI during a recent purchase, mostly to research vendors and products
- 69% prefer to validate AI-generated insights with a sales rep
- 51% expect misleading information from GenAI, and 49% expect it from a seller
- 67% prefer a rep-free experience, and 70% want a fully digital, self-service purchase
The Content Marketing Institute's B2B Content and Marketing Trends: Insights for 2026, a survey of 1,015 B2B marketers published 8 October 2025, reports 95% of their companies use AI-powered applications. 89% of those marketers use AI tools for content creation, and 87% of them say productivity improved. Only 39% say content performance improved, and 12% say quality got worse.
The jury's still out on what AI does for results, and marketers say so. 68% of B2B marketers sit in the exploratory or developing stage of their AI strategy, per CMI, and 28% are experimenting with AI agents. AI tools are the budget line B2B marketers most often plan to grow, with 45% naming AI-powered marketing tools among their top three 2026 increases, ahead of events (33%) and owned media (32%).
HubSpot's 2026 State of Marketing Report says nearly 70% of marketers see leads arrive later in the buying process because buyers did AI-assisted research first. That shift also hits organic search and organic traffic, which our AI traffic report measures site by site.
B2B lead generation statistics
Lead generation is judged on quality first. HubSpot's 2026 report ranks the top metrics marketers use to judge success:
- Lead quality and MQLs, 39%
- Lead-to-customer conversion rate, 34%
- ROI, 31%
- Customer acquisition cost, 30%
- Lead generation volume, 29%
Lead quality is the most important goal on that list, and lead volume sits fifth. Pressure to prove ROI runs through it. ROI ranks third, and Gartner says CMOs must deliver growth "without meaningful budget expansion."
HubSpot found 77% of marketers rated the quality of their leads "high or very high," yet 30% still name lead generation among their biggest challenges in 2026. Customer acquisition cost is total marketing and selling spend divided by new customers won in the period. Pipeline velocity measures how fast an opportunity moves from creation to a closed deal.
Converting attention into action is the hardest part for marketers. CMI's 2026 survey lists the biggest challenges in content marketing as creating content that prompts a desired action such as conversion (40%), resource constraints (39%) and measuring content effectiveness (33%), so low conversion rates top the list.
Creating enough quality content follows at 28%. For high quality leads, the B2B marketers who reported effective programs credit content relevance and quality (65%) and team skills (53%) ahead of budget (20%).
Personalization and account-based marketing
Shallow personalization is par for the course among marketers. CMI found 89% of B2B marketers personalize content, but 59% call it basic, limited to one or two channels. 85% personalize email campaigns and 33% personalize websites or landing pages.
HubSpot reports 93% of marketers say personalization improves leads or purchases, and Gartner's CMOs list enhanced personalization among the biggest influences on their 2026 channel mix. Personalized CTAs, landing pages and email copy all count as basic personalization in CMI's scale, and personalized experiences across most touchpoints reach 6% of teams.
Account-based marketing brings personalization to the account list. CMI's survey shows 30% of B2B marketers use ABM only and 19% use ABM plus ABX, while 51% use neither. Among ABM users who measured, 65% say the strategy outperforms traditional marketing initiatives. Budget for it with our account-based marketing cost breakdown, or compare vendors in our ABM platforms ranking.
Intent data feeds most of those programs, since it flags purchase intent before a form fill. For intent data, our pricing report lists what 15 providers charge, and our intent data providers guide ranks them. For demand generation teams buying contact records, see the B2B data providers ranking.
B2B content marketing statistics
Content Marketing Institute numbers show a slow climb in effectiveness. In its Insights for 2026 survey, 12% of B2B marketers called their efforts highly effective and 47% somewhat effective, so 59% met most goals. 97% have a content strategy, and 61% say it improved over the last year. Strategy refinement drove the gains for 74%.
Preferred content formats barely change from one survey to the next. CMI's Outlook for 2025, published 9 October 2024 from 980 marketers, lists the content types B2B teams used:
- Short articles and posts, 92%
- Videos, 76%
- Case studies and customer stories, 75%
- Long articles, 69%
- E-books and white papers, 51%
- Research reports, 36%
Among content types, marketers rated videos most effective at 58%, ahead of case studies at 53%, and 61% of marketers expected their organization to increase video investment in 2025, the top item on CMI's investment list.
HubSpot's 2026 report ranks content formats by ROI the same way, with short-form video at the top at 49%. Original research earns its slot, since 55% of decision-makers in the 2024 Edelman-LinkedIn study named strong research and data a top trait of quality content. Most teams stretch one study further by repurposing its content into posts, charts and video.
Measurement remains the sore point. In the CMI Outlook for 2025, 56% of B2B marketers said attributing ROI to content was a measurement challenge, and 56% said the same of tracking customer journeys. Money doesn't grow on trees, so a team that can't tie valuable content to revenue generation struggles to defend the next budget.
On first-party data, 91% collect it, and 63% gather it through CRM and sales interactions. Our CRM software cost report prices the tools that hold it.
Owned media, the channel that builds consistent traffic over time, is on the 2026 increase lists of 32% of B2B marketers, per CMI. Thought leadership is nearly universal. 96% of B2B organizations create thought leadership content, but 37% say fewer than 5% of their experts take part. Those marketers ranked LinkedIn (76%), email newsletters (54%) and webinars (52%) as the most effective content distribution channels for it.
Pacesetters get higher engagement from their own experts, with 24% reporting substantial or widespread participation against 18% overall.
LinkedIn B2B marketing statistics
LinkedIn is the social media platform B2B marketers rate highest, and the LinkedIn B2B marketing statistics below come from LinkedIn's own pressroom, Microsoft's investor materials, and independent research where it exists.
LinkedIn users and demographics
Membership passed 1.3 billion, per LinkedIn. Microsoft reported LinkedIn revenue up 12% (10% in constant currency) in its fiscal fourth quarter of 2026, "primarily driven by Marketing Solutions," on its 29 July 2026 earnings call, and member growth has been in double digits for five straight years. Paid video ads on the platform grew 26% year over year, so video posts are pulling more ad money.
LinkedIn users skew young and male, and membership overstates activity. In the US, 32% of adults said they use LinkedIn in the Pew Research Center survey fielded through June 2024, up from 30% in 2023. Pew's 2025 wave dropped LinkedIn from its list. The age and gender distribution comes from data in the platform's ad tools, compiled by Kepios on DataReportal for January 2025:
- 47.3% of LinkedIn's ad audience is aged 25 to 34 (20.5% female, 26.8% male; our sum)
- 28.7% is aged 18 to 24, so younger professionals under 35 make up 76.0% of the reachable audience (our calculation)
- 56.9% of the audience is male and 43.1% female
For user counts across other social platforms, see our social media statistics report.
LinkedIn ads performance
Two attribution companies rank each ad platform, and both put the LinkedIn platform first.
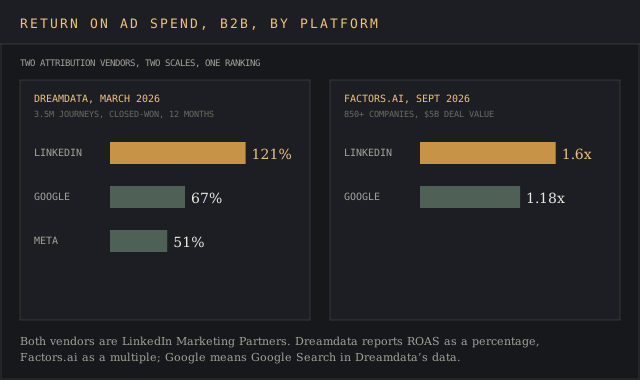
- Dreamdata (March 2026): LinkedIn returns 121% on ad spend, Google Search 67% and Meta 51%. LinkedIn holds 41% of B2B paid social budgets.
- Factors.ai (published by LinkedIn, 24 September 2026): LinkedIn delivers 1.6x return on ad spend against 1.18x on Google, and its ads hold 39.8% of B2B display budget share, up 8 points since 2024.
Both companies are LinkedIn Marketing Partners, so marketers should read the ranking as directional. They agree on the order and disagree on scale because Dreamdata attributes revenue on closed-won deals over 12 months with its own model, while Factors.ai draws on 850+ companies and $5 billion in deal value. ROAS folds conversion rates and deal size into one number, so the two scales can't be compared digit for digit.
Dreamdata's data shows, in a summary on LinkedIn's marketing blog dated 9 April 2026, a LinkedIn click at $6.91 but a company influenced at $90, against $127 on the Google Search platform and $148 on Meta. B2B marketers buying high-quality leads at the account level should track that second figure.
Non-branded search fell from 37% to 33% of budgets as cost per click rose 29% and click-through rates dropped 26%. Run your own numbers through our CPM calculator.
Factors.ai's deal data puts the focus on breadth and adds the engagement patterns behind win rates:
- Reaching six or more contacts before a deal exists lifts win rates by 17 points
- Adding three more contacts during the cycle lifts them 16 points
- Accounts with higher engagement across a mix of roles do best, with end users, influencers and technical evaluators together lifting win rates by 22 points
- Pairing LinkedIn ads with organic activity on the same platform produces 2.4x higher win rates than paid alone
- LinkedIn-sourced deals close at a 34% higher average contract value than deals from other channels
LinkedIn's own ad site claims ROI for marketing customers improved 20% to 30% year over year and calls LinkedIn the #1 platform for B2B lead generation. Those claims come straight from the horse's mouth, LinkedIn's advertising site.
LinkedIn for content distribution and thought leadership
CMI's B2B marketers rank the LinkedIn platform first among social networks. In the Outlook for 2025, 85% of B2B marketers said LinkedIn delivers the best value of any social media platform, against 28% for Facebook and 22% for YouTube, and 68% increased their use of it. HubSpot's 2026 report counts 42% of all marketers using LinkedIn in their strategy, up 11% from 2024.
The 2025 Edelman-LinkedIn B2B Thought Leadership Impact Report, summarized by Edelman, focuses on hidden buyers in finance, legal and procurement, who fly under the radar of most campaigns:
- 53% of B2B decision-makers say strong thought leadership makes brand recognition matter less
- 95% of hidden buyers say it makes them more open to sales and marketing outreach
- 91% want industry insights that reveal unseen risks or opportunities
- 79% are more likely to champion a vendor in an RFP if it publishes consistently
LinkedIn frames the opportunity with the 95-5 rule, which holds that 5% of potential customers are in-market at any time, a figure LinkedIn cites in its 2024 thought leadership research summary. Target audiences outside that 5% need relevant content long before a sales conversation. For sellers working those accounts on the platform, our LinkedIn Sales Navigator review covers plans and limits.
Sales and marketing alignment statistics
Sales reps spend 40% of their time selling. The Salesforce State of Sales report, released 3 February 2026 from more than 4,000 sales professionals, found Gen Z sellers at 35%, losing about two hours a week to manual data entry. Sales coaching is thin for Gen Z reps, with 46% rarely getting feedback on their conversations and 47% lacking enough roleplay before customer calls.
B2B sales teams picked AI as the fix. 87% of sales organizations use it, per Salesforce State of Sales data, and nearly half of reps call cold phone calls the worst part of the job. Sellers expect AI agents to cut prospect research time by 34% and email drafting by 36%, and high performers are 1.7 times more likely to use prospecting agents.
Misalignment costs businesses trust. Gartner's June 2025 sales survey of 632 buyers found 69% saw inconsistencies between a supplier's website and what its seller told them, and 73% actively avoid suppliers who send irrelevant outreach. That buyer survey had 61% preferring a rep-free experience, and the 2026 survey put it at 67%.
Getting marketing and sales on the same page shows up in the CMI survey, where 45% of effective teams credited alignment with sales. A shared messaging framework template and a go-to-market plan template keep website copy and sales enablement material saying the same thing, and Gartner's 69% inconsistency figure is the cost of a go-to-market strategy that skips that step. Track the outcome with our win rate calculator.
How these B2B marketing statistics were sourced
Every figure on this page traces to the organization that ran the survey or owns the dataset. Figures restated by stats roundups, third party reviews sites or agency blogs were traced back to the original report or left out.
CMI and HubSpot survey marketers and other marketing professionals. Vendor research from 6sense, Dreamdata, Factors.ai, HubSpot and Salesforce is published by businesses that sell tools to the people they survey.
Gartner and Forrester sell full reports to clients, and their figures here come from public insights and press releases.
Dates are the publication date of each report. Where a newer edition replaced a figure, the newer one is used, and readings from previous years appear only to show the trend. For how B2B businesses buy the market and lead generation tools behind these marketing initiatives, our B2B market intelligence guide maps the categories, with a focus on what each tool type covers.
Where each B2B marketing figure was published, and what Gartner and Forrester keep for clients
Budgets and buyers: gartner.com (2026 CMO Spend Survey release of 11 May 2026, B2B buyer survey release of 20 May 2026, marketing media-spend release of 8 June 2026, 2025 CMO Spend Survey release of 2 June 2025, sales survey release of 25 June 2025) and forrester.com (Buyers' Journey Survey 2025, Budget Planning Survey 2025, 2024 B2B Marketing Budget Benchmarks and State of Business Buying 2026 blog posts).
Journey and attribution data: 6sense.com (2025 Buyer Experience Report, newsroom release of 12 November 2025), prnewswire.com (Dreamdata benchmarks report, 10 March 2026) and linkedin.com (Dreamdata summary of 9 April 2026, Factors.ai summary of 24 September 2026, 2024 Edelman-LinkedIn thought leadership study).
Marketer surveys: contentmarketinginstitute.com (Insights for 2026, 8 October 2025, and Outlook for 2025, 9 October 2024), hubspot.com (2026 State of Marketing Report), salesforce.com (State of Sales, 3 February 2026) and edelman.com (2025 B2B Thought Leadership Impact Report).
LinkedIn audience: news.linkedin.com (pressroom statistics), business.linkedin.com (advertising site), microsoft.com (FY2026 fourth-quarter earnings, 29 July 2026), pewresearch.org (social media fact sheet, survey fielded through June 2024) and datareportal.com (Kepios, January 2025).
Every figure was checked against its source on 4 October 2026. Gartner and Forrester keep their full survey reports for paying clients, so their figures here come from press releases and public blog posts. Factors.ai's deal data is public only through LinkedIn's 24 September 2026 summary, and Pew's 2025 wave dropped LinkedIn, so its June 2024 reading is the latest Pew figure for U.S. adult use.
Bottom line
B2B marketing budgets held at 7.8% of revenue in 2026 while the mix inside them moved. Gartner's survey shows 15.3% now going to AI and a larger labor line, while loyalty and retention shrank, and Forrester's B2B-only benchmark lands at 8%.
Buyers finished most of the work alone. 94% used AI tools, two-thirds want to buy without a seller, and the vendor on the day-one shortlist won 77% of the time in 6sense's data.
B2B marketers put that early-stage money into LinkedIn. Two attribution companies rank its ads first on return, and CMI respondents rate it the best-value platform at 85%.