Agriculture statistics for 2026 show farm income down 2.6% and 15,000 fewer US farms
 By Jan Suski. I go deep on every review, checking every number against its source and digging up details other coverage misses, a habit from six years of SEO and link building for tech companies. Bylines at Surfer, Brand24, and Senuto. How the scoring works.
The numbers US and global agriculture, checked 4 October 2026
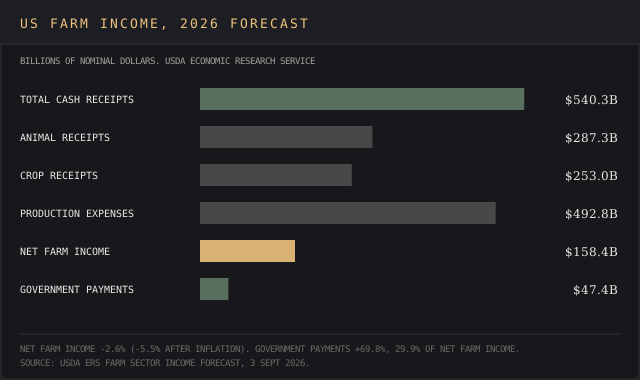
Government payments of $47.4 billion equal 29.9% of the $158.4 billion net farm income forecast for 2026.
Crop receipts rise 6.1% to $253.0 billion and animal receipts fall 5.4%, yet livestock still earns $34.3 billion more.
Farms fell by 15,000 in 2025 as average size rose 3 acres to 469.
US farms are expected to net $158.4 billion in 2026, $4.3 billion (2.6%) less than in 2025, in the USDA Economic Research Service's farm income forecast of September 3. After inflation the drop is 5.5%, and government payments pick up the slack, jumping 69.8% to $47.4 billion.
The farm count keeps falling. The National Agricultural Statistics Service (NASS) estimated 1,865,000 US farms in 2025, down 15,000 in a year, on 873.95 million acres, in its Farms and Land in Farms summary of February 2026.
This report collects the agriculture data published through early October 2026, each figure linked to the agency that released it, for analysts, lenders, farm businesses & students. It covers farm income, farm counts, producers, crops, livestock, GDP and jobs, the top states, Canada, global hunger and the NASS release calendar.
The figures matter to anyone pricing farm credit, inputs or food in 2026, since government payments now equal 29.9% of net farm income. The sector's size depends on who measures it, from $222.3 billion of US farm value added to a $12.97 trillion world market.
The 2026 US farm income forecast is $158.4 billion, with $47.4 billion from government
Costs are climbing faster than sales. ERS expects production expenses of $492.8 billion, up 4.5%, against cash receipts of $540.3 billion, down 0.3%, and net cash farm income still edges up 0.4% to $176.4 billion because payments from government programs grow by $19.5 billion.
| Farm income measure | 2026 forecast | Change from 2025 |
|---|---|---|
| Net farm income | $158.4B | -2.6%; -5.5% after inflation |
| Net cash farm income | $176.4B | +0.4% |
| Total cash receipts | $540.3B | -0.3% |
| Crop receipts | $253.0B | +6.1% |
| Animal & product receipts | $287.3B | -5.4% |
| Government payments | $47.4B | +69.8% |
| Production expenses | $492.8B | +4.5% |
Source: USDA ERS Farm Sector Income Forecast, September 3, 2026.
Corn, soybeans and cattle brought in about 44% of 2025 cash receipts. Corn and soybeans earned $104.1 billion in 2025, 43.7% of crop receipts, and cattle and calves earned $133.7 billion, 44.0% of animal receipts, per the ERS farming and farm income page. The ERS FAQ ranks cattle, corn, dairy, soybeans and broilers as the five largest commodity sources of 2024 cash receipts, with wheat ninth.
US farms fell to 1,865,000 on 873.95 million acres in 2025
NASS counts farms every year from surveys and every five years by census, and both series point down. Land in farms decreased 2,510,000 acres in 2025, and 48.0% of farms sold under $10,000 of products while 9.9% sold $500,000 or more.
- 2.04 million farms in the 2017 Census of Agriculture.
- 1.9 million in the 2022 Census of Agriculture, down 7%.
- 1.88 million in 2024, per ERS.
- 1,865,000 in 2025, averaging 469 acres.
Texas has the most farms, 229,000 in 2025 on 125 million acres. The University of Illinois' Farm Policy News tallied the Midwest changes, with Minnesota down 1,300 farms and Iowa and Indiana down 500 each. Family farms were 97% of US farms in 2024, and large-scale family farms, about 5% of farms, produced 50% of the value of production, ERS reports.
The 2022 Census of Agriculture counted 3.4 million producers with an average age of 58.1
NASS's February 13, 2024 release counted 1.9 million farms and ranches averaging 463 acres on 880 million acres, which produced $543 billion of agricultural products, up from $389 billion in 2017. NASS Administrator Hubert Hamer said "Census of Agriculture data tell a story," and the producer highlights carry most of it:
- The average age of all producers reached 58.1, up 0.6 years from 2017.
- Producers aged 65 and older rose 12.1% to 1.29 million, and those under 35 numbered 296,480.
- Slightly over 1 million were beginning farmers, up 11% from 2017.
- Women made up 36% of producers, and 305,753 had served in the US military.
Only 42% named farming as their primary occupation, so 58% of the 3.4 million producers list another primary occupation. 61% of farm operators ended up responding to the census, which collects information on land use, practices, income and expenses every five years.
Corn production falls 7% in 2026, soybeans rise 6% and wheat drops 23%
The NASS September Crop Production report puts corn at 15.8 billion bushels on a yield of 178.5 bushels an acre, 1% under the August forecast. Soybeans go the other way.
| Crop | 2026 production | Change vs 2025 | Yield and harvested area |
|---|---|---|---|
| Corn | 15.8B bushels | -7% | 178.5 bu/acre on 88.5M acres |
| Soybeans | 4.53B bushels | +6% | 52.8 bu/acre on 85.9M acres |
| All wheat | 1.53B bushels | -23% | 48.1 bu/acre on 31.9M acres |
| Cotton | 13.2M bales | -5% | 480-pound bales |
| Barley | 116M bushels | -19% | n/a |
| Oats | 69.1M bushels | -1% | n/a |
Sources: NASS Crop Production, Sept 11, 2026; NASS Small Grains 2026 Summary, Sept 30, 2026.
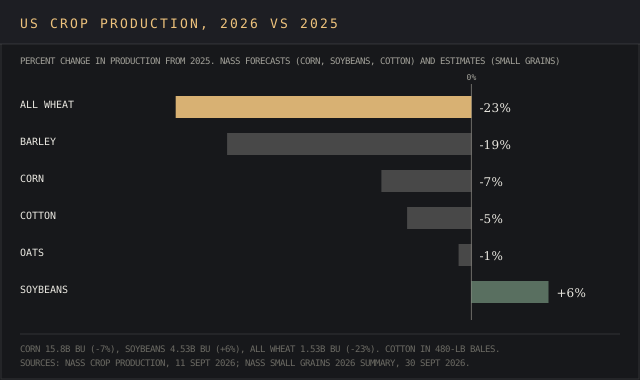
Wheat took the hardest hit. The Small Grains Summary of September 30 puts the yield at 48.1 bushels, down 5.2, and barley's 116 million bushels are a drop in the bucket next to corn. Iowa leads corn at 2.8 billion bushels and Illinois leads soybeans at 688.4 million, per the NASS briefing, and NASS updates both forecasts on October 9.
More than nine in ten acres of the big three crops are engineered. More than 90% of US corn, upland cotton and soybeans are grown from GE varieties, per ERS adoption data updated December 12, 2025, with herbicide-tolerant soybeans at 96% and insect-resistant corn at 87%.
Precision agriculture spread across most corn acres in 15 years. Auto-steer guidance ran on 5.3% of planted corn acres in 2001 and 58% in 2016, per a February 2023 ERS report, and at least half of large row crop farms use yield maps, soil maps, variable-rate technology or guidance.
Red meat output reached 34.6 billion pounds through August 2026, with beef down 5%
January to August commercial red meat production was down 2% from 2025, per the NASS Livestock Slaughter report of September 24. Accumulated beef production fell 5% and pork rose 1%.
- August red meat production: 4.10 billion pounds, down 1%.
- August beef production: 1.98 billion pounds, down 2%.
- August cattle slaughter: 2.24 million head, down 4%.
Animal receipts still fall $16.4 billion in 2026, ERS forecasts, mostly from a $20.9 billion drop in chicken egg receipts, while cattle and calves receipts rise $7.0 billion. NASS publishes Livestock Slaughter again on October 22 and Cattle on Feed on October 23, per its calendar, so beef data for the coming months arrives within three weeks.
Farms add 0.8% of US GDP, and food-linked jobs make up 10.4% of employment
Farms contributed $222.3 billion to US gross domestic product in 2023, about 0.8%, and agriculture, food & related industries contributed $1.537 trillion, a 5.5% share, per the ERS Charting the Essentials series. The BEA share for agriculture, forestry, fishing and hunting was 0.7% in the first quarter of 2026, per FRED.
Jobs tell a bigger story. ERS counts 22.1 million jobs related to agricultural and food sectors in 2022, 10.4% of US employment, including about 2.6 million on farms.
| Farm labor measure | Figure | Source |
|---|---|---|
| Agricultural worker jobs, 2025 | 831,900 | BLS |
| Median pay, May 2025 | $17.25 an hour | BLS |
| Projected change, 2025 to 2035 | -2% | BLS |
| Workers hired by farm operators, April 2025 | 637,000 (+3%) | NASS Farm Labor |
| Average gross wage, hired workers, April 2025 | $19.52 an hour (+3%) | NASS Farm Labor |
Read between the lines on farm wages. NASS averages gross pay for directly hired workers in one April week and BLS reports a May median for its occupation, so the two sit $2.27 apart. Consumers spent 12.9% of their budgets on food in 2024, and farmers received 15.9 cents per food dollar in 2023, which the American Farm Bureau Federation rounds to 15 cents.
California led 2024 farm cash receipts among the top agriculture states with $61.2 billion
ERS ranks the top 10 states by 2024 cash receipts as California, Iowa, Nebraska, Texas, Kansas, Illinois, Minnesota, Wisconsin, Indiana and North Carolina. The California Department of Food and Agriculture says "Nearly half of the country's vegetables and over three-quarters of the country's fruits and nuts are grown in California," with milk ($8.61 billion) and almonds ($5.66 billion) on top of its commodity list.
Agriculture, forestry, fishing and hunting was the biggest contributor to North Dakota's 3.8% annualized GDP growth in the fourth quarter of 2025, the Bureau of Economic Analysis said in its April 9 release.
Canada's 2021 Census of Agriculture counted 189,874 farms and operators averaging 56.0 years
Canada is in the same boat, with its farm count down 1.9% from 2016 to 189,874 in 2021, Statistics Canada reported in The Daily on May 11, 2022. The average age of farm operators increased from 55.0 to 56.0 in 2021, and farms with a succession plan rose from 8.4% in 2016 to 12.0%.
| Measure | Canada, 2021 | United States, 2022 |
|---|---|---|
| Farms | 189,874 | 1.9 million |
| Land in farms | 153.7M acres | 880M acres |
| Average farm size | 809.4 acres | 463 acres |
| Average age | 56.0 | 58.1 |
| Women's share | 30.4% | 36% |
Sources: Statistics Canada, Oct 20, 2022 and May 11, 2022; NASS, Feb 13, 2024.
Global hunger reached 645 million in 2025 as farm output heads 13% higher
Hunger has fallen 43 million from its 2022 peak, to 645 million people in 2025, or 7.8% of the world population, per The State of Food Security and Nutrition in the World 2026, and 2.1 billion faced moderate or severe food insecurity. Africa's prevalence slipped from 20.3% to 20.0%, about 309 million people.
"These numbers are important because they show that hunger is not inevitable. With strong economic policies, social protection and sustained investments in more efficient, more inclusive, more resilient and more sustainable agrifood systems, we can bend the hunger curve."
Qu Dongyu, Director-General, FAO, SOFI 2026 release, July 21, 2026
Acute crises run on a separate count. The Global Report on Food Crises 2026 puts 266 million people in 47 countries and territories at high levels of acute food insecurity in 2025, with conflict behind 147.4 million.
The OECD-FAO Outlook projects production up 13% over 10 years and gross agricultural income per worker up 9% by 2035, with livestock behind about 77% of the growth in direct agricultural emissions.
"Their resilience is our food security. Protecting it means better support to weather shocks, sustained investment in productivity, and open, well-functioning global markets."
Mathias Cormann, Secretary-General, OECD, OECD-FAO Outlook release, June 29, 2026
World agricultural output rose nearly fourfold between 1961 and 2020 while agricultural land expanded 7.6%, ERS economists wrote in Amber Waves in September 2024. They note input intensification is sometimes linked with degradation of natural resources.
- Agriculture accounts for more than 70% of global freshwater withdrawal, per FAO's SOLAW 2025.
- 1.7 billion people live where yields fell at least 10% from human-induced land degradation, per FAO's Agrifood Economics Division, November 3, 2025.
- Livestock production keeps expanding, with meat output up 55% from 2000 to 361 million tonnes in 2022, and agrifood emissions rose 10%, per FAO's Statistical Yearbook 2024.
- Agriculture employed 25.76% of the world's workers in 2025 and 1.52% in the United States, per World Bank modeled ILO estimates.
Why the published agriculture estimates diverge
Eight published figures put a size on agriculture, from $222.3 billion to $12.97 trillion, and the devil's in the details of what each one counts.
| Publisher | What it counts | Figure | Year |
|---|---|---|---|
| USDA ERS, BEA data | US farm value added | $222.3B | 2023 |
| USDA ERS | US farm cash receipts, forecast | $540.3B | 2026 |
| USDA NASS census | US agricultural products sold | $543B | 2022 |
| USDA ERS | US agriculture, food & related industries | $1.537T | 2023 |
| ResearchAndMarkets | Global agricultural commodity market | $1.7T | 2024 |
| FAO | World agriculture value added | $4.0T | 2023 |
| World Bank | Agriculture share of world GDP | 4.01% | 2025 |
| The Business Research Company | Global agriculture market | $12.97T | 2025 |
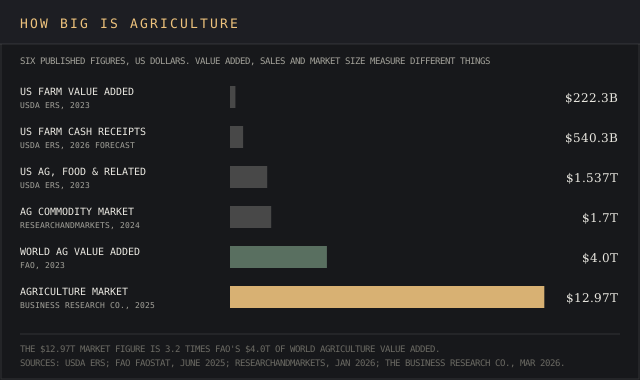
- Value added nets out purchased inputs, so US farms' $222.3 billion of 2023 value added sits under the $543 billion of products they sold in 2022.
- Scope multiplies the answer by 6.9 when ERS adds the food and related industries downstream of the farm gate.
- Market reports count sales. The Business Research Company's $12.97 trillion equals 14% of the $92.6 trillion world GDP FAO reports for 2023, against the World Bank's 4.01% value-added share.
- Coverage moves hunger counts. The 2025 Global Report on Food Crises counted over 295 million people in 53 countries for 2024, and the 2026 edition counts 266 million in 47, while the share analysed rose from a revised 22.7% to 22.9%.
The strongest counterpoint to the small numbers comes from ERS itself, since farms add 0.8% of GDP yet 22.1 million jobs tie back to agriculture and food.
How to track agriculture data through NASS reports, the release schedule and databases
NASS describes its job on its website, nass.usda.gov, as "Providing Timely, Accurate and Useful Statistics in Service to U.S. Agriculture," built from hundreds of sample surveys a year plus the census. A visit to the Quick Stats database lets users filter that information by commodity, location or year.
Developers get the same information through the Quick Stats API, with a key sent by email and a cap of 50,000 records per request. NASS also sends national reports to email subscribers through its subscription page, and its release schedule lists the October dates to keep an eye on:
- October 9 at noon ET: Crop Production
- October 22 at 3:00 p.m. ET: Livestock Slaughter
- October 23 at 3:00 p.m. ET: Cattle on Feed
- October 30 at 3:00 p.m. ET: Agricultural Prices
Crop Progress lands four times in October on the same schedule.
For an overview of the rest of the chain, the ERS food dollar series splits spending into 13 industry groups including transportation, and the weekly Grain Transportation Report tracks barges, railroads, trucks and vessels, the infrastructure grain moves on. FAOSTAT carries over 20,000 indicators for 245 countries, per FAO's 2025 yearbook release, and the World Bank holds its agriculture series beside its poverty data.
Government data comes straight from the horse's mouth, and commercial data layers on top. Alternative data providers sell satellite imagery, market database platforms include agriculture modules, and teams pulling feeds by code can compare market intelligence APIs and other data providers.
Buyers model weather and freight risk with supply chain risk management software and demand forecasting software, and supply market intelligence covers sourcing. The small business statistics, retail industry statistics and AI environmental impact statistics reports cover farm firms, grocery sales and data center water use, and secondary market intelligence explains how to work with published data like this.
Every agency behind these farm numbers, and the 2026 totals still to come
US farm income, farms and crops: ers.usda.gov (Farm Sector Income Forecast, 3 September 2026; Charting the Essentials; GE adoption data updated 12 December 2025; Amber Waves, September 2024; precision agriculture report, February 2023).
NASS releases: nass.usda.gov with esmis.nal.usda.gov (Farms and Land in Farms, February 2026; Crop Production, 11 September 2026; Small Grains Summary, 30 September 2026; Livestock Slaughter, 24 September 2026; Farm Labor, May 2025; 2022 Census of Agriculture release of 13 February 2024).
Jobs, GDP and states: bls.gov (Occupational Outlook Handbook), bea.gov (state GDP release of 9 April 2026), fred.stlouisfed.org, cdfa.ca.gov, fb.org (Fast Facts) and farmpolicynews.illinois.edu (February 2026).
Canada and the world: www150.statcan.gc.ca (11 May and 20 October 2022), fao.org (SOFI 2026, 21 July 2026; SOLAW 2025; Statistical Yearbooks 2024 and 2025), oecd.org (OECD-FAO Agricultural Outlook 2026-2035, 29 June 2026), fightfoodcrises.net (Global Reports on Food Crises 2025 and 2026) and data.worldbank.org. Market-size reports: businesswire.com (ResearchAndMarkets, 28 January 2026) and giiresearch.com (The Business Research Company).
Every figure was checked against its source on 4 October 2026. Final 2026 crop, farm income and hunger totals arrive in 2027, so the 2026 figures here are forecasts, year-to-date counts and survey estimates.
Frequently asked questions
Are farmers increasing or decreasing?
US farms are decreasing, to 1,865,000 in 2025 from 1,880,000 in 2024. Beginning farmers increased 11% between the 2017 and 2022 censuses, to slightly over 1 million.
What are the 5 F's of agriculture?
The Texas Small Farmers & Ranchers Community Based Organization lists the 5 F's as food, fabric, fuel, forestry and flowers, in a September 21, 2026 article.
Which state is #1 in agriculture?
California, with $61.2 billion of farm cash receipts in 2024, ahead of Iowa and Nebraska. Texas has the most farms, 229,000.
What are the current statistics for American agriculture?
1,865,000 farms on 873.95 million acres in 2025, net farm income forecast at $158.4 billion for 2026, and a 15.8 billion bushel corn crop.
What are the basic statistics used in agriculture?
Production of crops and livestock, yield per acre, harvested acres, head slaughtered, cash receipts and net farm income. NASS collects that information from surveys and the census, and ERS, USDA's agricultural economics agency, turns it into income forecasts.
What are 10 interesting facts about agriculture?
- The average US producer was 58.1 in 2022.
- 36% of US producers are women.
- 42% of producers farm as their primary occupation.
- Large-scale family farms produce 50% of the value.
- Farmers get 15.9 cents per food dollar.
- Government payments equal 29.9% of 2026 net farm income.
- Over 90% of corn, cotton and soybean acres use GE seed.
- Agriculture takes over 70% of freshwater withdrawals.
- World farm output rose nearly fourfold from 1961 to 2020.
- AFBF says one US farm feeds 183 people a year.
Bottom line
US agriculture enters the 2026 harvest with 15,000 fewer farms, government payments up 69.8% and net farm income forecast 2.6% lower. Soybeans grow, wheat and corn shrink, and livestock receipts fall as egg prices drop.
On the final corn crop the jury's still out until the October 9 Crop Production report. Before quoting any figure here, check if it counts value added, sales or market size, and read any income change without an inflation adjustment as a nominal number.