Best demand forecasting software in 2026: 10 tools ranked
 By Jan Suski. I go deep on every review, checking every number against its source and digging up details other coverage misses, a habit from six years of SEO and link building for tech companies. Bylines at Surfer, Brand24, and Senuto. How the scoring works.
· Prefer this source on Google
Quick comparison of demand forecasting tools
Ten tools with what each vendor ties its accuracy figure to, the entry price where one exists, and the buyer each fits. Rows marked Quote route buyers to a sales call for pricing.
| # | Provider | Accuracy evidence | Entry price | Best fit |
|---|---|---|---|---|
| 1 | o9 Solutions | +11 pts monthly, +14 weekly (Kraft Heinz, 7,000 SKUs) | Quote | Global CPG and manufacturers |
| 2 | Kinaxis | Forecast error down 22.6% (lab benchmark) | Quote, 12-week RapidStart | Discrete and process manufacturers |
| 3 | Blue Yonder | 12% accuracy gain (no customer named) | Quote | Retail, CPG, distribution |
| 4 | RELEX Solutions | Up to 99% (ceiling, no baseline) | Quote | Grocery and fresh-food retail |
| 5 | SAP IBP | About 90% (SLB) | Quote, 7-month G2 average rollout | SAP S/4HANA shops |
| 6 | Anaplan | 60% to over 85% (Wright Medical) | $114,609/yr Vendr median* | Finance-led connected planning |
| 7 | Logility (Aptean) | Forecast error down 20%+ (SERAX) | Quote | Mid-size and large manufacturers |
| 8 | ToolsGroup | +5 to 15 pts (no baseline) | Quote | Intermittent, long-tail demand |
| 9 | Netstock | Stock-out and inventory case studies | From $900/month | SMB distributors on 60+ ERPs |
| 10 | GMDH Streamline | 82%+ (unnamed coffee distributor) | Quote | Small manufacturers and wholesalers |
The median marked * is Vendr's anonymized buyer-reported contract value. Netstock's $900 a month is the vendor's own published starting price.
Where these figures come from
Accuracy figures are each vendor's own published claim, read on 24 September 2026, with the customer or baseline named where the vendor gives one. The Anaplan median comes from Vendr's marketplace page. Eight of the ten publish no price, so their rows read Quote.
Six of these ten vendors also appear on our supply chain intelligence software ranking, which judges them as full planning suites. This page judges the forecast itself: who stands behind the accuracy claim, how the engine is documented, and what it costs to find out.
Demand forecasting software turns historical data, open orders and outside signals into a number a planner can buy against. The ten tools below run from Netstock, which starts at $900 a month, to Anaplan, whose Vendr median is $114,609 a year.
This page ranks them on five criteria a buyer can test before signing, from how often the forecast refreshes to who stands behind each accuracy claim. Every figure links to the vendor's own site or to Vendr's anonymised buyer data.
It's written for supply chain planners, S&OP leads and operations teams choosing between enterprise demand planning platforms and lighter demand planning software built around inventory planning. Retail, CPG, distribution and discrete manufacturing all show up in the case studies behind the order.
Gartner split its supply chain planning Magic Quadrant in two for 2026, publishing Process Industries on 17 March and Discrete Industries on 18 March. Four vendors were named Leaders in both, and three of them made this list.
Evaluation criteria for demand forecasting software
Five criteria decide the shortlist, and the ranking below applies them in this order. The first two carry the most weight, because a buyer who can't see how a forecast is built, or who measured its accuracy, is taking the vendor's word for both.
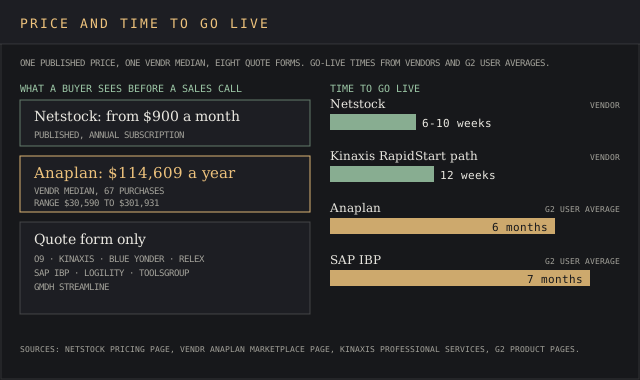
Accuracy evidence tied to a named customer
A forecast accuracy figure is checkable only when a customer, a metric and a baseline sit behind it. o9's Kraft Heinz case gives all three: an 11% increase in monthly accuracy and 14% in weekly across 7,000 SKUs. RELEX's up to 99% is a ceiling with no baseline attached.
Vendors that publish an accuracy figure and name the customer behind it: o9, SAP IBP, Anaplan and Logility.
Open the case study, find the metric (MAPE, WAPE or bias) and the starting point, and treat anything labelled "up to" as a ceiling.
Documented forecast engine: refresh cadence, horizon and probabilistic output
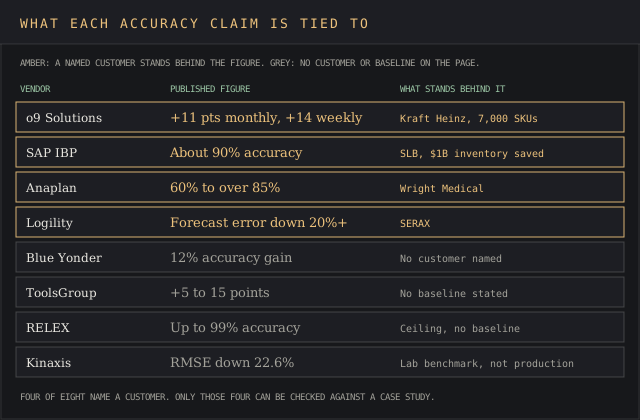
Check the vendor's own documentation for three items: how often the forecast refreshes, how far ahead demand sensing looks, and if the output is a range or a single number. SAP's training course states four to eight weeks at daily granularity. Kinaxis states 0 to 2 months, updated daily and in some cases hourly.
Probabilistic forecasting returns a distribution. A point forecast puts all your eggs in one basket, while a range shows how wrong the number could be. Anaplan's PlanIQ, for example, defaults to P10, P50 and P90 quantiles, which lets a planner set safety stock from the spread. Four of the ten tools document it on their own pages.
2026 Gartner supply chain planning placement
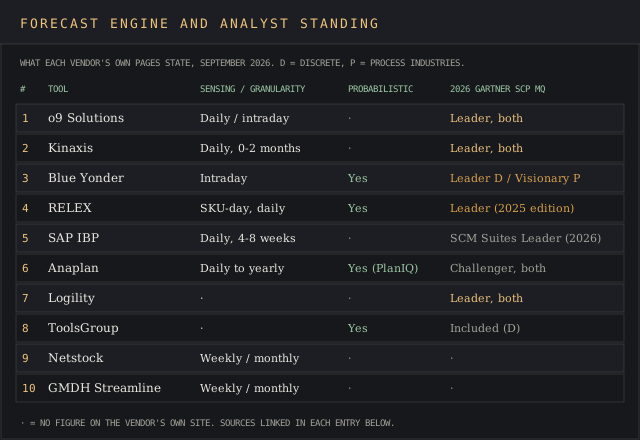
Each vendor's own press release states where Gartner placed it, so this check takes five minutes. Leader in both 2026 reports counts highest. A Leader or Visionary slot in one comes next, then Challenger, then plain inclusion.
Price visibility before a sales call
Two of ten show a number before a demo: Netstock's $900 a month and Anaplan's $114,609 Vendr median across 67 purchases. The other eight quote privately, so this criterion mostly separates the mid-market tools at #9 and #10. A buyer who sees a real number first stays in the driver's seat once the sales call starts.
Review depth on G2 and Capterra
The G2 time-to-implement averages are some of the most valuable insights on those pages. G2 review counts run from 13 on Kinaxis's page to 480 on Anaplan's. More reviews mean more implementation stories to check against a sales pitch, and how G2 verifies reviewers decides how much weight each one deserves.
Top demand forecasting tools, ranked
o9 Solutions
Best fit
Global manufacturers and consumer goods brands running global supply chains that want demand sensing, consensus forecasting and integrated business planning on one AI powered platform, and can fund a multi-month rollout.
o9 Solutions runs demand planning on its Digital Brain platform and Enterprise Knowledge Graph from Dallas. Existing investors added $116 million at a $3.7 billion valuation in July 2023, when o9 reported 55% year-over-year ARR growth. Our o9 Solutions review covers the wider platform.
Its demand sensing supports store-item-channel forecasting with daily or intraday resolution, fed by real-time data such as social media and search trends, weather forecasts, local events and mobility indices. At Kraft Heinz, across 7,000 SKUs, o9 reports an 11% increase in monthly forecast accuracy and 14% in weekly.
Key features
- Demand Sensing: hourly or shift-level sensing for fresh food and bakery, on top of daily store-item-channel forecasts.
- AI powered baseline: statistical models plus machine learning models that pick out leading indicators such as pricing, weather and promotions to improve forecast accuracy.
- Collaborative demand planning for global supply chains: each function plans at customer, market, revenue or SKU-location level, and o9 reconciles the inputs automatically.
- One shared demand signal for Sales, Marketing, Finance and Supply Chain, which unifies collaborative forecasting into a single consensus forecast.
- Replacement path for SAP APO: AB InBev moved off it onto o9.
Pricing
o9 prices by quote after a demo request, and its solution architecture rests on configurable building blocks with industry specific templates. Wiring every external signal in is easier said than done, since G2 reviewers name data integration as the hardest part.
Pros
- The only top-three vendor with a named-customer accuracy gain: 11 points monthly, 14 weekly at Kraft Heinz.
- Leader in both 2026 Gartner supply chain planning reports.
- Intraday sensing fed by mobility indices and search trends.
Cons
- 19 G2 reviews at 4.2 out of 5.
- Reviewers report data integration as difficult without a strong implementation partner.
- A 2024 G2 reviewer lists cost, customization limits and slow loading on large datasets.
"The downside is that integrating it with the existing data sources is really difficult. One needs a really excellent system implementor to ensure that all the data is correctly and accurately brought into the o9 systems."
G2 review, verified user in consumer goods, enterprise (1,000+ employees), December 2022.
The same reviewer's upside: "We now complete the demand planning process faster and with more efficiency and accuracy."
Why it's ranked #1. o9 pairs Leader status in both 2026 Gartner planning reports with a named-customer accuracy gain, 11 points monthly at Kraft Heinz. Kinaxis at #2 backs its 22.6% error cut with a lab benchmark only.
Kinaxis
Best fit
Discrete and process manufacturers that want demand, supply and inventory plans recalculated together the moment one input changes.
Kinaxis, listed on the TSX as KXS, reported $548.0 million in 2025 revenue, up 13%, with ARR of $433 million, up 20%. Its Maestro platform runs demand planning next to supply and inventory planning. Our Kinaxis review covers the financials in full.
Its documented demand sensing horizon is 0 to 2 months, with forecasts typically updated daily. Its own accuracy figure comes from research into how AI can improve forecast accuracy. Using Google DeepMind's AlphaEvolve, a benchmark cut forecast error by up to 22.6% and runtime by 90.5%, which Kinaxis labels early research.
Key features
- Maestro concurrent planning, which recalculates the entire supply chain when demand, supply or inventory changes.
- ML demand forecasting blending seasonality and product attributes with POS, promotions and weather.
- Demand sensing on a 0 to 2 month horizon, refreshed daily or hourly.
- Pre-built SAP templates, plus Oracle and Salesforce integration.
- Planning One for mid-market buyers moving off Excel.
Pricing
Pricing is by quote. The RapidStart programme promises a path to transformation in 12 weeks, backed by 200+ deployments and 600+ certified consultants.
Pros
- Leader in both 2026 reports, highest on Ability to Execute and furthest on Completeness of Vision in Discrete.
- Published sensing horizon and refresh cadence.
- Audited public financials, with 17% SaaS revenue growth in 2025.
Cons
- The only accuracy figure is a lab benchmark, so the jury's still out on production results.
- 13 G2 reviews at 4 out of 5.
- Capterra reviewers describe manual work and an interface that looks like Excel without Excel's functions.
"Although it looks like an Excel spreadsheet, however, it will not give you the functionalities that Excel can so do not use Excel commands on it as most of them might not work."
Capterra review, Adnan B., supply chain planner, wholesale, 1,001 to 5,000 employees, April 2022.
A 2017 Capterra reviewer puts the time saving in numbers: "Earlier I used to take 2 days to prepare some complex reports and with the help of rapid response, I was able to do that within 1 or 2 hours."
Why it's ranked #2. Gartner put Kinaxis highest on execution in the 2026 Discrete report and a Leader in Process, beating Blue Yonder's Visionary slot there. Its 22.6% accuracy gain comes from a lab, where o9 names Kraft Heinz.
Blue Yonder
Best fit
Retailers, consumer goods makers and distributors that want probabilistic forecasts at SKU-location level with promotion, event and weather inputs.
Panasonic paid $5.6 billion for the remaining 80% of Blue Yonder, an acquisition value of $7.1 billion including debt, when the former JDA Software counted more than 3,000 customers. Our Blue Yonder review covers the rest of the suite.
Blue Yonder's demand planning page states a 12% improvement in forecast accuracy with no customer named, and talk is cheap until a customer's name sits next to a number. The product automates item-level plans with probabilistic forecasts, and its statistical forecasting selects the best model for every SKU-location combination.
Key features
- Probabilistic, item-level forecasts that route planners to exceptions.
- Automatic model selection per SKU-location.
- Intraday and short-term demand sensing, with promotion and event modelling.
- External signals including weather, local events and macroeconomic shifts.
- Collaborative demand planning for consensus forecasts, plus demand and supply planning on the same platform.
Pricing
Blue Yonder prices by quote. G2 users rate its supply chain planning suite 4.1 out of 5 across 55 reviews.
Pros
- Documented probabilistic forecasting.
- Leader in the 2026 Discrete Industries report.
- More than 3,000 customers behind the product.
Cons
- The 12% claim carries no customer or baseline.
- Visionary, outside the Leaders quadrant, in the 2026 Process Industries report.
- G2 reviewers report releases breaking existing configurations and a steep learning curve.
"New releases sometimes break the existing solution atleast the outliers. Support is not the most tech savvy or customer understanding team. Any deviation from scheduled runs causes unexpected issues upon manual re-runs."
G2 review, verified user in consumer goods, enterprise (1,000+ employees), December 2025.
Why it's ranked #3. Blue Yonder's probabilistic engine and 2026 Discrete Leader slot beat RELEX, whose latest Leader release covers 2025. Kinaxis leads both 2026 reports, and Blue Yonder's 12% claim names no customer.
RELEX Solutions
Best fit
Grocery and fresh-food retailers, and the manufacturers supplying them, who need SKU-store-day forecasts with weather, promotions and cannibalisation built in.
RELEX was founded in 2005 by Mikko Kärkkäinen, Johanna Småros and Michael Falck and lists 600+ customers and 2,300 employees. Blackstone Growth led a €500 million round at a €5 billion valuation in February 2022.
The engine automates ML-based forecasting at SKU/day granularity, updates forecasts daily and aggregates up to a 24-month horizon. RELEX's headline figures are up to 99% forecast accuracy, 85% fewer stock-outs and 30% less inventory, all stated as ceilings.
Key features
- Probabilistic, AI-based modelling that turns demand uncertainty into automated actions.
- Built-in feed from a global weather data provider covering temperature, rainfall and wind, so the ice-cream order gets planned come rain or shine.
- Promotions, POS data, cannibalisation and halo effects as forecast inputs.
- Accuracy tracking in MAE, WAPE and bias.
- Integrations with SAP, Oracle, Microsoft Dynamics, Visma, IFS, AS400, Databricks and Snowflake. One SAP Connector rollout reached production data flows in 5 weeks.
Pricing
RELEX prices by quote. Capterra lists 12 reviews at 4.6 out of 5, a thin sample for a vendor with 600+ customers.
Pros
- The most detailed engine spec on this list: SKU-day grain, daily refresh, 24-month horizon, three named error metrics.
- Weather data comes built in.
- A 2017 Capterra reviewer reports ordering and analysis time cut by more than half.
Cons
- The SAP Connector doesn't support S/4 public cloud (GROW) or ECC versions older than EHP8.
- The 99% and 85% figures are ceilings with no baseline, a red flag for any business case built on them.
- RELEX's latest Gartner Leader release covers the 2025 report.
"some of the modules of functionality appear to be designed as 'stand alone' with independent supporting interfaces. This means that you'll sometimes have to send the same data multiple times."
Capterra review, verified reviewer, project manager, supermarkets, August 2020.
On the plus side, a replenishment analyst in food and beverages wrote in 2017: "Cut order and analysis time by more than 50%."
Why it's ranked #4. RELEX documents probabilistic SKU-day forecasts refreshed daily over 24 months, a deeper spec than SAP IBP's 4-to-8-week sensing window. Blue Yonder holds a 2026 Gartner Leader slot, and RELEX's latest Leader release covers 2025.
SAP Integrated Business Planning
Best fit
SAP S/4HANA shops that want demand planning, S&OP and inventory planning inside SAP's cloud, with an Excel add-in as the front end.
More than 1,000 companies use SAP IBP, which runs on SAP HANA and combines S&OP, forecasting and demand, response and supply, demand-driven replenishment and inventory planning. Our SAP IBP review tracks the product separately.
SAP's training course lists about 20 forecasting algorithms, including gradient boosting, XGBoost and ARIMAX/MLR, with price, promotion calendars and events as drivers. SLB raised forecast accuracy to around 90% with IBP, saving $1 billion in inventory and cutting days inventory outstanding by 37%.
Key features
- Demand sensing at product-location-customer level and daily granularity, over a four to eight week window.
- Full sensing runs weekly, with a daily update run.
- About 20 statistical and machine learning algorithms.
- Excel add-in for planners who work in spreadsheets.
- S&OP, response and supply planning, and demand-driven replenishment modules.
Pricing
SAP prices IBP by quote, and buyers who bite the bullet on the rollout get demand planning inside S/4HANA's own master data. G2 users report an average 7 months to implement, the longest figure on this page.
Pros
- Named-customer accuracy: SLB at about 90%.
- 302 G2 reviews at 4.3 out of 5, the second-deepest review base here.
- Native fit with S/4HANA master data.
Cons
- Model configuration needs specialist skills, per a September 2026 G2 reviewer.
- Seven-month average rollout.
- SAP's August 2026 Gartner release covers Supply Chain Management Suites, a different report from supply chain planning.
"Configuring planning models, key figures, and disaggregation rules requires deep specialized expertise, which makes system maintenance heavy and initial implementation slow compared to modern, agile data platforms."
G2 review, verified user in financial services, small business, September 2026.
"SAP designed IBP with an Excel add-in user interface. Planners who spent decades working in spreadsheets find the transition highly intuitive because they can view and manipulate live cloud data using familiar Excel formulas and formatting."
G2 review, James K., GenAI specialist, small business, September 2026.
Why it's ranked #5. SLB's named 90% accuracy and a documented daily sensing grain beat Anaplan's Challenger rating and 500-data-point forecast cap. RELEX adds documented probabilistic output across a 24-month horizon.
Anaplan
Best fit
Finance-led planning teams that want demand forecasts inside the same connected planning model as budgets, headcount and revenue targets.
Thoma Bravo completed its take-private of Anaplan on 22 June 2022 at $63.75 a share, about $10.4 billion. Anaplan lists 2,800+ customers and runs on its Hyperblock in-memory engine, which combines spreadsheet cell flexibility, relational database scale and multidimensional cube aggregation.
Anaplan Forecaster lists 12 algorithms, from ETS and SARIMAX to Prophet, DeepAR, LightGBM and TimesFM, with the last three on the advanced tier only. Wright Medical lifted forecast accuracy from 60% to over 85%, per Anaplan.
Key features
- Forecaster can forecast demand at daily, weekly, monthly or yearly frequency, with related data for what-if scenarios.
- PlanIQ probabilistic output at P10, P50 and P90 by default.
- Demand sensing on point-of-sale, e-commerce, social media and economic data.
- Demand Planning app, Collaborative Demand Planning, Trade Promotion Management and integrated business planning in one connected planning model.
- London Gatwick forecasts at 95% accuracy three weeks out, in two and a half days per cycle.
Pricing
Vendr's anonymised buyer data puts the median Anaplan contract at $114,609 a year across 67 purchases, with a low of $30,590 and a high of $301,931. G2 users report 6 months to implement on average.
Pros
- The only ranked vendor with a Vendr median, so a buyer is up to speed on the likely price before the first call.
- 480 G2 reviews at 4.6 out of 5, the deepest review base here.
- Quantile outputs for safety stock work.
Cons
- Challenger in both 2026 Gartner reports.
- Forecaster caps output at 500 data points for every algorithm except Prophet and MVLR.
- G2 tags Anaplan "Expensive" 24 times.
"Scenario modelling UX is the biggest gap - planners still can't fluidly compare alternative demand or supply assumptions without custom NUX page engineering."
G2 review, Aswathy G., Anaplan specialist, enterprise (1,000+ employees), September 2026.
The same reviewer credits the engine: "The calculation engine handles complex driver-based forecasting across multiple countries in one model."
Why it's ranked #6. Quantile outputs and a public $114,609 Vendr median beat Logility's thinner engine documentation. Gartner rated Anaplan a Challenger in both 2026 reports, and SAP IBP backs a named 90% result with a documented daily sensing window.
Logility (Aptean)
Best fit
Manufacturers and distributors that want driver-based forecasting from a 2026 Gartner Leader, with AI agents a planner can run with or without review.
Logility flies under the radar next to o9 and Kinaxis, yet it holds the same two Gartner Leader slots. Aptean completed its Logility acquisition on 4 April 2025 at $14.30 a share in cash, adding over 500 clients in 80 countries. In March 2026, Logility was one of only four vendors named a Leader in both Gartner supply chain planning reports.
DemandAI+ runs AI-first, driver-based forecasting on promotions, events, seasonality and trends. SERAX used it to improve forecast accuracy, reporting forecast error down by over 20%, and Logility's demand sensing page claims up to 30% lower error using orders, channel inventory, sell-out and POS data.
Key features
- AI driven demand planning with automated anomaly detection: DemandAI+ flags anomalies in historical demand for planners to tag as exceptional events.
- DemandAI+ agents on Aptean AppCentral, released April 2026: Review Forecast Accuracy, Retrieve History or Forecast, Detect Trends in Historical Data, Training Opportunities.
- Demand Sensing on sell-out and POS.
- InventoryAI+, multi-echelon inventory optimization and S&OP modules.
Pricing
Logility prices by quote. G2 lists 131 reviews at 4.2 out of 5.
Pros
- Leader in both 2026 Gartner reports.
- Named-customer error reduction: SERAX, over 20%.
- Reviewers credit its what-if scenario planning.
Cons
- Public engine documentation stops at inputs: orders, channel inventory, sell-out and POS.
- A 2026 G2 reviewer calls the interface outdated and slow on large datasets.
- Product delivery is moving onto Aptean's AppCentral after the take-private.
"The 'what-if' scenario planning feature stands out to me, allowing us to simulate disruptions and instantly view the financial impact, which saves time, money, and stress."
G2 review, Vimal G., enterprise (1,000+ employees), July 2026.
"I find the user interface to be outdated, which makes navigation feel old-fashioned and clunky, slowing down my daily work. The performance can lag when processing massive datasets, making the system noticeably slow and taking a long time to load."
Same G2 review, July 2026.
Why it's ranked #7. Two 2026 Gartner Leader slots and SERAX's named 20% error cut beat ToolsGroup's inclusion-only placement. Anaplan backs its engine with documented P10 to P90 quantiles and a $114,609 Vendr median.
ToolsGroup
Best fit
Distributors and manufacturers with long-tail, intermittent or lumpy demand who want probabilistic forecasting wired straight into inventory optimization.
ToolsGroup lists 400+ customers in 45+ countries and is backed by Accel-KKR. In 2026 it folded SO99+, JustEnough and Evo into one platform called Decion, so review sites still list the product under its old names.
The engine models uncertainty directly with probabilistic forecasting. A SKU that sells a few units a quarter is a needle in a haystack for a point forecast, and a distribution sets its safety stock from the spread.
ToolsGroup's demand forecasting page claims a 5 to 15 point accuracy gain with AI forecasting, 40 to 50% better forecastability of long-tail SKUs and a 40 to 90% cut in demand planning workload through automation. The same page claims 10 to 15% fewer lost sales.
Key features
- Probabilistic forecasting across intermittent, seasonal and promotion-driven demand, which ToolsGroup says improves inventory decisions and service levels.
- Real-time demand sensing and adaptive forecasting.
- Multi-echelon inventory optimization and replenishment.
- Integrations with SAP, Oracle and Microsoft Dynamics.
Pricing
ToolsGroup says Decion pricing is structured around capabilities, scope, users, integrations and implementation requirements, quoted per customer. Capterra lists SO99+ at 4.3 out of 5 from 13 reviews.
Pros
- Probabilistic engine built for long-tail SKUs.
- Workflow automation that aligns demand, supply and inventory decisions across teams, the vendor's route to touchless demand planning on stable items.
- A 2026 Capterra reviewer reports daily forecast and replenishment recalculation.
Cons
- 2026 Gartner inclusion in the Discrete report, with no quadrant named.
- The accuracy and workload ranges carry no baseline.
- Upgrades on customised on-premise versions run slow.
"Our version is old, v 840 on premise. Upgrade is complex and hard, due to lot customization implemented by our consultants in order to adjust data in SO99 convenient format. Therefore upgrade are slow, and we wait long for new functionalities."
Capterra review, senior business analyst, retail, May 2026.
The same reviewer is otherwise positive: "We are satisfied overall, while we have pretty good forecast accuracy, with orders from the SO99 exported every day, on time."
Why it's ranked #8. ToolsGroup's probabilistic engine and 40 to 50% long-tail gain beat Netstock's weekly and monthly buckets. Logility names a customer, SERAX, and holds two 2026 Gartner Leader slots to ToolsGroup's single inclusion.
Netstock
Best fit
Small and mid-size distributors and manufacturers on NetSuite, Sage, Acumatica, Microsoft Dynamics or SAP Business One who want forecasting and replenishment live within a quarter.
Netstock lists 2,400+ customers, 20,000 users and $25 billion of inventory managed across 67 countries. It bought Demand Works, an S&OP vendor, in May 2022, which took the combined customer count past 2,100 at the time.
Netstock automatically assigns the best demand forecasting model to each item, customer and region. Its Demand Planning add-on forecasts in monthly or weekly buckets and supports bottom-up, top-down and middle-out planning.
Key features
- ERP connectors including NetSuite, Sage, Acumatica, Microsoft Dynamics, SAP Business One, SYSPRO, Epicor and Oracle E-Business Suite.
- Safety stock and ABC classification.
- Suggested purchase orders and supplier performance tracking.
- Executive dashboard and AI Opportunities alerts.
Pricing
A small distributor can get the ball rolling without a six-figure budget. Netstock's pricing page states pricing starts at $900 a month on an annual subscription, with implementation typically taking 6 to 10 weeks. It connects to more than 60 ERPs. Bundles above the entry price go to a custom quote.
Pros
- The only published starting price among the ten.
- 6 to 10 week implementation, the shortest full-rollout figure stated here.
- Capterra rating of 4.8 from 75 reviews, and 4.6 from 180 on G2.
Cons
- Reviewers report data running a day behind their ERP.
- Forecasts come in weekly or monthly buckets.
- Annual contracts only.
"being 1 day behind our ERP, has been a challenge in the scheduling of our processes, as well as having to wait for changes to update"
Capterra review, Chad H., replenishment manager, wholesale, 51 to 200 employees, December 2025.
A buyer in automotive wrote the other side: "The forecasting and easy visibility for stocked out and potential stocked out items has been a major benefit for our company."
Why it's ranked #9. Netstock's published $900 a month floor and 6 to 10 week rollout beat GMDH Streamline's quote-only pricing. ToolsGroup documents probabilistic forecasting, where Netstock forecasts in weekly or monthly buckets.
GMDH Streamline
Best fit
Small manufacturers, wholesalers and retailers that want automatic model selection and an ordering plan from 30+ ERP connectors, QuickBooks included.
GMDH sells Streamline to 2,000+ brands and connects it to 30+ ERPs including NetSuite, SAP, Microsoft Dynamics 365 Business Central and QuickBooks. G2 lists 263 reviews at 4.4 out of 5.
Streamline matches each item to its forecasting model by its own demand pattern and scores accuracy in APE, MAPE, SMAPE and weighted MAPE. A coffee distributor on that page reports over 82% forecast accuracy and reduced inventory while maintaining service levels, and the homepage claims 90% fewer stockouts and 35% less overstock.
Key features
- Demand sensing that adjusts for customer demand hidden behind stockouts.
- Promotion planning with expected uplift and required inventory.
- New product forecasts that borrow demand patterns from comparable items.
- Accuracy dashboards across products, categories and periods.
Pricing
Streamline prices by quote through a form on its pricing page. If your ERP sits outside the 30+ list, iron out the connector work before signing.
Pros
- 263 G2 reviews, the third-largest count on this page.
- QuickBooks and Business Central connectors reach smaller buyers than the enterprise suites.
- Four named accuracy metrics built into reporting.
Cons
- Quote-only pricing.
- Capterra's 11 reviews date from 2018 to 2021.
- Without a native connector, sales data goes in by manual import.
"The software works great but the license is linked to a physical computer. So it limits f.e. the option to work from home or on the road."
Capterra review, Leendert Paul D., director, wine and spirits, June 2019.
"Now, twice per month, I spend maybe a half hour preparing the import to update it with new sales data (only because I don't have direct integration). Streamline does everything else."
Capterra review, Nicholas A., supply chain manager, business supplies, April 2020.
Why it's ranked #10. Streamline's 263 G2 reviews and 30+ ERP connectors beat Shopify-only tools such as Prediko on reach. Netstock publishes a $900 a month starting price and a 6 to 10 week rollout, where Streamline quotes privately.
What demand forecasting software does
These tools use historical data, market trends and outside signals to predict demand by item, location and period, so planners can anticipate customer orders before they land. They connect inventory, purchasing and sales, so a forecast change flows into reorder points, purchase orders and production plans the same day.
The core job is balancing the risk of too much stock against too little, which means trading inventory costs against service levels.
Lower safety stock from demand sensing, alongside 5 to 20% forecast accuracy gains, per a 2023 Kearney study Kinaxis cites.
The software also recalculates reorder points as consumption rates change and flags slow-moving products early enough to nip excess inventory in the bud. Seasonal patterns need history to show up. Anaplan recommends a forecast horizon of half the history loaded, so 24 months of data supports a 12-month forecast.
Finance uses the same output. Data-driven revenue projections feed realistic financial targets, cash flow plans and operational budgeting, and accurate forecasting sharpens promotional planning because the uplift estimate comes from the same model. Netstock says its analytics engines learn over time as new sales land, which is how accuracy improves without a planner rebuilding the model.
Demand forecasting versus demand planning and S&OP
Demand forecasting is the statistical estimate. Demand planning is the process wrapped around it: planners review the forecast, add customer insights from sales and marketing, and agree a consensus forecast the business will buy and build against.
S&OP sits one level up. A common six-step monthly cycle runs data gathering, demand review, supply review, pre-S&OP financial reconciliation, the executive meeting where sales, finance and operations get on the same page about one number, and measurement against last month's plan. Integrated business planning extends that cycle into financial plans, which is why SAP IBP and o9 carry the name.
The three layers need different tools, and effective demand planning needs the first two working together. A buyer who only needs a better statistical forecast can stop at Netstock or Streamline. A business running cross functional scenario planning across sales, finance and operations teams needs one of the enterprise demand planning platforms at the top of the list.
Key benefits of demand planning software
The key benefits land in numbers a finance team already tracks. Each figure below is the vendor's own, stated without a baseline, so treat it as a ceiling for a pilot. On RELEX's numbers, demand sensing kills two birds with one stone, cutting stock-outs and inventory at once.
- Fewer stock-outs and higher customer satisfaction: RELEX claims up to 85% fewer stock-outs.
- Lower inventory costs: RELEX claims 30% less inventory, and Kinaxis cites Kearney's 5 to 10% lower safety stock from demand sensing.
- Less manual effort: ToolsGroup claims a 40 to 90% cut in demand planning workload.
- Steady service levels on less stock: Streamline's coffee distributor cut inventory while holding service levels.
- Faster cycles: London Gatwick builds operational forecasts in two and a half days on Anaplan.
The softer benefit is alignment. A shared forecast lets finance and operations align sales targets, supply plans and budgets around one number with unified visibility, and real time inventory visibility across locations stops two teams ordering against different stock counts.
Types of demand planning tools and when each fits
The ten tools fall into four groups, and company size and operational complexity decide which group fits. A 40-person distributor buying an enterprise suite bites off more than it can chew.
- Enterprise planning suites: o9, Kinaxis, Blue Yonder, SAP IBP and Logility. Demand planning sits inside supply chain planning, S&OP and inventory optimization for complex supply chains.
- Retail and fresh specialists: RELEX. SKU-store-day forecasting with weather and store data built in.
- Connected planning platforms: Anaplan. Demand forecasts live in the same model as budgets and headcount.
- Inventory-first mid-market tools: ToolsGroup, Netstock and Streamline. Forecasts drive replenishment for distributors and manufacturers.
Shopify merchants have a fifth, cheaper option. Prediko starts at $49 a month for stores under $100,000 in annual sales, with unlimited users and SKUs and a 14-day free trial. It runs on Shopify alone, which kept it off the ranked list.
For the wider supply chain view, including disruption monitoring and supplier risk, see the supply chain risk management ranking and our decision intelligence platforms ranking. Retailers comparing POS and shelf data can start with our retail analytics software ranking.
Forecasting methods and demand signals
Demand forecasting is the predictive analytics layer of supply chain management. The advanced analytics behind it fall into five families of forecasting methods:
- Qualitative input: sales-force estimates and consensus reviews.
- Time-series models: moving average, exponential smoothing (ETS), ARIMA and SARIMAX.
- Causal regression: price, promotion and event drivers, such as SAP IBP's ARIMAX/MLR.
- Machine learning: gradient boosting, XGBoost and LightGBM.
- Deep learning and foundation models: DeepAR and TimesFM in Anaplan Forecaster.
Every vendor now pitches AI driven forecasting, and most mid-market tools automatically identify the best model per item, as Netstock and Streamline do.
Sophisticated forecasting methods such as DeepAR only pay back with enough history per item, which is why every tool above still offers simple time-series models. Probabilistic forecasting adds a layer on top. It outputs a distribution, so the gap between P50 and P90 drives the safety stock calculation directly. RELEX, Blue Yonder, ToolsGroup and Anaplan document it on their own pages.
Demand sensing handles the short end, where market volatility hits first. Real time demand signals such as point of sale data, open orders, channel inventory and weather patterns adjust the first few weeks of the forecast. o9 adds social media trends and mobility indices, and RELEX adds cannibalisation and halo effects, which catch a demand spike when a competitor's promotion or a heatwave shifts consumer trends overnight.
These demand signals let a tool react to market changes and market shifts inside the week.
External signals are only as good as the internal data underneath. Reviewers of o9, SAP IBP and Streamline all name data integration as the hard part, and the devil's in the details there. A forecast built on stock history with unflagged outages learns each outage as low demand.
What demand planning software costs
Price visibility in this category is thin. Of the ten, only Netstock publishes a starting price, and only Anaplan carries a Vendr median. Everything else goes to a quote after a demo.
The spread runs from Prediko's $49 a month for a small Shopify store to Anaplan's Vendr high of $301,931 a year.
Netstock's $900 a month, annualised before bundles, about a tenth of Anaplan's $114,609 Vendr median.
For a small team, an enterprise suite can cost an arm and a leg before a single forecast runs. Implementation is the cost most buyers underestimate. G2 users report 7 months for SAP IBP and 6 for Anaplan, against Netstock's stated 6 to 10 weeks. A seven-month rollout at an enterprise suite runs partner fees on top of the licence, so ask for the implementation quote in the same meeting as the licence quote.
Watch three contract terms. Netstock sells annual subscriptions only, a Netstock reviewer on Capterra describes a surprise rate increase, and Anaplan's advanced forecasting models sit on a higher tier than the base licence.
How to run a forecast accuracy trial
Every vendor on this list claims to improve forecast accuracy. The only way to test a claim to improve demand prediction accuracy is a backtest on your own data, scored on demand prediction accuracy per SKU group.
- Pull 24 months of weekly sales history for 50 to 200 SKUs, mixing fast movers, long-tail items and at least five promoted products.
- Hold out the last 12 weeks. Give each vendor the first 21 months and ask it to forecast demand for the holdout.
- Score every forecast in the same metrics: MAPE for readability, WAPE so high-volume items count more, and bias to catch systematic over-forecasting.
- Compare against your current method, even a spreadsheet moving average, since forecast value added is the number that justifies the spend.
- Record how many manual steps each vendor needed to load your data, a fair proxy for the manual processes and manual effort after go-live.
RELEX tracks MAE, WAPE and bias, and Streamline scores APE, MAPE, SMAPE and weighted MAPE, so both can report in the trial's own terms. Our free vendor evaluation scorecard holds the results, and the RFP response template covers the written questions.
Don't jump the gun on a vendor-run proof of concept. A vendor's data scientists tuning the model for three weeks shows what the tool can do with help. Your planners run it without that help from the first Monday after go-live.
o9 versus Kinaxis
The top two split on one axis. o9 plans at store-item-channel level with intraday sensing and external signals, and publishes a named 11-point accuracy gain. Kinaxis recalculates demand, supply and inventory concurrently, with a documented 0 to 2 month sensing window and a 12-week RapidStart.
Both were Leaders in both 2026 Gartner reports. o9 fits consumer goods and retail-facing manufacturers with volatile demand patterns, because its signal list runs to mobility indices and search trends. Kinaxis fits discrete manufacturers with complex supply chains and long bills of material, where concurrent supply response matters as much as the forecast. Both price by quote, so the ball is in your court to ask each for a like-for-like quote on the same SKU count.
Market consolidation in demand planning software
Ownership in this category changed hands fast. Panasonic paid $7.1 billion in acquisition value for Blue Yonder, Thoma Bravo spent about $10.4 billion taking Anaplan private in 2022, and Aptean bought Logility in April 2025. Thoma Bravo's $8 billion Coupa buyout followed the same private equity playbook in procurement.
The independents raised at high marks. o9 hit a $3.7 billion valuation in 2023, and RELEX reached €5 billion in 2022. ToolsGroup bought JustEnough in 2021 and Evo in 2023, then rebranded all three as Decion in 2026.
Gartner's split into separate process and discrete reports in March 2026 is the newest change. Oracle, a Leader in both, sits outside this ranking because its planning product lives inside Fusion Cloud SCM, covered in our Oracle Fusion Cloud Supply Chain Planning review.
Demand planning software FAQ
What is the best demand planning software?
o9 Solutions ranks first here, as a Leader in both 2026 Gartner supply chain planning reports with a named 11-point monthly accuracy gain at Kraft Heinz. For small distributors, Netstock is the better buy at $900 a month.
Can AI be used for demand forecasting?
Yes. Every tool on this list uses machine learning or artificial intelligence somewhere in the forecast, ToolsGroup claims a 5 to 15 point accuracy gain from AI-driven forecasting, and Logility's DemandAI+ runs AI-driven demand planning on promotion, event and seasonality drivers. Treat any AI claim without a named customer as marketing until a backtest proves it.
What is KPI in demand planning?
The standard demand planning KPIs are forecast accuracy (as MAPE or WAPE), bias, forecast value added, and the service levels and inventory levels the forecast produces. RELEX reports in MAE, WAPE and bias out of the box.
What are some examples of SCM software?
Supply chain management software spans planning (Kinaxis, o9, SAP IBP), execution (warehouse and transport systems) and risk monitoring. Our supply market intelligence guide maps the data sources, and the retail market intelligence guide covers the store-side view.
What are the five methods of demand forecasting?
Qualitative input, time-series models, causal regression, machine learning, and deep learning or foundation models. SAP IBP's ARIMAX/MLR is a causal example, and Anaplan Forecaster's DeepAR and TimesFM sit at the deep learning end.
How much does demand forecasting software cost?
Published prices run from Prediko's $49 a month for small Shopify stores and Netstock's $900 a month for distributors to a $114,609 Vendr median for Anaplan, with a Vendr high of $301,931. Eight of the ten ranked vendors quote privately.
Is demand planning the same as forecasting?
They're two layers of one process. Forecasting produces the statistical number. Demand planning adds sales input, promotions and a consensus review, and turns the number into a plan the business commits to.
Bottom line
o9 Solutions wins for global consumer goods and manufacturing teams that want intraday demand sensing, collaborative demand planning and a named accuracy result, and Kinaxis wins where supply response matters as much as the forecast. Blue Yonder and RELEX are the retail picks, with RELEX ahead for fresh food and weather-driven categories.
SAP IBP is the default for S/4HANA shops willing to wait seven months, and Anaplan suits finance-led teams who want forecasts inside the budget model at a $114,609 median. Logility and ToolsGroup fill the gap for manufacturers who want a probabilistic or driver-based engine without an o9-sized project.
For small and mid-size distributors, Netstock at $900 a month is the only tool here with a price you can see before the call, and Streamline is the pick for QuickBooks and Business Central shops.