
The numbers Business intelligence software, checked 8 September 2026
Five houses publish five different 2025 estimates for the business intelligence market, from $34.82 billion to $72.1 billion. Some forecast a market; one measures deployed spend directly.
Cloud already carries roughly two-thirds of business intelligence revenue, and the on-premises third concentrates in regulated industries that keep customer data on their own servers.
Microsoft's Power BI leads every published install count, inside a market consolidating around three cloud vendors that each bundle business intelligence with the infrastructure it runs on.
Check which measurement method produced a figure, a forecast model or technographic detection, before comparing it to a number from a different house.
I'll write a 2,500+ word report on the slice of BI you name, with every estimate traced to its publisher. Yours to publish, from $200.
The business intelligence market in numbers
Every published figure for the business intelligence market answers a slightly different question. Precedence Research and Mordor Intelligence forecast the software-and-services market forward a decade. HG Insights measures what companies have already deployed. That distinction explains more of the gap between $43.48 billion and $72.1 billion than any real disagreement about the size of the business intelligence industry.
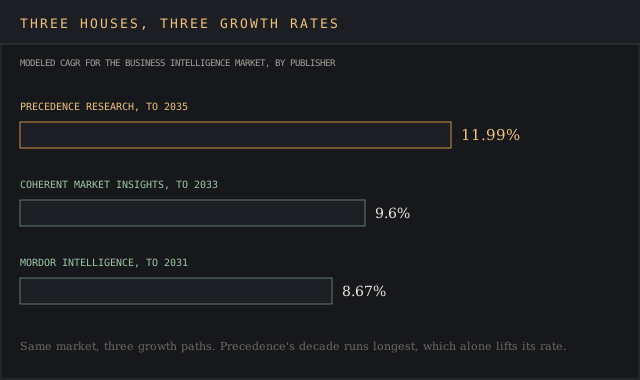
Mordor Intelligence puts 2026 revenue at $41.16 billion, growing at a CAGR of 8.67% to $62.38 billion by 2031. Coherent Market Insights runs a wider band: $50.4 billion in 2026 climbing to $95.8 billion by 2033, a 9.6% CAGR. The three forecasters diverge on the base year, the scope, and the growth rate alike, and a buyer who reads only one headline figure on the business intelligence market is missing the other two entirely.
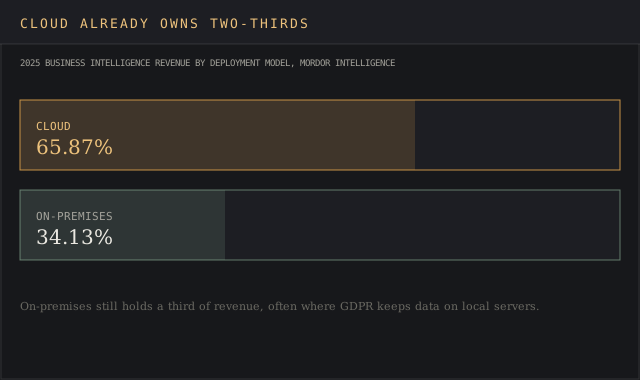
Cloud deployment is the one number where the houses agree almost exactly. Mordor Intelligence puts cloud's share of 2025 business intelligence revenue at 65.87%, and it's growing. A buyer who wants to stay ahead of the curve on where BI spend is headed should watch the cloud share more closely than the total market number.
Every base-year estimate in this report was published in 2026, within an eight-month window; Precedence Research's carries the newest update date, 12 Aug 2026.
What a business intelligence (BI) platform does
Business intelligence turns raw data into actionable insights, the framing Google Cloud and Splunk both use for it. A business intelligence tool has to turn raw data into something a manager can act on inside today's decision window. Splunk's Austin Chia, writing in January 2025, breaks a business intelligence system into five working parts: data mining and analytics, data warehousing, data reporting, data visualisation, and data integration.
Data warehousing centralizes what data mining finds inside a company's business data, storing structured, semi-structured, and unstructured data side by side, pulled from existing systems that used to sit apart.
Data integration connects those existing systems, CRM records, financial software, supply chain databases, before any of it reaches a dashboard, through API-based methods, batch ETL, or data virtualization that enables users to query live data without moving it first.
Google Cloud sorts business intelligence tools into three categories: on-premises, open source, and cloud-based. Cloud-based tools handle streaming data and large data volumes without the buyer managing the infrastructure. Mordor Intelligence credits that ease for pulling 65.87% of 2025 business intelligence revenue into the cloud already.
Self-service analytics get a new hire up to speed on the numbers without waiting on a data team, and the analytics platforms built for that job increasingly generate insights and automated insights on their own. Some buyers skip the build entirely and pay for managed services instead, hiring no internal team at all.
Why the published estimates diverge
The five houses disagree because they measure different things, and the table below names each one so a reader can trace a business intelligence market figure back to its source.
| Publisher | Base-year estimate | Forecast | CAGR |
|---|---|---|---|
| Precedence Research | $43.48B (2025) | $134.94B by 2035 | 11.99% |
| Mordor Intelligence | $41.16B (2026) | $62.38B by 2031 | 8.67% |
| Fortune Business Insights | $34.82B (2025) | $72.21B by 2034 | Not published |
| Coherent Market Insights | $50.4B (2026) | $95.8B by 2033 | 9.6% |
| HG Insights | $72.1B (deployed spend) | Not a forecast | Not applicable |
Copy these lines into an email, fill them in and send. I reply with scope and a price within 2 to 3 business days.
Open the emailPrecedence Research
$43.48 billion in 2025, reaching $134.94 billion by 2035 at an 11.99% CAGR. The report names Microsoft, Salesforce, Google Cloud, Amazon Web Services, Oracle, and QlikTech International as market leaders in business intelligence platforms.
Mordor Intelligence
$41.16 billion in 2026, growing to $62.38 billion by 2031. Mordor's own regional notes tie part of Europe's on-premises holdout directly to GDPR's limits on where customer data can physically sit.
Fortune Business Insights
$34.82 billion in 2025, the lowest of the five, reaching $72.21 billion by 2034. Precedence Research and Fortune Business Insights price the same 2025 base year $8.66 billion apart on the business intelligence market, mostly on scope and geography definitions.
Coherent Market Insights
$50.4 billion in 2026, climbing to $95.8 billion by 2033. Coherent names its own report "Business Intelligence & Analytics," a wider scope than "business intelligence" alone, which explains why its figure runs above the other forecasters.
HG Insights
$72.1 billion in company spend on business intelligence software over the next 12 months. HG Insights isn't forecasting anything: it counts detected software installations across companies with a registered address and multiplies by category spending patterns, a live figure standing apart from any 2031 or 2035 projection.
Reading the spread
A buyer who reads between the lines of each report's methodology page finds the real reason two business intelligence market numbers can differ by $37 billion: a forecast model answers how big the addressable market will get, and a technographic model like HG Insights' answers how much is being spent today. Neither is wrong; they answer different questions about the same business intelligence market.
Market segmentation by deployment, component, and enterprise size
Want a cloud versus on-premises split like this for your category? Send the market and the years.
Email a briefDeployment
Cloud computing carried 65.87% of 2025 business intelligence revenue, per Mordor Intelligence, with on-premises deployment holding the rest in industries that keep regulated data on their own servers. The General Data Protection Regulation shapes some of that split directly: Mordor Intelligence ties part of Europe's on-premises holdout to GDPR's limits on where customer data can sit, a regulatory driver on top of ordinary legacy habit.
Enterprise size
Precedence Research's report shows large enterprises holding the biggest revenue share through 2035, while small and medium enterprises grow fastest by rate off a smaller dollar base. A small business buying its first business intelligence seat doesn't stand on a level playing field with a Fortune 500 buyer running a six-figure Power BI or Tableau contract; it just grows off a smaller base, faster.
For a side-by-side look at how Power BI, Tableau, Qlik Sense and the other general-purpose platforms stack up on pricing and features, see our data analysis tools ranking.
Which sectors spend most
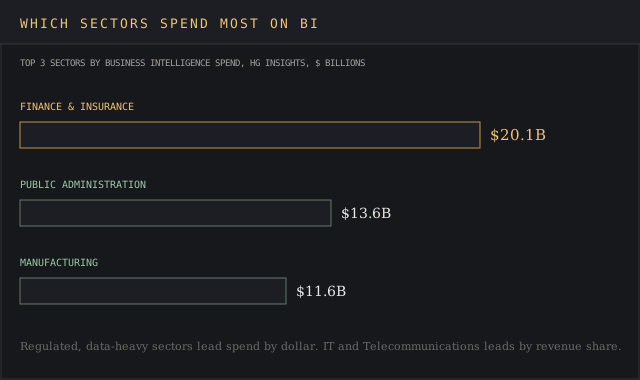
Financial institutions in the Finance & Insurance category lead business intelligence spend by dollar, $20.1 billion according to HG Insights, followed by Public Administration at $13.6 billion and manufacturing sectors at $11.6 billion. IT and Telecommunications contributed over 26% of 2025 global revenue by Precedence Research's count, the single largest end-user share in its own segmentation.
Regional breakdown
North America
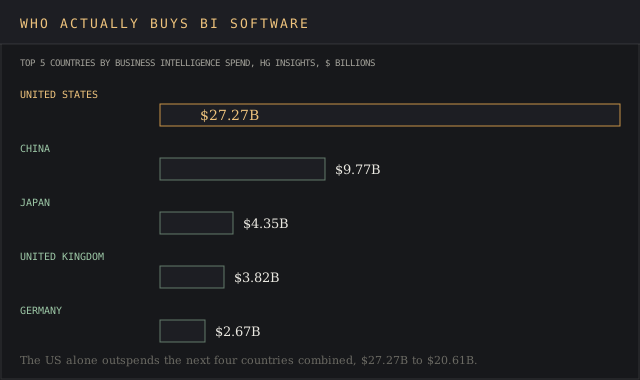
North America calls the shots in the business intelligence market. Mordor Intelligence puts the region's 2025 revenue share at 39.85%. HG Insights, which measures current spend and not accounting revenue, puts the AMER region's share of global business intelligence spend at 43%. The United States alone runs 4,356,643 companies spending a combined $27.27 billion on BI software, per HG Insights, 2.8 times China's $9.77 billion.
- The BI segment, region or vendor list to cover
- Regions, years and segments
- Where it runs: blog, white-label, gated or lead magnet
- Whose byline goes on it
- Deadline
- 2,500+ words, human-written
- Every figure linked to its source
- Yours to publish, under your name or none
- Hosting here for +$200, with your sponsored links
Asia Pacific
Asia Pacific is the region every forecaster tags as fastest-growing for business intelligence, even where they disagree on the base number. Mordor Intelligence has the region compounding at 10.12% through 2031.
Europe
Precedence Research's regional notes name Germany as Europe's largest single business intelligence market, driven by industrial digitalization, automation, and predictive maintenance across the country's automotive and engineering sectors. A vendor selling business intelligence software into Europe should keep an eye on Germany specifically.
Middle East
Precedence Research also names Saudi Arabia as the largest single business intelligence market in the Middle East, tied to the country's Vision 2030 push into AI-supported analytics across financial services, healthcare, and retail.
Major vendors and their scale
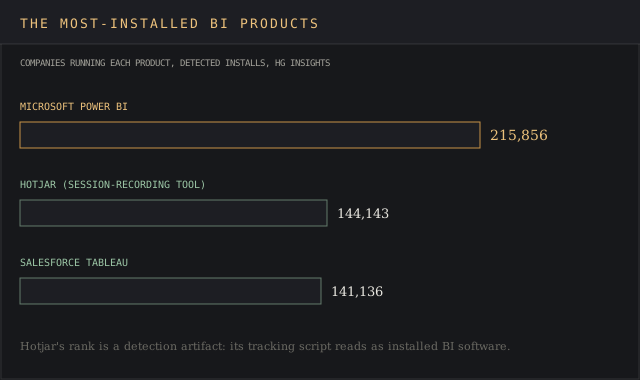
Precedence Research names Microsoft, Salesforce (Tableau), Google Cloud, Amazon Web Services, Oracle, and QlikTech International as market leaders in business intelligence platforms, alongside SAP. HG Insights confirms the install picture from the buyer side: Microsoft's Power BI runs inside 215,856 companies, ahead of every other named product it tracks, giving it a clear market share lead by install count.
Several of those same vendors, including Qlik and SAP, also show up on our predictive intelligence software ranking, which scores their forecasting and modeling capabilities specifically.
| Vendor | Flagship product | Ownership or origin | Notable detail |
|---|---|---|---|
| Microsoft | Power BI | Public company | 215,856 installs, the most of any BI product |
| Salesforce | Tableau software | Acquired Tableau in 2019 | 141,136 installs tracked by HG Insights |
| Google Cloud | Looker | Google Cloud product line | Data modeling, a database layer, and embedded analytics |
| Amazon Web Services | Amazon QuickSight | AWS product line | Usage-based pricing inside the AWS console |
| Oracle | Oracle Analytics Cloud | Bundled with Oracle's cloud stack | Enterprise reporting plus AI-supported insights |
| QlikTech International | Qlik Sense, Qlik Cloud Analytics | Headquartered in Sweden | Self-service analytics and integration |
| SAP | SAP Analytics Cloud | Public company | Named a leader by Precedence and Mordor |
The fourth-largest business intelligence product tracked by HG Insights isn't a single vendor at all. It's the combined installs of every open-source BI tool the platform detects, ahead of any single named commercial product outside the top three.
Hotjar, better known as a website heatmap and session-recording tool, shows up as HG Insights' second-most-installed BI product at 144,143 installs, ahead of Tableau's 141,136, because HG's technology-detection method classifies Hotjar's tracking scripts inside the same BI category it uses for dashboard platforms like Power BI.
HG Insights counts 144,143 Hotjar installs in its BI category, ahead of Tableau's 141,136, because its detection method files Hotjar's tracking scripts alongside Power BI.
Hotjar installs HG Insights files under BI
Source: HG Insightse.g. installed base of the tools your buyers compare
Source: linked, checked, datedGrowth drivers
AI integration
Rising demand for data driven decision making is the growth driver Precedence Research names first for the business intelligence market, alongside growing business data volumes, rapid cloud adoption, and artificial intelligence integration. Omdia's October 2025 survey found 41% of organizations already run AI as part of their analytics process.
A separate Omdia survey from May 2025 found that 72% of organizations running AI-powered analytics said the resulting insights directly informed over 25% of their key business decisions.
Cloud adoption
Cloud adoption keeps pushing the envelope on what counts as core business intelligence infrastructure. Precedence Research credits cloud and big data integration for lowering the entry cost of running BI without an internal server team, part of why the cloud deployment segment keeps growing through 2035 while on-premises holds a shrinking, but still real, share.
Real-time demand
Streaming dashboards and self-service analytics deliver real-time insights that let non-technical staff build a report without waiting on IT, a feature Microsoft, Google Cloud, and AWS all sell today inside Power BI, Looker, and Amazon QuickSight respectively. All three vendors rent out the underlying cloud infrastructure their own business intelligence platforms run on, bundling compute cost into the platform fee.
Constraints on adoption
Cost
Cost is the constraint every house names, and Precedence Research is specific about where it bites: consulting, specialized IT staff, and dedicated data-science hires drive the up-front price of business intelligence software past what many small and medium enterprises can justify without a proven return.
Skills gap and integration
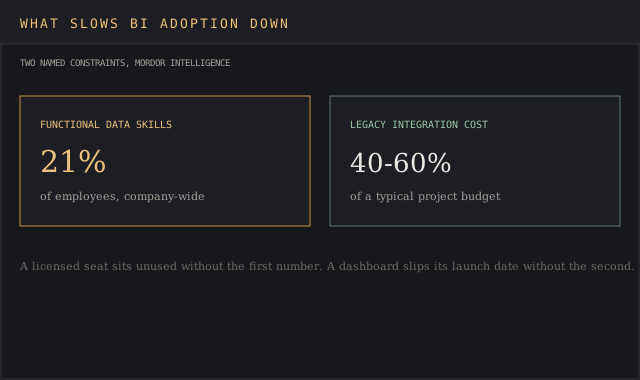
Mordor Intelligence and Coherent Market Insights both point to the same skills gap from different angles. Mordor's report states that only 21% of employees possess functional data skills, which limits how much of a licensed business intelligence seat count gets used. Integration with legacy systems consumes 40% to 60% of a typical BI project's budget by Mordor's estimate.
A team that cuts corners on that integration work to hit a launch date usually pays for it later, in a dashboard nobody trusts.
Data quality
TechTarget's Tom Walat, writing in May 2026, frames data quality as the constraint AI no longer lets organizations defer. Poor inputs now propagate into automated business intelligence decisions faster than a human reviewer can catch them, which raises the cost of a fragmented data estate.
Technology and trends inside the platforms
Generative and agentic artificial intelligence are reshaping the business intelligence software product line faster than any single forecast captures. TechTarget reports that 41% of organizations already fold AI into their data analytics process, and BI vendors are splitting their roadmaps into two tracks: static reporting and KPI monitoring on one side, workflow-embedded systems that surface an answer inside the tool where a decision happens on the other.
Machine learning now sits underneath most analytics platforms sold as business intelligence solutions, the same predictive layer Oracle already lists as a named Oracle Analytics Cloud capability, and the same category decision intelligence platforms and revenue intelligence software increasingly overlap with.
Precedence Research's own vendor profiles confirm the pattern: Microsoft lists AI-assisted analytics as a named Power BI capability, and Oracle lists AI-supported insights inside Oracle Analytics Cloud and SAP Analytics Cloud alike. Process mining now has its own Gartner Magic Quadrant, for process intelligence platforms, and our process intelligence software ranking covers those tools.
How the market gets tracked
Every figure in this report comes from one of two measurement methods. Precedence Research, Mordor Intelligence, Fortune Business Insights, and Coherent Market Insights all build a forward-looking model: survey data, vendor interviews, and public filings feed a forecast that projects a base year forward, typically a decade.
HG Insights runs a second method, technographic detection, the same approach behind our technographic data providers ranking. Its platform scans for BI software running inside a company's public-facing technology stack, tags the company by size and industry, and multiplies detected installs by an estimated per-seat cost to produce a figure for money already spent this year.
Neither method is wrong; they answer different questions about the same business intelligence market.
What the forecasts leave out
None of the five reports puts a number on shadow AI, the practice TechTarget documents of employees feeding company data into unsanctioned AI chatbots when the sanctioned BI tool feels too slow to answer a question. Shadow AI use spreads under the radar of every named market-tracking method in this report, HG Insights' technographic scans included, because none of them is built to detect an employee pasting company data into a personal chatbot account.
The forecasts also skip the two-track split TechTarget names: static reporting is aging out of the business intelligence market's growth math even as workflow-embedded analytics absorbs spend nobody labels separately yet. None of the five houses discloses its own survey sample size or response rate, so a reader has no way to weigh Coherent Market Insights' 9.6% CAGR against Mordor Intelligence's 8.67% beyond comparing the published number itself.
Business intelligence market segmentation reference
The published business intelligence market reports segment the category several ways, reproduced here for anyone building a comparison model.
- Component: software and services (consulting, deployment, integration).
- Deployment: cloud (65.87%) and on-premises.
- Organization size: large enterprises hold the larger revenue share, small and medium enterprises grow faster off a smaller base.
- Sector: Finance & Insurance ($20.1B), Public Administration ($13.6B), and manufacturing ($11.6B) lead spend by dollar.
- Region: North America (39.85% by revenue, 43% by spend), Asia Pacific (fastest-growing), Europe, and the Middle East.
Two notes worth carrying into any model built on the business intelligence market. The services share understates services revenue, since implementation work sold by partners lands outside some houses' market size entirely. And an install count like HG Insights' measures detected technology on a company's site, which inflates any vendor whose script sits on more pages than it has actual dashboard users, exactly the trap Hotjar's ranking above falls into.
Delivered for your site and your byline. Hosting here is optional.
Frequently asked questions
Is Power BI owned by Microsoft?
Yes. Power BI is Microsoft's own business intelligence product, built and sold directly by Microsoft Corporation. HG Insights tracks it as the most-installed business intelligence software product in the market, running inside 215,856 companies.
Does business intelligence have a future?
Every published forecast says growth continues at a double-digit or near double-digit rate. Precedence Research projects an 11.99% CAGR through 2035. Coherent Market Insights projects 9.6% through 2033. Mordor Intelligence projects 8.67% through 2031. AI integration, real-time dashboards, and cloud adoption are the three drivers all three houses name.
Is business intelligence a high paying job?
It depends which salary tracker a reader trusts. Glassdoor puts the U.S. average business intelligence analyst salary at $116,630 a year. PayScale's tracked average sits far lower, at $65,271. Check which methodology produced the number before comparing it to a job offer.
Will AI replace business intelligence analysts?
TechTarget's Tom Walat, writing in May 2026, describes business intelligence splitting into two tracks: static reporting and KPI monitoring on one side, workflow-embedded analytics on the other. Human analysts still set up the governance AI needs before its output can support a real decision across business intelligence platforms industry-wide.
How does business intelligence relate to market intelligence?
Business intelligence looks inward, at a company's own operational and sales data: dashboards, KPIs, forecasts drawn from systems the company already runs. Market intelligence looks outward, at competitors, industry trends, and the wider market a company competes in. The two disciplines increasingly share a platform and a vendor, but a business intelligence tool answers "what happened in my business," while market intelligence answers "what is happening in my market."
Bottom line
Five houses price the same business intelligence market at figures from $34.82 billion to $72.1 billion for 2025. The gap comes down to methodology: a forecast model against a technographic model, both counting honestly. Our sales intelligence market report shows the same spread in a neighboring category, four houses and four different sizes, each defensible on its own definitions.
Cloud, AI integration, and real-time demand drive the market growth every report names, and North America and Microsoft's Power BI lead by whichever metric gets used to measure them. The constraints, cost, a thin data-skills pool, and legacy integration work, are just as consistent across sources as the drivers are.
A buyer sizing a business intelligence budget against this market should pick one methodology, name it, and compare like against like. Our market intelligence platform pricing report and data providers hub cover the adjacent categories a business intelligence budget usually competes against.
Sources: Precedence Research, Mordor Intelligence, Fortune Business Insights, Coherent Market Insights, HG Insights, Omdia, TechTarget, Google Cloud, Splunk, 2025 to 2026 editions.
BI vendors, data consultancies and analytics agencies use reports like this one in pitch decks and analyst briefings.
A report on your topic for a blog page, gated content or a lead magnet.
Written for your client and published under their brand, with my name left off.
Your report on marketintelligencetools.com, with 2 to 3 CTAs carrying your sponsored links.
Default terms: the report is yours to publish, and I keep the right to republish it on this site behind a gate, outside Google's index.