Technographic data providers: rankings and buying guide for 2026
 By Jan Suski. I go deep on every review, checking every number against its source and digging up details other coverage misses, a habit from six years of SEO and link building for tech companies. Bylines at Surfer, Brand24, and Senuto. How the scoring works.
· Prefer this source on Google
Quick comparison of B2B technographic data providers
Ten providers with how each collects its signals, what entry costs, and the buyer it fits.
| # | Provider | Collection method | Entry price | Best fit |
|---|---|---|---|---|
| 1 | HG Insights | Contract intelligence and spend data | $90,000 median* | Enterprise teams needing IT spend figures |
| 2 | ZoomInfo | Blended crawl, job postings, contributor network | $33,500 median* | Teams wanting technographics with contact data |
| 3 | Demandbase | Crawl plus account intelligence | $68,591 median* | ABM programmes activating on tech signals |
| 4 | BuiltWith | Website crawling | From $295 a month | Technology research and market sizing |
| 5 | Wappalyzer | Website crawling, API-first | From $250 a month | Programmatic detection inside your own product |
| 6 | Intricately | Network-level observation | Quoted | Vendors selling cloud and infrastructure |
| 7 | PredictLeads | Job postings and public event detection | 100 free credits a month, then $0.04 each | Trigger-based outbound |
| 8 | Coresignal | Multi-source, six-hour refresh | Free tier, then from $49 a month | Data teams wanting one feed |
| 9 | Cognism | Licensed and blended, GDPR-compliant | $36,000 median* | European teams with compliance exposure |
| 10 | Apollo.io | Blended, bundled into the platform | From $49 per user a month | Small teams wanting filters and outreach together |
Medians marked * are anonymized buyer-reported contract values published by Vendr. Everything else is the price the vendor publishes itself.
Technographic data describes the technology stack a company runs: CRM platforms, cloud services, marketing automation, analytics tools, security tools and the front end technologies on their website.
Firmographic data tells you a company is a 400-person software business in Berlin. Technographic data tells you it runs Salesforce, Snowflake and HubSpot, which is what decides your opening line.
Ten technographic data providers are ranked below on coverage breadth, how the signals are collected, and how fresh they stay. The data providers guide places this category against the other six.
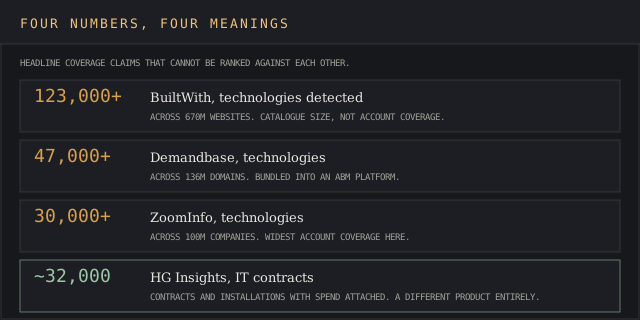
Coverage figures are vendor-reported and count technologies detected. Verified technologies are a separate, smaller number. Compare them against the twelve technologies you sell against. Comparing the vendors to each other proves nothing.
What technographic data is
Technographic data providers collect information about the technologies organisations use, then attach it to a company record. The dataset includes CRM platforms, cloud services and marketing automation tools, plus internal systems, internal tools and security tools where they can be observed.
It provides insights into software, hardware and IT systems used by businesses. Some of that is publicly visible; much of it is inferred, and that difference is what to check before trusting a coverage number.
Technographic and firmographic data compared
Firmographic data describes what a company is: industry, size, revenue, location. Technographic data describes what it runs.
Both segment target accounts, and they answer different questions. Firmographics tell you a company could buy. Technographics tell you what it would be replacing, integrating with, or outgrowing.
Combining technographic and firmographic data is where the targeting gets precise. A 200-person company running your integration partner's product is a materially better prospect than a 200-person company that is merely the right size.
How technographic data providers collect it
Providers gather technographic data from public website analysis and job postings, and providers often blend multiple data collection methods for accuracy. Sourcing methodology affects data accuracy and reliability more than coverage breadth does.
Web crawling and web technology detection
Web crawling detects publicly visible technologies on websites: tags, scripts, DNS records, HTTP headers and front end technologies loaded in the page.
This is the most reliable technographic signal available, because it is direct observation. It is also the most limited. Web technology detection sees the marketing site and nothing behind the login.
Anything running internally, from the ERP to the data warehouse, leaves no trace on a homepage. A provider claiming enterprise back-office coverage from crawling alone is inferring, whatever the marketing says.
Job postings as a technology signal
Job postings can indicate a company's technology stack, and job descriptions naming specific technologies are the main route to seeing internal systems.
A posting for a Snowflake engineer is strong evidence of Snowflake. A posting listing eight tools as "nice to have" is weak evidence of any of them, and providers vary in how carefully they weight that distinction.
Timing is the advantage. Hiring for a technology usually precedes deploying it, so job postings surface an adoption months before a crawl would detect anything.
Contributor networks and human verified data
Some providers run contributor networks where users share their own stack in exchange for access, and some use survey or research teams to produce human verified data on named accounts.
Human verified data is the most accurate and the least scalable. It tends to exist for enterprise accounts and to thin out fast below that.
Machine learning inference fills the rest. Reliable technographic data usually means a blend, and the providers worth paying for will tell you which method produced which field.
Top technographic data providers, ranked
Ranked on technology coverage breadth, signal freshness, sourcing transparency and integration depth.
HG Insights
The IT spend and contract intelligence platform other technographic vendors get measured against, built around knowing what a technology costs and when the contract renews.
HG Insights runs what it calls the RGI (Revenue Growth Intelligence) Platform, tracking around 32,000 IT contracts and technology installations for Fortune 5000 accounts with spend and renewal timing attached to each record.
Founded in 2010 and based in Santa Barbara, the company took a growth investment from Riverwood Capital in January 2021 and has since acquired MadKudu, TrustRadius and Intricately, folding Intricately's network-level cloud data into the same platform. HG Insights states it serves more than 85% of Fortune 100 B2B companies.
Why it's ranked #1. Every provider below tells you a technology is present. This one tells you what it costs and when the contract ends, which is the difference between a list and a reason to call.
Enterprise teams that need a spend figure and a renewal date attached to each technology record.
Features
- Market Analyzer, an AI copilot for TAM/SAM/SOM sizing, ideal-customer-profile analysis and whitespace mapping.
- Data Studio, a no-code builder for predictive and account-scoring models.
- Sales Copilot, which turns technology and spend signals into competitive-displacement plays for reps.
- Contact Intelligence, a module for verified decision-maker contacts layered on the same account record.
- Native integrations with Salesforce, HubSpot, Snowflake, Clay, Marketo, Outreach and ZoomInfo.
Pricing and limits
Quoted, enterprise, priced by coverage and seats. Vendr records a $90,000 median across 46 purchases, from $31,498 to $173,119, with 22% average savings, the highest median in this cluster.
Who should skip it
Teams without a seat budget in five figures. G2 reviewers describe per-seat licensing that lands hardest on smaller teams, a real onboarding curve, and intent data some call dated for smaller or non-US accounts.
Switching trigger. A buyer who only needs confirmation a technology is present finds that cheaper at BuiltWith or Wappalyzer.
ZoomInfo
The largest company database in this ranking, with technographic filters, contact data and intent signals sold on the same record.
ZoomInfo tracks more than 30,000 technologies across 4.5 million-plus companies with tech-stack data on a rolling 60-day refresh, built from web crawlers reading more than 10 million pages a day, job postings and third-party filings.
Founded in 2007 and headquartered in Vancouver, Washington, ZoomInfo went public in 2020 and switched its Nasdaq ticker from ZI to GTM in May 2025. FY2024 revenue reached $1.21 billion, and the company reported roughly 1,900 customers paying $100,000 or more a year as of the first quarter of 2026.
Why it's ranked #2. Widest company coverage combined with contact data and CRM integration in one contract. Detection depth on internal systems trails HG Insights, which is the gap.
Sales teams that want technographic filters on the same record as contact data and intent signals, in one contract.
Features
- Technology detection across more than 30,000 tracked products, refreshed on a rolling 60-day cycle.
- Firmographic and org-chart data spanning more than 100 million company records, with hierarchy re-mapped after M&A.
- ZoomInfo Intent, scoring buying-committee activity from more than 4,500 tracked topics and 85 million-plus weekly signals.
- WhoKnows relationship data surfacing warm-introduction paths through a buyer's existing network.
Pricing and limits
Quoted per seat with credit allocations, no free plan. Vendr's buyer-reported data puts the median contract at $33,500 across more than 1,500 purchases, spanning $7,200 to $155,000-plus, with about 22% knocked off list on average.
Who should skip it
Teams whose accounts sit outside the US or in mid-market and small-business segments. G2 reviewers report accuracy dropping in EMEA and APAC coverage, plus a real learning curve on search and filtering.
Switching trigger. A European team weighing compliance exposure alongside coverage should compare Cognism first.
Demandbase
The technographic provider built for account-based marketing teams that want to activate a technology signal into an ad campaign directly.
Demandbase tracks more than 48,000 technologies across 136 million-plus domains and states its detection reaches technologies hidden behind firewalls that some crawl-only competitors miss.
Founded in 2006, Demandbase has acquired Spiderbook, Engagio, InsideView and DemandMatrix, and last disclosed a $1.33 billion valuation on an $88.3 million Series J round in 2021. It counts more than 1,000 customers, including Adobe, SAP Concur, Visa and IBM.
Why it's ranked #3. Largest published technology count here and the only one with advertising activation attached. It ranks third because the data is bundled into a platform you may not want.
Account-based marketing programmes that want to turn a technology signal directly into an advertising or sales play.
Features
- Technology detection across more than 48,000 tracked products and 136 million domains, including some systems hidden behind a firewall.
- Demandbase One, bundling account intelligence, sales intelligence, advertising orchestration and data integration in one platform.
- Pipeline AI for identifying and prioritizing buying groups inside a target account.
- Advertising orchestration that targets accounts directly from a technographic or intent signal.
Pricing and limits
Quoted, all deals custom-negotiated, spanning roughly $18,000 to $250,000-plus a year. Vendr's median lands at $68,591 across 185 purchases, ranging $24,000 to $164,265.
Who should skip it
Teams without weeks to spend on setup. G2 reviewers describe a steep learning curve across many segments and scoring models, plus occasional false-positive signals that need manual checking before a rep acts on them.
Switching trigger. A buyer who wants technology filters without the ad-activation layer pays less at ZoomInfo or Cognism.
BuiltWith
The largest technology catalogue in this ranking, priced in the hundreds a month on a published rate card.
BuiltWith's live count runs past 126,000 internet technologies across nearly 492 million domains, the largest detection catalogue in this ranking, with historical data back to January 1985.
Founded in 2007 by Gary Brewer, who remains the majority owner, BuiltWith has been reported as an unusually lean operation for its revenue, historically run by a small team generating eight figures a year.
Why it's ranked #4. Nothing matches its catalogue breadth or its price transparency. It sees only what a website exposes, which rules out most enterprise sales use.
Technology research and market sizing, where the question is how many companies use something and published pricing matters.
Features
- Lists, for building prospect lists filtered by technology or keyword combination.
- Trends, for tracking technology adoption and market share over time.
- CRM integration with Salesforce, HubSpot and Dynamics 365, plus predictive-lead and usage alerts.
- Historical technology data reaching back to January 1985, the deepest archive in this ranking.
Pricing and limits
Basic is $295 a month, Pro $495 and Team $995. Single-site lookups are free without an account.
Who should skip it
Teams that need enterprise sales use cases like contract value or renewal timing. G2 reviewers cite real cost at the higher tiers, messy CSV exports needing manual cleanup, and no visibility into internal systems that never touch a public webpage.
Switching trigger. A team that needs spend and contract data alongside detection needs HG Insights instead.
Wappalyzer
The API-first detection tool built for running technology lookups on your own schedule, inside your own pipeline.
Wappalyzer combines a browser extension, a Lookup and Bulk Lookup API, Lead Lists and Website Alerts that flag when a target's tech stack changes.
Founded in 2008 by Elbert Alias in Melbourne, Australia, the company remains founder-owned and self-funded.
Why it's ranked #5. Cleanest developer experience for detection. Company coverage and enrichment depth trail the platforms above it.
Teams embedding web technology detection inside their own product or enrichment pipeline through an API.
Features
- Lookup and Bulk Lookup APIs for programmatic, on-demand technology detection.
- Website Alerts that notify when a tracked domain's technology stack changes.
- Lead Lists for building prospect lists filtered by technology and keyword.
- A browser extension for one-off, on-page detection alongside the API.
Pricing and limits
Pro is $250 a month for 5,000 lookups, Business $450 for 20,000 with CRM enrichment, Enterprise from $850 for 200,000-plus. The free tier covers 50 lookups a month, and annual billing saves 17%.
Who should skip it
Teams that need broad company enrichment alongside detection. G2 reviewers report data-accuracy gaps in tech-stack reports and credit limits on lower tiers that frustrate frequent users.
Switching trigger. A buyer who wants the largest catalogue over the cleanest API compares BuiltWith first.
Intricately
A network-level cloud infrastructure specialist, now run inside HG Insights after a 2022 acquisition.
Intricately observes cloud and infrastructure adoption at the network level, running a sensor network across more than 150 global points of presence to estimate spend on AWS, Azure and Google Cloud from traffic volume, adoption breadth and relative product cost.
HG Insights acquired Intricately in March 2022, and its product page now redirects into HG's RGI Platform. A buyer evaluating this entry today is, in practice, evaluating a product line inside HG Insights and not a fully separate company.
Why it's ranked #6. The only provider here that sees infrastructure directly. Narrow by design, which is what caps it.
Vendors selling cloud infrastructure, CDN or networking products, where the buyer signal is invisible to a page crawl.
Features
- Network-level sensors estimating cloud and infrastructure spend across AWS, Azure and Google Cloud.
- A machine-learning spend model weighting product traffic volume, adoption breadth and relative cost, cross-checked against real spend data where available.
- Real-time alerts on prospect and competitor infrastructure events, plus a Chrome extension for lookups.
- List enrichment for up to 5,000 companies a month on trial access.
Pricing and limits
Custom pricing, quoted by coverage. Intricately publishes no dollar figures and carries no independent Vendr benchmark; the vendor's own documentation says the spend model underestimates hyperscale accounts and cannot see spend behind a firewall.
Who should skip it
Teams outside cloud, CDN or infrastructure sales, where the signal has no direct match. Reviewers on Capterra cite accuracy gaps and want direct integrations with Salesforce and Outreach over a manual export.
Switching trigger. A buyer selling into any other category gets more relevant coverage from HG Insights' broader platform.
PredictLeads
A trigger-data API pairing technology detection with hiring and event signals, priced by the credit, with no seat-based tier.
PredictLeads runs nine datasets across more than 120 million companies, including job openings, funding and news events, technology detections, key customers and firmographic data, delivered by API, webhook or flat file.
Y Combinator-backed and reportedly profitable before joining the accelerator, PredictLeads was founded by a team that has stated 2016 in press coverage and 2018 on its own YC page; both dates appear in public sources.
Why it's ranked #7. Best signal timing in this ranking. Total technology coverage is smaller than the platforms above, so it works as a trigger source.
Outbound teams that want technographics alongside the hiring and event signals that predict a stack change.
Features
- Nine structured datasets including job openings, financing and news events, technologies and key customers, spanning more than 120 million companies.
- Technology detection drawing on 86 million-plus companies and 1.4 billion-plus detections from scripts, DNS and job listings.
- Webhooks for real-time delivery alongside a REST API and downloadable flat files.
- Named integrations with Clay, Databar.ai, Common Room and Surfe.
Pricing and limits
100 API credits a month are free. Past that, pricing steps down by volume: $0.04 a credit to 5,000 calls, $0.02 to 10,000, $0.01 to 100,000, $0.004 to 500,000, then $0.002 above that, against a $40 monthly minimum.
Who should skip it
Teams that want a dashboard over raw API access. G2 reviewers note it is API-only with no front-end UI, and several call pricing structure hard to predict before the first invoice.
Switching trigger. A buyer who wants a bigger technology catalogue and a UI compares BuiltWith or Coresignal first.
Coresignal
A multi-source data feed folding technographic signals into the same record as company and employee data.
Coresignal ships four core datasets, Company, Employee, Jobs and Social Posts, spanning more than 70 million company records and hundreds of millions of employee profiles, each sold as raw, cleaned or multi-source enriched data.
Coresignal's raw and enriched datasets are compared against other bulk sellers on our data-buying companies ranking.
Refresh cycles vary by dataset: Coresignal states company data refreshes monthly and employee and job data refreshes daily to continuously, with no single fixed schedule across the board. The company has no meaningful G2 or Capterra review base to check that claim against.
Why it's ranked #8. One feed covering firmographic, employee and technographic signals is worth more than three contracts. Technology depth trails the specialists.
Data teams that want technology signals folded into one company and employee dataset under a single contract.
Features
- Four core datasets, Company, Employee, Jobs and Social Posts, each available as raw, cleaned or multi-source enriched data.
- Technographic fields carried inside the Company dataset alongside firmographics, funding and web traffic.
- Delivery by web-link download, cloud file delivery or real-time API, in JSON, JSONL, CSV or Parquet.
- Credit-based pricing across nine tiers, from a free 2,000-credit allowance up to a $5,000 Elite plan.
Pricing and limits
Free tier with 2,000 credits, then named tiers from Mini at $49 a month up to Elite at $5,000, with Starter, Pro, Growth and Premium in between; annual billing takes 10% off. Records cost 10 to 20 credits depending on dataset and enrichment level.
Who should skip it
Teams that need a mechanical, sourced refresh guarantee. Third-party analyst reviews describe pricing that stays unclear until a sales call, and raw-tier data that needs preprocessing before it is usable.
Switching trigger. A buyer whose primary need is technology depth compares HG Insights or BuiltWith, where that is the whole product.
Cognism
The compliance-first B2B data platform pairing phone-verified contacts with Bombora's intent data.
Cognism's Diamond Data verifies mobile numbers for more than 10 million contacts through a five-step pipeline, AI confidence scoring, machine-learning validation, cross-checks against 15 do-not-call lists, human review and a customer feedback loop, refreshing 95% of director-level contacts every 30 days.
Founded in 2015 and based in London, Cognism raised an $87.5 million Series C in January 2022 led by Viking Global Investors and Blue Cloud Ventures, and embeds Bombora's Company Surge intent data directly into its platform on Advanced and Elite plans.
Why it's ranked #9. Smallest catalogue here and the strongest compliance position. For a European team the trade is often worth it; elsewhere it is not.
European teams that need technographic filters without inheriting a GDPR compliance problem.
Features
- Diamond Data, phone-verified mobile numbers for more than 10 million contacts refreshed on a rolling basis.
- A five-step verification pipeline combining AI scoring, machine-learning checks, do-not-call cross-referencing and human review.
- Bombora Company Surge intent data embedded directly into the platform on Advanced and Elite plans.
- Technographic filters inside the same firmographic filter set used for prospecting.
Pricing and limits
Quoted per seat, no free plan. Vendr records a $36,000 median across 107 deals, from $18,350 to $93,886, with buyers negotiating close to 26% off on average, the deepest average discount in this list. Our Cognism pricing report compares these contract terms against Lusha, ZoomInfo and Apollo.
Try it yourself
Sign up for Lusha
Free plan available, credit-based pricing after that.
 Visit Lusha →
May earn a commission if you sign up through this link, at no extra cost to you. Full affiliate disclosure.
Who should skip it
Teams selling mostly outside Europe. G2 reviewers report numbers that sometimes resolve to a switchboard over a direct line, a sharp coverage drop outside EMEA, and export batches capped at 25 contacts.
Switching trigger. A US-focused team that needs broader technographic depth gets more from ZoomInfo or HG Insights.
Apollo.io
The cheapest route to technographic filtering in this ranking, bundled into a full sales engagement platform.
Apollo pairs technology and firmographic filters, drawn from a database of more than 230 million contacts and 30 million companies, with sequencing, a dialer and Bombora-powered buying-intent scores across more than 15,000 topics.
Founded in 2015 and backed by Y Combinator, Apollo raised $100 million at a $1.6 billion valuation in a 2023 Series D led by Bain Capital Ventures, and reported more than 40,000 paying customers at the time.
Why it's ranked #10. Cheapest route to any technographic filtering at all. Coverage and refresh are undisclosed, so treat the filters as directional.
Small teams that want technographic filters and outreach bundled into one subscription.
Features
- Technology and firmographic search across more than 65 filters, spanning a database of 230 million-plus contacts and 30 million-plus companies.
- Buying Intent scores from a Bombora partnership, covering more than 15,000 selectable topics on a weekly refresh.
- Built-in sequencing, a Power Dialer and CRM sync for acting on a filtered list without leaving the tool.
- A Chrome extension for pulling contact and company data while browsing LinkedIn or a company site.
Pricing and limits
Free Starter plan, then Basic at $49 a month billed annually, Professional at $79 and Organization at $119, each with monthly credit and export allowances that scale by tier. Trials include 50 credits and 5 mobile credits.
Who should skip it
Teams that budget from the per-seat rate alone. G2 reviewers report international accuracy well below domestic, phone numbers that go stale, and email bounce rates running 15 to 35% on unverified records.
Switching trigger. A buyer that needs technology coverage documented in detail compares ZoomInfo or HG Insights, where the filters carry published counts behind them.
How to evaluate technographic data providers
Five criteria decide this shortlist, and coverage count is the least useful of them.
Technology coverage breadth against your list
Evaluate providers based on technology coverage breadth, then check it against the specific technologies you care about.
A provider detecting 123,000 technologies is useless if the twelve that matter to you are ones it infers, which carries more error. Give every vendor the same list of twelve and compare.
Signal freshness
Signal freshness decides if outreach lands, and technographic data should be refreshed continuously for accuracy.
A stack change detected six months late is history. Ask how often each collection method runs, since crawls, job postings and contributor data usually refresh on different cycles inside the same product.
Sourcing methodology
The accuracy of technographic data is influenced by data freshness and verification methods. Ask which fields come from observation and which from inference, and treat a vendor that can't answer as one selling inference.
Blended sourcing is normal and fine. Blended sourcing presented as uniform detection is not, because you cannot weight a scoring model when every field looks equally confident.
Integration depth
Integration depth with CRM systems decides how much of this data gets used. Technographic data that arrives as a quarterly CSV gets applied once and decays silently.
API access matters more here than in most data categories, because technology changes are events. A field that updates when the change happens is a trigger; the same field updated on a schedule is a report.
Compliance
Compliance with GDPR and CCPA applies to data providers here too, even in a category that mostly describes companies.
Job postings and contributor networks are where data subjects appear. A technographic dataset built partly from named individuals carries the same obligations as contact data, whatever the product page calls it.
Tracking cloud infrastructure and data warehouses
Cloud infrastructure and data warehouses are the hardest technographic signals to collect and the most valuable to sell against.
Neither appears on a homepage. A company running Snowflake or BigQuery exposes nothing in its page source, which is why crawl-based providers show almost no coverage of the modern data stack.
Two methods work. Network-level observation infers cloud providers and infrastructure spend from traffic patterns, which is what Intricately built its product on. Job postings catch the rest, because migrating to a data warehouse means hiring people who name it.
Migration signals are worth more than installation facts. A company posting three roles mentioning a warehouse it does not yet run is mid-migration, and that is a buying window.
Company signals that arrive before the technology
Technographic data can trigger timely outreach based on technology changes, and the earliest company signals precede the change itself.
Hiring is the first. A posting naming a technology usually appears weeks or months before deployment, so it identifies companies ready to upgrade their tools.
Leadership changes are the second. A new CTO or VP of engineering reliably precedes stack review, which is why event detection sits alongside technographics in several products here.
Funding is the third. Capital arriving is capital that gets spent on tooling, and it identifies companies with both the intent and the budget at once.
Technographic data helps identify high value accounts when these signals stack. A company that hired for a technology, changed engineering leadership and raised a round is a different prospect from one that merely runs your competitor's product.
Technographic data for account based marketing
Companies use technographic data to identify high-fit prospects and segment markets, and account based marketing is where it pays back fastest because the account list is the campaign.
It identifies companies using competitors' products for targeting, which is the displacement play. Technographic data lets businesses tailor marketing messages to specific technology stacks, so the ad a Salesforce shop sees differs from the one a Dynamics shop sees.
Technographic data enables hyper-personalised marketing and competitor displacement campaigns, and both depend on the data being right. Accurate technographic data reduces wasted outreach efforts; wrong data produces an opening line that tells the prospect you did not check.
Pairing with intent data and contact data
Technographics tell you a company fits. Intent data tells you it is looking now. Contact data tells you who to call. Running one without the others produces a list, a signal or a phone number, and none of the three is a pipeline.
The sequence that works: firmographic and technographic filters build the target companies list, intent signals order it, and contact data makes it actionable.
Using technographic data improves lead scoring models, because a technology match is a harder signal than a firmographic band. Weight technology matches more heavily in the model.
Account intelligence in practice
Account intelligence means the whole picture on a named account: what it runs, what it spends, who works there, what it is hiring for and what it has been reading.
Enterprise teams assemble this from multiple company datasets, because no single provider is best at all five. The joining work is the cost nobody budgets for.
Sales engagement improves once it lands. A rep opening with a specific, current fact about the prospect's stack has a different conversation from one opening with a value proposition, and shorter sales cycles follow from that.
Technographic data for investment analysis
Technographic data has a second buyer that vendor marketing rarely addresses: investors reading technology adoption as a proxy for company performance.
Adoption curves for a specific product show a software company gaining or losing share, weeks before any disclosure. Counting how many companies added or dropped a technology is a revenue signal for the vendor that sells it.
Market research and alternative data work use the same signals differently. Technology intelligence on which stacks dominate which geographies tells you what a product needs to integrate with before entering a market.
Competitive intelligence teams read it as displacement risk. Watching your own technology disappear from customer stacks is an earlier churn signal than a support ticket.
Technographic data FAQ
What is technographic data?
Data describing the technologies a company uses: CRM, cloud services, marketing automation, analytics tools, security tools and web technology. It sits alongside firmographic data, which describes the company itself, and intent data, which describes what it is researching.
How is technographic data collected?
Web crawling for publicly visible technologies, job postings and job descriptions for internal systems, contributor networks and surveys for human verified data, network observation for cloud infrastructure, and machine learning inference for the gaps. Most providers blend several.
How often should technographic data be refreshed?
Continuously. Technology changes are events, and the value is in catching one within weeks. Quarterly refreshes turn a trigger into a historical record.
What is the difference between technographic and firmographic data?
Firmographic data describes what a company is; technographic data describes what it runs. Industry and headcount are firmographic. The CRM and the cloud provider are technographic. Most sales platforms sell both and are stronger at the first.
How much does technographic data cost?
Technographic data cost ranges from published tiers in the low hundreds per month for detection tools like BuiltWith and Wappalyzer, through Apollo from $49 per user per month, to enterprise contracts with HG Insights and Demandbase quoted in five and six figures.
Which technographic data provider is most accurate?
For publicly visible web technology, the crawl-based specialists, because they observe technology directly. For internal systems and spend, HG Insights. Accuracy is a question about a specific technology on a specific account. No vendor carries one accuracy number.
Bottom line
Decide what you need to see before you compare catalogues. Web-facing technology is cheap and reliable; internal systems and spend are expensive and inferred.
HG Insights for spend and contracts, ZoomInfo for breadth with contacts, Demandbase for ABM activation, BuiltWith and Wappalyzer for detection, Intricately for cloud.
PredictLeads for triggers, Coresignal for one combined feed, Cognism for European compliance, Apollo for a starting budget.
Then test the twelve technologies you sell against. Every provider looks complete until you check the ones that matter.
Putting technographic insights to work
Technographic insights reach three teams, and each wants a different cut of the same technology data.
Sales teams
Reps use a company's tech stack to open. Knowing an account's CRM changes the integration story, the migration cost and the objection you will hear third.
It also helps identify companies where you have a partner in place. An account already running one of your complementary tools is a warmer introduction than an account that merely matches the ICP.
Marketing teams
Marketing teams segment accounts by stack and run different creative against each. Displacement messaging aimed at a competitor's install base performs differently from adoption messaging aimed at companies running nothing.
Sales and marketing teams need the same stack fields for that to work. When marketing segments on a technology flag sales cannot see, the campaign generates leads the reps cannot contextualise.
Product and partnerships
Product teams read technographics as an integration roadmap. Counting how many target accounts run a given platform is a better prioritisation input than counting how many customers requested it.
Partnerships teams use the same counts to size an alliance. Enterprise platforms with large install bases inside your ICP are the partnerships worth pursuing; the rest are logos on a slide.
Data quality problems specific to technographic data
Three failure modes are particular to this category, and none of them shows up in a coverage figure.
Detection without removal
Most providers are better at detecting a technology than at noticing it left. A tag removed from company websites six months ago can persist in a dataset, so the install base looks larger than it is.
Ask specifically how removals are handled and how often data refreshes recheck existing records. Accurate data on churn matters as much as accurate data on adoption.
Inference presented as observation
Third party data blends observed and inferred fields, and few vendors label which is which. A confidence score helps only if you know what it is scoring.
Data quality here means knowing the provenance of each flag. Two providers agreeing on a technology tells you nothing if both inferred it from the same job posting.
Software tools that look alike
Detection struggles to distinguish products in the same family. A crawl seeing an analytics script often cannot tell the free tier from the enterprise licence, which are different buyers entirely.
Test this directly. Take twenty accounts where you know the exact edition and check what each provider reports.
Key factors, ranked
The key factors in this decision, in order: are the technologies you sell against observed or inferred, how quickly a change is detected, how removals are handled, and does the data reach the CRM as an event.
Coverage count comes fifth and gets quoted first.
Disclaimer
This page includes one or more affiliate links. If you sign up for a product through one of them, this site may earn a commission at no extra cost to you.