Firmographic data providers: rankings and buying guide for 2026
 By Jan Suski. I go deep on every review, checking every number against its source and digging up details other coverage misses, a habit from six years of SEO and link building for tech companies. Bylines at Surfer, Brand24, and Senuto. How the scoring works.
· Prefer this source on Google
Quick comparison of firmographic data vendors
Ten providers with the firmographic strength each one leads on, what entry costs, and the buyer it fits.
| # | Provider | Firmographic strength | Entry price | Best fit |
|---|---|---|---|---|
| 1 | ZoomInfo | 100M+ company profiles with contacts attached | $33,500 median* | Teams wanting one system of record |
| 2 | Coresignal | 500+ company fields, refreshed by dataset | Free tier, then from $49 a month | Data teams building on raw firmographics |
| 3 | Bright Data | Public web data across 120+ domains | From $2.50 per 1,000 records | Engineering teams assembling their own set |
| 4 | Cognism | GDPR-compliant European coverage | $36,000 median* | European teams with compliance exposure |
| 5 | Breeze Intelligence | Enrichment inside the CRM record | Bundled into HubSpot tiers | HubSpot-native revenue teams |
| 6 | People Data Labs | Company and person datasets by API | Free tier, then from $98 a month | Product teams embedding enrichment |
| 7 | Crunchbase | Funding rounds and private company data | $20,000 median* | Teams targeting recently funded companies |
| 8 | Global Database | International company coverage | Quoted | Teams needing coverage outside the US |
| 9 | Apollo.io | Firmographic filters on 240M+ contacts | From $49 per user a month | Small teams wanting filters and sequencing |
| 10 | LinkedIn Sales Navigator | Member-declared company and role data | From $119.99 per seat a month | Relationship-led sellers |
Medians marked * are anonymized buyer-reported contract values published by Vendr. Everything else is the price the vendor publishes itself.
Firmographic data describes company characteristics: industry, size, revenue and location. It is the business equivalent of demographic data for individuals, and it is what every B2B segmentation runs on.
Higher win rates reported by companies with a strong ideal customer profile, alongside a 200% revenue increase from account-based marketing built on one. Neither works without accurate company level attributes underneath.
Ten firmographic data providers are ranked below, after the part most guides skip: what the fields are and where they come from. The data providers guide covers how this layer sits against the others.
What firmographic data is
Firmographic data focuses on the organisation. Industry, company size, revenue, headquarters location, ownership type and growth rate, attached to a company record.
Firmographic data providers aggregate and analyse information about businesses and organisations, then sell it as records, enrichment or an API.
Firmographic and demographic data compared
Demographic data describes individual characteristics like age and income. Firmographic data describes company characteristics like industry and revenue. The two answer different questions and get confused constantly.
In B2C you segment a target audience by demographics. In B2B you segment a target market by firmographics, because the buying unit is a company and the individual reading your email is one of several people inside it.
Technographic data describes the technology stack a company uses, which is a third category again. Firmographics help identify companies that fit your ideal customer profile; technographics help understand operational maturity and business priorities. Combining firmographic and technographic data improves targeting precision beyond what either does alone.
Types of firmographic data
Six categories cover the data points sold as firmographic. Most providers offer firmographic data across all six and vary wildly in how completely each field is populated.
Company size and annual revenue
Company size is typically measured by employee count or revenue, and the two disagree more often than buyers expect. A 40-person agency and a 40-person software company sit in different revenue ranges entirely.
Annual revenue is the harder field. Public companies report it; private companies mostly do not, so vendors model it from employee count, industry and any filings available. Treat a revenue range on a private company as an estimate with a wide error bar.
Employee count is more reliable because it leaks through professional networks and job postings. It is also the field that decays fastest, which is why continuous monitoring matters more here than on industry codes.
Industry classification and geographic location
Industry classification is where vendors diverge most. SIC, NAICS and proprietary taxonomies all coexist, and a company classified as software by one provider is classified as business services by another.
Ask which taxonomy a provider uses before you build a segmentation on it. Migrating between classification systems later means rebuilding every territory and scoring rule that depends on them.
Geographic location covers headquarters location, operating locations and legal registration, which are three different things for any company larger than one office. Headquarters location drives territory assignment; operating locations drive addressable market sizing.
Ownership structure and organizational structure
Ownership type indicates if a company is public, private or nonprofit, and it changes both the sales cycle length and who signs. Private equity ownership adds another pattern again.
Ownership structure maps parents, subsidiaries and group companies. Selling to a subsidiary without knowing the parent has a global agreement with your competitor is a recoverable mistake; discovering it in procurement is not.
Organizational structure covers departments, reporting lines and headcount by function. Few providers do this well, and the ones that do build it from professional network data.
Growth indicators
Growth rate signals a company's expansion or contraction trends, and growth indicators signal purchasing power and urgency. A company that grew headcount 40% in a year buys differently from one that shrank 10%.
The usual growth signals are headcount trajectory, job postings volume, funding rounds and office openings. Job postings are the earliest of these and the easiest to collect, which is why so many vendors lead with them.
Growth stage matters as much as growth rate. Mid market SaaS companies at 200 employees behave differently from enterprises at 5,000, and firmographic criteria that ignore stage produce lists that convert unevenly.
Where firmographic data comes from
Providers collect data from public records, web scraping and professional networks. Understanding the collection method tells you which fields to trust.
Third party data providers
Third party data providers aggregate from many sources and sell the combined result. This is the fastest route to coverage and the least transparent on provenance.
Third party data has one structural weakness worth knowing: vendors buy from each other. Two providers can appear to corroborate a revenue figure while both sourcing it from the same upstream feed, which is not corroboration at all.
Ask which fields are collected first-hand and which are licensed. Most vendors will answer, and the ones that will not have told you something.
Public sources and company websites
Firmographic data sources include business registries and government filings, which are authoritative on legal status, incorporation and officers, and silent on almost everything commercial.
Company websites, press releases, job boards and business directories fill the commercial gaps. Web scraping earns its place here through vendors like Bright Data, and data quality depends entirely on how well a vendor handles a site redesign.
Self reported data from forms and surveys is the most accurate and the least scalable. A prospect who tells you their company size in a form has given you better data than any vendor sells, for exactly one record.
CRM data enrichment
Data enrichment appends firmographic fields to records you already hold, on form fill, on record creation or on a schedule against the existing database.
This is usually the better first purchase. Most CRMs already contain thousands of accounts with a name, a domain and nothing else, and enriching those costs less than buying new records.
Marketing automation platforms consume the result. Firmographic segmentation only becomes operational once the fields exist on every record.
Top firmographic data providers, ranked
Ranked on field completeness against a defined ICP, refresh frequency on high-decay fields, delivery flexibility and price against delivered coverage. Firmographic data providers compared here span sales platforms, raw data vendors and enrichment layers, which puts three different products in one ranking.
ZoomInfo
The largest system of record in this ranking, pairing firmographic data with contacts and intent signals on one platform.
ZoomInfo holds more than 100 million company records with around 20 firmographic fields each, including name, domain, headquarters, revenue, employee count and SIC/NAICS codes, plus organizational hierarchy that re-parents contacts to a new owner within minutes of an acquisition closing.
Founded in 2007 and headquartered in Vancouver, Washington, ZoomInfo went public in 2020 and switched its Nasdaq ticker from ZI to GTM in May 2025, reporting $1.21 billion in FY2024 revenue.
Why it's ranked #1. Best field completeness on US mid-market and enterprise accounts, with the deepest integration surface. It loses on price and on European coverage, which is where the next entry takes over.
Sales and marketing teams that want firmographic data, contact data and intent data on one record with a CRM integration already built.
Features
- More than 100 million company records with around 20 firmographic fields each, including revenue, employee count and industry code.
- Organizational hierarchy mapping that re-parents contact records to a new owner within minutes of an acquisition closing.
- 34 million-plus international company records alongside the US-heavy core database.
- Technographic and hiring-based growth signals layered onto the same firmographic record.
Pricing and limits
Quoted per seat with credit allocations, no free plan. Vendr's buyer-reported data puts the median contract at $33,500 across more than 1,500 purchases, spanning $7,200 to $155,000-plus, with about 22% knocked off list on average.
Who should skip it
Teams whose target accounts sit mostly outside the US. G2 reviewers report field completeness and contact accuracy both dropping in EMEA and APAC, plus a real learning curve on search and filtering.
Switching trigger. A European-first team should compare Cognism before signing.
Coresignal
A firmographic data feed built for pipelines and data teams, delivered with no user interface at all.
Coresignal offers over 500 structured company data fields across more than 70 million company profiles and hundreds of millions of employee profiles, sold as raw, cleaned or multi-source enriched data.
Coresignal states company data refreshes monthly and employee data refreshes daily to continuously, though the company publishes no single fixed refresh figure and carries close to no independent G2 or Capterra review base to check that against.
Why it's ranked #2. Nothing here matches 500 fields at this depth in one feed. It ranks second only because it offers no interface for a salesperson, which most buyers of firmographic data still need.
Data teams that need firmographic data as a raw feed they can pipe into their own systems.
Features
- Four core datasets, Company, Employee, Jobs and Social Posts, each sold as raw, cleaned or multi-source enriched data.
- More than 70 million company records carrying firmographic, funding and web-traffic fields together.
- Hundreds of millions of employee profiles linked to company records for headcount and org-level analysis.
- Delivery by web-link download, cloud file delivery or real-time API, in JSON, JSONL, CSV or Parquet.
Pricing and limits
Free tier with 2,000 credits, then named tiers from Mini at $49 a month up to Elite at $5,000, with Starter, Pro, Growth and Premium in between; annual billing takes 10% off, and records cost 10 to 20 credits depending on dataset.
Who should skip it
Sales teams that need a user interface over a raw feed. Coresignal carries close to no G2 or Capterra review base, so the limitations here come mostly from analyst write-ups: pricing that stays unclear until a sales call, and raw-tier data that needs preprocessing before it is usable.
Switching trigger. A team that wants firmographics inside a ready-to-use sales platform compares ZoomInfo or Apollo instead.
The most flexible source in this ranking, and the least finished: raw web data you structure yourself.
Bright Data's proxy network runs more than 400 million monthly rotating residential IPs across 195 locations, plus over 1.3 million ISP and 1.3 million datacenter IPs, alongside a Dataset Marketplace of pre-built records and a Web Scraper API for site-specific collection.
Founded in 2014 as Luminati Networks and rebranded Bright Data in 2021, the company crossed $300 million in 2025 annual recurring revenue serving more than 20,000 customers, bootstrapped without disclosed outside funding.
Why it's ranked #3. Most flexible source here and the least finished. It ranks below the packaged providers because you are buying collection infrastructure.
Engineering teams that want to source firmographic data from the public web and control the collection themselves.
Features
- Dataset Marketplace of pre-built records across company, e-commerce and real-estate data, for buyers who want records without running a scraper.
- Web Scraper API, a library of site-specific collectors for structured data from named platforms.
- A proxy network of more than 400 million rotating residential IPs across 195 locations, targetable to country, city or ZIP.
- Managed, done-for-you data acquisition for teams that want the output without building the pipeline.
Pricing and limits
Datasets start at $2.50 per 1,000 records, so 100,000 records cost $250. Subscribing to refreshes cuts the per-record rate by up to 80%, and a managed acquisition service starts at $1,500 a month. New accounts also get 5,000 free credits a month, renewing monthly, across the Web Unlocker, SERP API, Web Scraper API, and Scraper Studio, no card required. The Browser API joined that pool in September 2026.
Who should skip it
Teams without engineering capacity to turn raw feeds into a usable dataset. G2 reviewers point to pricing that lands hardest on small teams relative to enterprise accounts and a learning curve across the many overlapping products.
Switching trigger. A team that wants a packaged firmographic dataset without building its own collection infrastructure compares ZoomInfo or Coresignal.

Try it yourself
Get started with Bright Data
Datasets from $2.50 per 1,000 records; a managed acquisition service starts at $1,500 a month.
 Visit Bright Data →
May earn a commission if you sign up through this link, at no extra cost to you. Full affiliate disclosure.
Cognism
The compliance-first choice, built for teams whose firmographic coverage gap is European.
Cognism's Diamond Data verifies mobile numbers for more than 10 million contacts through a five-step pipeline, cross-checked against 15 do-not-call lists, refreshing 95% of director-level contacts every 30 days.
Founded in 2015 and based in London, Cognism raised an $87.5 million Series C in January 2022 led by Viking Global Investors and Blue Cloud Ventures, and embeds Bombora's Company Surge intent data on its Advanced and Elite plans.
Why it's ranked #4. Best European firmographic coverage with compliance built in. US field completeness trails ZoomInfo, which is the only thing keeping it out of the top three.
Teams whose firmographic coverage problem is European, and need compliance built into the same record.
Features
- Standard firmographic set with stronger European field completeness than US-first vendors.
- Diamond Data, phone-verified mobile numbers cross-checked against 15 do-not-call lists.
- Funding and job-change events tracked as growth indicators alongside the firmographic record.
- Bombora Company Surge intent data embedded on Advanced and Elite plans.
Pricing and limits
Quoted per seat, no free plan. Vendr records a $36,000 median across 107 deals, from $18,350 to $93,886, with buyers negotiating close to 26% off on average, the deepest average discount in this list.
Who should skip it
US-first teams. G2 reviewers report numbers that sometimes resolve to a switchboard when a direct line was expected, plus export batches capped at 25 contacts.
Switching trigger. A team whose accounts sit mostly in the US gets deeper field completeness from ZoomInfo.
Breeze Intelligence
HubSpot's native enrichment layer, built on the Clearbit acquisition, running inside the CRM record automatically.
Breeze Intelligence launched in public beta at HubSpot's INBOUND event in September 2024, drawing on a base HubSpot cited at launch as more than 200 million company and buyer profiles, appending more than 40 firmographic, demographic and technographic attributes to a record on form fill or creation.
In June 2025, HubSpot folded Breeze Intelligence credits into its unified HubSpot Credits pool, priced at $10 per 1,000 credits, with monthly allowances scaling from 500 credits on Starter tiers to 5,000-plus on Enterprise and Data Hub tiers.
Why it's ranked #5. The enrichment runs without anyone remembering to run it, which beats better data nobody applies. Coverage depth trails the dedicated providers and it is worth little outside HubSpot.
HubSpot-native teams that want firmographic enrichment running automatically, without separate connector work.
Features
- One-click enrichment of company and contact records on form fill or record creation, no connector required.
- Dynamic form-shortening that skips fields HubSpot already holds data for.
- More than 40 firmographic, demographic and technographic attributes written directly onto the company object.
- Buyer-intent criteria that automatically add high-fit, high-intent companies into the CRM for outreach.
Pricing and limits
Credit-based, bundled into HubSpot's unified Credits pool at $10 per 1,000 credits, available only within a HubSpot subscription. Monthly allowances scale from 500 credits on Starter tiers to 5,000-plus on Enterprise and Data Hub tiers, with custom pricing above the allowance. Our Clearbit pricing report breaks down what those credits buy, with enrichment at 0 credits and intent at 10 credits per company a month.
Who should skip it
Teams without an active HubSpot subscription, since Breeze Intelligence is not sold standalone. Reviewers note credits expire monthly with no rollover, and coverage is reportedly weaker outside the US, UK and Western Europe.
Switching trigger. A non-HubSpot team needing the same enrichment buys People Data Labs or Coresignal directly instead.
People Data Labs
A developer-first data API selling company and person records with documented schemas, built for teams embedding firmographic enrichment inside their own software over buying a seat-based tool.
People Data Labs sells its datasets through a REST API with published field schemas and predictable match logic, aimed at engineering teams building enrichment into a product, the kind of buyer who writes code against an API. Company records link to person records where a match exists, giving product teams one call for both.
Why it's ranked #6. The cleanest developer experience in this ranking, with documented schemas and a free tier a developer can test against before committing budget. Field depth per company trails Coresignal, which is the gap.
Product and engineering teams embedding firmographic enrichment inside their own software over buying a seat-based tool.
Features
- Company API with firmographic fields including industry, size, location and founding year.
- Person API linked to company records for combined contact-and-firmographic lookups.
- Bulk enrichment endpoints for batch matching against existing account lists.
- Published field-level schemas and match-confidence scoring on every record.
Pricing and limits
The free plan gives 100 records a month for testing. Pro starts at $98 a month for 350 records, and Enterprise is quoted. Annual billing takes 20% off list price.
Who should skip it
Sales and marketing teams that want a browsable UI for list building. People Data Labs ships an API with no native CRM interface, so a team without engineering resources to build against it gets less value than the price implies.
Switching trigger. A team that outgrows the API model and wants firmographic filtering built into the same tool their reps already use finds that at Apollo or ZoomInfo instead.
Crunchbase
A private-company database built around funding events, investors and headcount movement, which is firmographic signal on businesses that publish nothing else.
Crunchbase covers private companies through funding rounds, investors, acquisitions and headcount movement, sourced from a mix of self-reported founder updates, public filings and its own research team. That funding-and-investor angle is firmographic data on companies too young or too private to appear in a financial filing.
Why it's ranked #7. The best private-company coverage here, with the cheapest published entry point in this ranking. Thin on revenue and employee count outside funded companies is the gap.
Teams whose firmographic filter is a funding event, investor name or headcount inflection over static company size.
Features
- Funding history including round size, date, lead investors and valuation where disclosed.
- Acquisition and IPO tracking across the private-to-public lifecycle.
- Headcount trend estimates that flag hiring surges and contractions.
- Industry, location and technology-stack tags on private and public companies alike.
Pricing and limits
Free search sits under paid Pro and Business tiers. Vendr records a $20,000 average negotiated contract across 73 deals. Our Crunchbase pricing report covers what happens past Business, where Custom Data Access still routes to a sales request.
Who should skip it
Teams that need revenue and employee-count precision on companies outside the funded-startup world. Crunchbase's depth comes from tracking funding events, and that signal thins fast once a company stops raising or was never venture-backed.
Switching trigger. A buyer needing firmographic depth across bootstrapped or public companies finds broader coverage at Coresignal or Global Database. Crunchbase's strength stops at funded startups.
Global Database
An international company database built for coverage across jurisdictions a US-centric provider treats as an afterthought, refreshed on a faster cycle than most global datasets.
Global Database updates a large share of its records within 24 hours, a fast cycle for a provider spanning this many countries and regulatory regimes. Coverage includes financial indicators and credit data layered on top of standard firmographic fields, aimed at teams doing due diligence or credit risk work across borders.
Why it's ranked #8. Genuine international coverage with a 24-hour refresh is uncommon at this scale. Field depth per record trails the specialists ranked above it, which is the tradeoff.
Teams needing firmographic coverage across international markets with a refresh cycle faster than a quarterly batch update.
Features
- Company profiles spanning industry, size, location and ownership structure across international markets.
- Financial indicators and credit data alongside standard firmographic fields.
- 24-hour refresh on a large share of tracked records.
- Coverage across jurisdictions many US-focused providers treat as secondary markets.
Pricing and limits
Custom pricing by market and coverage, quoted per deployment.
Who should skip it
Teams whose footprint is US-only. The international breadth that makes Global Database useful for cross-border work stops mattering against domestic specialists, and per-record depth trails the field.
Switching trigger. A buyer whose accounts sit inside one country over spanning several finds deeper per-record data at Coresignal or ZoomInfo.
Apollo.io
A firmographic filter bolted onto an outreach platform, priced for small teams that want to start filtering and sending on the same subscription today.
Apollo carries 240 million+ contact records with firmographic search filters layered on, plus email sequencing built into the same interface. The pitch is one subscription that filters an account list and sends the first touch, with no separate enrichment tool to stitch in.
Why it's ranked #9. The only entry here a buyer can evaluate without a sales call, with a free Starter plan to test against. Firmographic accuracy on revenue and employee count trails every provider ranked above it.
Small teams that want firmographic filtering and outreach in one subscription they can start on today, without a procurement cycle.
Features
- Firmographic filters spanning industry, employee count, revenue estimate and location.
- Technographic signals layered on the same account record as the firmographic fields.
- Email sequencing and outreach built into the same interface used for list filtering.
- Free Starter plan with 50 credits and 5 mobile credits a month for evaluation.
Pricing and limits
$49 per user a month at the entry paid tier, on top of the free Starter plan.
Who should skip it
Teams needing firmographic accuracy for account scoring or territory planning. Apollo's revenue and employee-count fields are estimates built for outreach targeting, and reviewers report enough drift on those fields that a team building a scoring model around them gets less precision than a dedicated firmographic provider.
Switching trigger. A team building a scoring model that needs field-level precision on revenue and employee count finds that at Coresignal or ZoomInfo.
LinkedIn Sales Navigator
Member-declared headcount and org data updated by the people who work there, held inside one interface with no export path out.
Sales Navigator runs on member-declared profile data, which makes employee count and organizational structure unusually current against providers refreshing on a quarterly or annual cycle. The tradeoff is access: there is no export and no API, so every lookup happens one company at a time inside the LinkedIn interface.
Why it's ranked #10. The freshest employee data available anywhere in this ranking, locked behind a screen. Without export or API, it stays locked to one lookup at a time and never feeds a segmentation or scoring model, which is what firmographic data is for.
Researchers who need current company size and role data for one-off lookups and will work inside a single interface.
Features
- Headcount by function and department, sourced from member profiles.
- Growth indicators that flag hiring surges at the account level.
- Seniority distribution across a company's employee base.
- Geographic location data down to the office or region.
Pricing and limits
Published per-seat plans: Core at $119.99 a month or $1,079.88 a year, Advanced at $159.99 or $1,799.88.
Who should skip it
Any team that needs the data outside the LinkedIn interface. With no export and no API, firmographic data from Sales Navigator stays inside the LinkedIn interface with no path into a CRM enrichment workflow, a scoring model or a segmentation, which limits it to manual, one-company-at-a-time research.
Switching trigger. A team that needs the data to flow into a CRM or scoring model finds an exportable, API-accessible alternative at People Data Labs or Coresignal.
How to evaluate firmographic data providers
Four checks separate providers, and none of them is record count.
Test on 100 accounts you already know
Evaluate data accuracy by testing 100-account samples drawn from your closed-won list. Those accounts are your ICP by definition and you can verify every field independently.
Score three things per record: was the company found, how many fields were populated, and how many populated fields were correct. The third number is the one vendors never quote.
Data quality can vary across firmographic data providers and regions, so run the test on the geography you sell into. A provider strong in North America can be half as complete in DACH.
Check refresh on high-decay fields
Look for providers with continuous monitoring on high-decay fields. Employee count, funding status and headquarters location change constantly; industry classification barely moves.
A provider refreshing everything quarterly is refreshing the fields that did not need it and missing the ones that did. Ask about refresh cadence field by field.
Coverage against your own ICP
Choose providers based on coverage of your specific ideal customer profile. Total record count tells you about the market; fill rate on companies matching your firmographic criteria tells you about your list.
Sub-50-employee coverage is where most databases thin out. If you sell to small businesses, test there specifically, because aggregate completeness figures are carried by enterprise records.
Integration and compliance
Integration with your existing CRM decides if this purchase survives, because firmographic data that requires a manual export gets applied once and then decays quietly.
GDPR compliance is essential for European data usage. Company records are less exposed than contact data, but employee counts derived from named profiles are personal data wearing a company label, and data sourcing practices are what a regulator will ask about.
How to use firmographic data
Firmographic data helps identify ideal customer profiles for targeting, and the sequence matters more than the vendor.
Build the ICP from what already closed
Start with closed-won accounts and look for proven success patterns across industry, company size, revenue and growth stage. That is your real ICP. The one on the pitch deck is a guess.
Compare firmographics against performance data. Sales cycle length, deal size and churn all vary by segment, and the segment that closes fastest is rarely the one with the largest logos.
Segment and prioritise
Firmographic segmentation by industry company size revenue and geography turns a flat list into ranked tiers. Segmentation by industry and size improves campaign effectiveness because industry specific pain points differ enough to change the message.
Sales teams use firmographic data to prioritise accounts that fit the ICP. Firmographic targeting identifies companies that fit; intent data tells you which of them are looking now. Use firmographic data to build the list and intent to order it.
Activate across sales workflows
Firmographic insights only produce pipeline once they reach sales workflows. Territory design, lead routing, scoring models and campaign audiences all read the same fields, so a gap in one field propagates everywhere.
Firmographic data helps identify high-value accounts for targeted marketing, and firmographic data plays the same role in account-based programmes, where the account list is the campaign.
Lead generation improves at the top of the funnel too. Filtering out companies that cannot buy is cheaper than qualifying them out later, and it is the least glamorous return on this purchase.
Firmographic data FAQ
What is firmographic data?
Company-level attributes used to segment and target businesses: industry, company size, annual revenue, geographic location, ownership type and growth indicators. It is the B2B counterpart to demographic data in consumer marketing.
What is an example of firmographic data?
A software company in Berlin with 240 employees, an estimated revenue range of $20m to $50m, private ownership, backed by venture capital and hiring across engineering. Every one of those is a separate firmographic field.
What is the difference between firmographic and technographic data?
Firmographic data describes what a company is; technographic data describes what it runs. Industry and headcount are firmographic; the CRM and cloud provider are technographic. Most vendors offer firmographic data and sell technographic as an add-on.
Where does firmographic data come from?
Business registries and government filings for legal and ownership facts, company websites and press releases for commercial detail, job postings for growth signals, professional networks for headcount, and self reported data from forms. Most providers blend all five.
How often should firmographic data be updated?
Continuously on employee count and funding, quarterly on industry and location. A single refresh cadence across every field either wastes budget or leaves the volatile fields stale.
What is the most accurate firmographic data source?
For legal and ownership facts, the company registry. For headcount, professional network data. For revenue on private companies, nothing is accurate and everything is modelled. Accurate firmographic data means knowing which of those three you are looking at.
See the infrastructure
Explore Bright Data's proxy network
More than 400 million rotating residential IPs across 195 locations, targetable to country, city or ZIP.
Visit Bright Data →
May earn a commission if you sign up through this link, at no extra cost to you. Full affiliate disclosure.
Bottom line
Firmographic data is the layer everything else attaches to, which is why gaps in it are expensive and invisible.
ZoomInfo for US field completeness, Coresignal for depth and refresh speed, Bright Data for custom collection, Cognism for Europe, Breeze for HubSpot automation.
People Data Labs for embedded enrichment, Crunchbase for funded private companies, Global Database for international reach, Apollo for a starting budget, Sales Navigator for current headcount.
Then test on 100 accounts you already know. Every provider looks complete in a demo and different on your own segment.
The firmographic data points that matter most
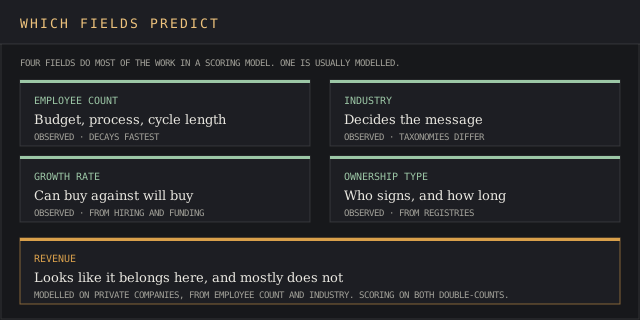
Not every field earns its place in a scoring model. Four data points do most of the predictive work, and the rest mostly pad a record.
Employee count. The single most useful field, because it correlates with budget, buying process complexity and sales cycle length at once. It is also the most volatile, which is why refresh cadence matters here more than anywhere else.
Industry. Decides the message. Industry specific pain points differ enough that one campaign across three industries underperforms three campaigns across one each.
Growth rate. Separates companies that can buy from companies that will buy. Purchasing power follows growth more reliably than it follows size.
Ownership type. Changes who signs and how long it takes. Private equity backed, venture backed, public and founder owned are four different sales processes wearing the same firmographic label.
Revenue looks like it belongs on this list and mostly does not, because on private companies it is modelled. A revenue range on a private company is an inference from employee count and industry, which means scoring on both double-counts the same underlying signal.
Firmographic market segmentation in practice
Market segmentation on firmographics works when the segments behave differently, and fails when they merely look different on a slide.
Build segments that predict something
Test each proposed segment against outcomes you already have. If two segments show the same win rate, deal size and cycle length, they are one segment with extra reporting overhead.
The segments that survive that test usually cut across the obvious axes. Company size crossed with growth stage predicts better than either alone, because a 500-person company growing 40% buys like a 200-person company and a 500-person company shrinking does not.
Sales and marketing efforts should share the same segment definitions. When marketing segments by industry and sales works territories by geography, the two teams report on different populations and neither number reconciles.
Sizing the addressable market
Firmographic data lets you count target companies. How many companies exist at your revenue band, in your industries, in your geographies, is a query once the data is in place.
That count is what makes a territory plan defensible. It also exposes the uncomfortable answer when the addressable market turns out smaller than the target, which is worth discovering before the year starts.
Coverage gaps distort this badly. If a provider is 40% complete on sub-50-employee companies and you sell to small businesses, your market sizing understates reality by more than half.
Marketing efforts downstream
Marketing efforts inherit whatever the segmentation produced. Ad audiences, nurture tracks and content targeting all read the same fields, so a wrong industry classification propagates into every campaign that uses it.
Sales teams inherit it too, through routing and scoring. A rep working a list built on stale employee counts spends the first call discovering the company is half the size the CRM claims.
Where firmographic data goes wrong
Three failure patterns account for most disappointment with this category.
Treating modelled fields as verified data
Providers rarely distinguish between a field they observed and a field they inferred. Verified data on employee count means somebody counted; a modelled figure means somebody estimated from industry averages.
Ask for the distinction per field. The vendors that can answer are worth more than the ones with larger databases, because you can weight a scoring model differently when you know which inputs are estimates.
Single-source dependency
Buying one provider and treating its output as truth removes your ability to spot when it is wrong. Two sources disagreeing on employee count is useful information; one source is just a number.
Accurate data at scale usually means a primary provider plus a check on the fields that drive scoring. That costs more and it prevents the failure mode where a segmentation runs on a systematically biased field for a year.
Refreshing everything or nothing
Most teams refresh on a schedule that suits procurement. Quarterly enrichment across every field is both wasteful and insufficient, because it over-refreshes industry codes and under-refreshes headcount.
Split the cadence by volatility. High-decay fields on continuous monitoring, stable fields annually, and the budget lands where the decay is.
Firmographic data beyond sales and marketing
Firmographic data is used in B2B sales, marketing, market research and risk analysis, and the last two buy it for reasons the vendor decks rarely mention.
Organisations use firmographic data to analyse markets and competitors. Counting companies by industry, size and geography is how you size a segment properly, and market research often involves analysing firmographic data regarding company types before any survey work begins.
Risk teams read the same fields differently. Ownership structure exposes concentration you did not know you had, when three suppliers turn out to be subsidiaries of one parent. Company registry status and incorporation date support counterparty checks that a sales database never touches.
Recruiters use it to map competitor headcount and hiring direction. Investment teams use growth indicators and funding history alongside alternative data to screen private companies that publish nothing else.
Each of those buyers wants a different delivery. Sales wants it in the CRM, research wants a file, risk wants the registry record with provenance attached, and one vendor rarely serves all three well.
That is worth knowing before a shared procurement. Teams that buy one firmographic contract for the whole company usually tailor it for whoever ran the process, and the other two quietly build workarounds.
Compare the collection cost
Check Bright Data pricing
100,000 records cost $250 to start, and refresh subscriptions cut the per-record rate by up to 80%.
Visit Bright Data →
May earn a commission if you sign up through this link, at no extra cost to you. Full affiliate disclosure.