Alternative data providers: rankings and buying guide for 2026
 By Jan Suski. I go deep on every review, checking every number against its source and digging up details other coverage misses, a habit from six years of SEO and link building for tech companies. Bylines at Surfer, Brand24, and Senuto. How the scoring works.
· Prefer this source on Google
Quick comparison of alt data providers
Nine providers with the source they draw on, what entry costs, and who buys the output. Eight of the nine publish no vendor rate card at all, which is how this market works: price follows the dataset, the refresh rate and the exclusivity you negotiate.
| # | Provider | Data source | Entry price | Primary buyer |
|---|---|---|---|---|
| 1 | AlphaSense | Filings, expert call transcripts, broker research | $17,500 median* | Hedge funds and corporate strategy |
| 2 | FactSet | Aggregated datasets via Open:FactSet Marketplace | Quoted, enterprise | Institutional investors |
| 3 | Bright Data | Web scraped data across 120+ domains | From $2.50 per 1,000 records | Quant teams building their own signals |
| 4 | Similarweb | Web traffic and digital engagement | Quoted, custom package | Fundamental investors and corporate clients |
| 5 | Placer.ai | Geolocation and foot traffic | Quoted | Retail and real estate analysts |
| 6 | Revelio Labs | Workforce and hiring data | Quoted | Private equity firms and asset managers |
| 7 | Panjiva | Import and export shipment records | Quoted | Supply chain and trade-exposed coverage |
| 8 | PassBy | Geolocation, 94% correlation to ground truth | Quoted | Institutional data buyers testing accuracy |
| 9 | Volza | Customs shipment records across 200+ countries | Free trial; paid plans quoted | Importers, exporters and sourcing teams |
Medians marked * are anonymized buyer-reported contract values published by Vendr. Everything else is the price the vendor publishes itself.
Alternative data refers to non-traditional data sources used in finance: transaction records, satellite imagery, web traffic, job postings and app usage, read for what they say about a company before the company says it. Reading those signals early keeps an analyst ahead of the curve.
Size of the global alternative data market in 2025, projected to reach $135.8 billion by 2030. Hedge funds allocate over $1.6 million a year each to it, and that figure covers the datasets alone.
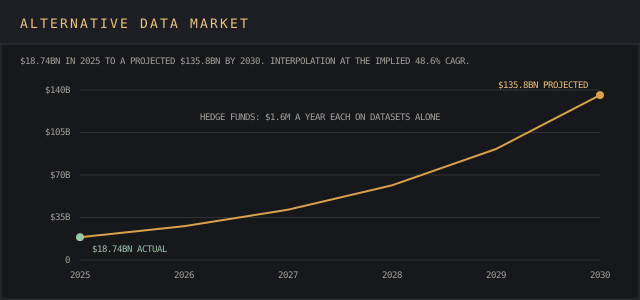
Nine providers ranked below on what they collect, who buys it, and how close the data sits to ground truth. The data providers guide covers how alternative data differs from the B2B and company categories.
Types of alternative data sources
Alternative data includes web scraping, app usage and social sentiment, and each category answers a different question about company performance.
Transaction and consumer spending data
Transaction data reflects real-time consumer behavior through purchases. Aggregated credit card data and point of sale data show revenue direction weeks before a quarter closes. Circana runs one of the larger point-of-sale operations in this space, pairing checkout data with consumer panel data across 26 industries on its Liquid Data platform.
Consumer spending data is the closest alt data gets to reading a company's top line directly, which is why it carries the highest prices and the tightest panel restrictions.
Web data and app usage
Web scraped data includes product listings and pricing from websites, useful for competitive benchmarking and for tracking assortment changes as they happen. Bright Data is the largest scraped-web-data vendor in this ranking, delivering listings and pricing as structured feeds across 120+ domains.
Web traffic shows demand direction for anything sold online. App usage adds the mobile half, which for consumer names is often the larger half. Sensor Tower measures app usage through a panel of millions of mobile users, and our Sensor Tower pricing report tracks a $75,000 median contract.
Geospatial and satellite imagery
Geospatial data uses satellite imagery to monitor physical activities. Investors use satellite images to watch industrial activity, count cars in car parks and track construction against schedule. A picture is worth a thousand words here, since a single overhead pass can show output shifting before any filing mentions it.
Geolocation data tracks consumer movement and behavior patterns, which reads store traffic without waiting for a filing.
Consumer sentiment and survey data
Sentiment analysis from social media gauges public opinion on brands. Survey data provides insights into consumer preferences and intentions, and sentiment data is the cheapest alt data to buy and the hardest to trade on.
Patent data, government contracts and regulatory filings sit alongside these as public sources most teams underuse.
Top alternative data providers, ranked
AlphaSense
Best fit: hedge funds and corporate strategy teams that want alternative data and traditional financial data searchable in one place.
AlphaSense combines financial statements, regulatory filings and expert call transcripts with semantic search across the corpus. Expert call transcripts are the differentiator: primary research at scale without commissioning it.
The corpus spans more than 500 million documents, with filings from over 68,000 public companies and profiles for more than a million private ones.
A 2024 acquisition of Tegus for $930 million folded in a transcript library now covering more than 100,000 expert interviews across over 4,000 public companies and more than 50 sectors. AlphaSense closed a $350 million round in mid-2026 at a $7.5 billion valuation, with annual recurring revenue over $600 million. That mix of scale and funding has AlphaSense hitting the jackpot on timing.
Features
- Semantic search across the filing, broker-research and transcript corpus, with Smart Synonyms expanding a query to catch industry-specific phrasing automatically.
- Generative Search that returns sourced summaries of earnings calls and filings, with a sentence-level citation behind every claim.
- An expert call transcript library covering more than 100,000 interviews across over 4,000 public companies and more than 50 sectors.
- Filing coverage for more than 68,000 public companies plus over a million private-company profiles.
- PowerPoint and Excel add-ins for pulling search results into a model or deck, plus third-party connectors.
Pricing
Seat-based, quote only. Vendr's median contract runs $17,500 a year across 38 tracked purchases, ranging $9,250 to $51,000, and competitive pressure or multi-year prepay can pull an initial quote down 20 to 30%. Expert-call access and broker research sometimes price as add-ons on top of the base seat.
Who should skip it
Solo analysts and small shops without a five-figure seat budget. G2 reviewers describe a dense filter and tag interface that takes real onboarding time, and some report the AI summarizer missing specific requests or surfacing stale figures for smaller private and Asia-listed companies. A solo analyst without that budget risks biting off more than they can chew on onboarding alone.
Why it's ranked #1. It is the only entry here that pairs alternative datasets with fundamental data in one search. It loses on breadth of exotic sources and wins on how fast an analyst gets to an answer.
FactSet
Best fit: institutional investors who want alternative data mapped to securities they already track.
FactSet aggregates third-party and alternative datasets through its Open:FactSet Marketplace, launched in 2018, and maps every one to its own entity model through the Concordance service, which resolves each vendor's identifiers against a shared symbology.
That mapping step is the part most alternative-data buyers underestimate: a dataset arrives unusable until it can be joined to the securities a portfolio already tracks. Skip that step and even a rich dataset puts you right back to square one.
FactSet has traded on the NYSE since 1996 under ticker FDS and joined the S&P 500 in December 2021. FY2024 subscription and services revenue reached $2.2 billion. The FactSet Mercury AI agent, in beta since December 2023, adds a conversational layer over pricing, fundamentals and regulatory data.
Features
- Open:FactSet Marketplace for discovering and licensing third-party datasets alongside FactSet's own proprietary feeds.
- Concordance entity mapping, which resolves a vendor's identifiers to FactSet's own entity master so a new dataset joins existing coverage.
- Zero-footprint APIs and cloud-native delivery across AWS, Google Cloud, Azure, Snowflake and Databricks.
- A hosted Quantitative Research Environment for running Python analysis against licensed datasets without separate infrastructure.
- FactSet Mercury, a conversational AI agent in beta, for pulling fundamentals, pricing and regulatory data through natural-language queries.
Pricing
Quoted, enterprise, usually as a module on an existing terminal contract. Vendr records an average contract value of $25,160 a year, ranging $4,200 to $28,179, though it doesn't disclose a purchase count for that figure. At that price, a FactSet module can cost an arm and a leg before it ever touches a proprietary alternative dataset.
Who should skip it
Teams outside institutional finance who need a single alternative dataset. FactSet's aggregation layer earns its cost only once several datasets need joining to the same entity model, so a single-dataset buyer pays for infrastructure they won't use.
Why it's ranked #2. Entity mapping across dozens of licensed datasets saves more analyst time than any single dataset provides alone. It ranks below AlphaSense because the datasets are licensed through partners; AlphaSense owns and builds its own corpus.
Best fit: quant teams with engineering capacity who want raw data and will build the signal themselves.
Bright Data offers access to over 120 domains of structured web data, delivered as feeds. Unstructured data becomes structured datasets before it reaches you.
The underlying proxy network runs more than 400 million monthly rotating residential IPs across 195 locations, plus over 1.3 million ISP and 1.3 million datacenter IPs, targetable down to country, city, ZIP or carrier.
Founded in 2014 as Luminati Networks and rebranded Bright Data in 2021, the company crossed $300 million in 2025 annual recurring revenue serving more than 20,000 customers, bootstrapped without disclosed outside funding. Building that kind of scale from scratch is rare in this market.
Features
- Dataset Marketplace of pre-built datasets across e-commerce, real estate and social media, for buyers who want records without running a scraper.
- Web Scraper API, a library of site-specific collectors for structured data from named platforms.
- SERP API for search-engine results scraping, with a free tier for testing.
- Web Unlocker, a proxy-based tool built to get past CAPTCHAs and anti-bot defenses on target sites.
- Scraping Browser, a cloud headless browser for JavaScript-heavy sites a plain HTTP request can't render.
- A proxy network of more than 400 million rotating residential IPs across 195 locations, targetable to country, city, ZIP or carrier.
Pricing
Datasets start at $2.50 per 1,000 records, so 100,000 records cost $250. The Web Scraper API starts at $0.75 per 1,000 records, the SERP API and Web Unlocker from $1 per 1,000 requests, and the Scraping Browser from $5 per GB. A managed, done-for-you data acquisition service starts at $1,500 a month, and subscribing to refreshes cuts the per-record rate by up to 80%.
New accounts get 5,000 free credits a month, renewing monthly, across the Web Unlocker, SERP API, Web Scraper API, and Scraper Studio, no card required. The Browser API joined that pool in September 2026. Free credits with no card required are about as close to no strings attached as data pricing gets.
Who should skip it
Teams without engineering capacity to turn raw feeds into a usable dataset. G2 reviewers point to pricing that lands hardest on small teams relative to enterprise accounts, a learning curve across the many overlapping products, and occasional gaps in coverage or update frequency on less common sites.
Why it's ranked #3. Broadest raw web coverage here and the most flexible. It sits third because it delivers inputs, which suits few buyers outside quant.

Try it yourself
Sign up for Bright Data
Datasets from $2.50 per 1,000 records; the Web Scraper API starts at $0.75 per 1,000.
 Visit Bright Data →
May earn a commission if you sign up through this link, at no extra cost to you. Full affiliate disclosure.
Similarweb
Best fit: fundamental investors and corporate clients tracking digital demand for named companies.
Similarweb estimates web traffic, channel mix and audience overlap. For any business selling online, it is the fastest read on demand direction between reports. It keeps a demand-side analyst up to speed without waiting for the next earnings call.
The estimate blends first-party analytics, a contributing device panel, public data crawling and partnership feeds from ISPs and measurement firms, drawing on more than 10 billion digital signals and 2 terabytes processed daily across over 100 million tracked websites and 4 million apps.
Similarweb has traded on the NYSE since its May 2021 IPO under ticker SMWB and reported $250 million in FY2024 revenue.
Features
- Web Intelligence tiers covering traffic benchmarking, channel and source analysis, and alerts on competitor activity.
- Keyword gap analysis, rank tracking and SERP-feature visibility for competitive SEO work.
- App intelligence tracking usage across more than 4 million mobile apps alongside the web-traffic data.
- A REST and Batch API on a data-credit model, with up to seven years of historical data for web, keyword and technographic fields.
- Enterprise tools including AI-driven trend and SEO agents, ad intelligence and audience-composition insights.
Pricing
Quoted. Vendr records a $37,800 median annual contract across 157 purchases, ranging from $14,220 to $96,000, with average savings near 12% off list through negotiation. Unofficial buyer data. Similarweb has since added a self-serve entry tier starting at $125 a month for individual users, with Business and Enterprise tiers still quote-only. At the top of that range, Similarweb can cost an arm and a leg before Business or Enterprise tiers even get quoted.
Who should skip it
Anyone who needs confirmed numbers won't get them here; the tool works from estimates. G2 reviewers report accuracy drifting on smaller or newer domains and figures that don't always match internal analytics, which is the tradeoff for coverage across the entire web, well beyond what any single company's own properties would show.
Why it's ranked #4. Best coverage of digital demand at a price institutional buyers can justify. Estimate accuracy on small domains is what keeps it out of the top three.
Placer.ai
Best fit: analysts covering retail, restaurants and real estate, where footfall is the leading indicator.
Placer.ai measures visits, dwell time and trade-area composition from mobile location data, giving a weekly read on store performance that no filing provides.
The panel draws on tens of millions of mobile devices treated as a representative sample of the US population, with location shown only where at least 50 unique devices were detected at a site, to protect privacy.
Founded in 2018, Placer.ai raised $75 million in mid-2024 at a $1.45 billion valuation, crossed $100 million in annual recurring revenue the same year, and now counts more than 4,300 customers, including Sony and Wegmans. That's a company on a roll, and Sony and Wegmans on the client list only reinforce it.
Features
- Visit counting from a mobile device panel, with dwell-time measurement for how long visitors stay on site.
- Trade-area analysis mapping how far a location's visitors travel from, down to zip code.
- Visitor demographic profiling, compared against a prospective tenant's target customer.
- Benchmark and competitor comparisons across brands, breakable by zip code, state or industry.
- Dashboard, API and data-feed access, with unlimited properties and chains inside a subscription.
Pricing
Quoted through a sales contact form, with a limited free version available. Placer.ai carries no listing on Vendr's marketplace, so no independent contract-value benchmark exists beyond the vendor's own quote process.
Who should skip it
Teams outside the US retail and real estate footprint Placer.ai covers best. G2 and Capterra reviewers describe gaps in specific regions and industries, data not yet populated for every center or store, and a filter and reporting interface that takes training before it feels intuitive. New users need hands-on time in the platform to know the ropes before the filters feel natural.
Why it's ranked #5. Strongest geolocation coverage for US physical retail. Panel-derived estimates need validating against known counts, which is the standard caveat for the whole category.
Revelio Labs
Best fit: private equity firms and asset managers reading headcount as a proxy for company performance.
Revelio Labs builds workforce datasets from public profiles and job postings: headcount trends, attrition, skill mix and hiring direction by function.
The underlying data spans more than 1.1 billion individual profiles, over 30 million mapped companies and more than 5 billion job postings, standardized and mapped down to subsidiaries and holding companies, with a taxonomy of more than 34,000 skills tied to inferred roles and seniority. That scale turns a single hire's title change, otherwise a needle in a haystack, into a searchable, standardized field.
Founded in 2018, Revelio Labs raised $19.5 million through a 2022 Series A led by Elephant Partners and now serves more than 150 clients across hedge funds, private equity and corporate strategy teams.
Features
- Six core datasets on different refresh cycles: Workforce Dynamics, Transitions, Job Postings, Sentiment, Layoff Notices and Individual Profiles.
- Revelio Public Labor Statistics (RPLS), a real-time alternative to BLS payroll data built from the same underlying profile and posting feeds.
- Diversity analytics segmenting the workforce by gender, ethnicity, education and geography alongside role and seniority.
- Individual-level flight-risk and prestige scoring, inferred from career trajectory and title changes.
- Delivery through API, bulk data feed and a dashboard, plus distribution via WRDS for academic use and AWS Marketplace.
Pricing
Quoted by dataset and delivery method, with API access available. Revelio Labs carries no published rate card and no priced listing on Vendr, so a buyer needs a direct quote to size the cost against a specific dataset combination.
Who should skip it
Teams that need employer-confirmed figures over inferred ones. The coverage skews toward white-collar, LinkedIn-visible roles, and individual-level fields such as seniority and flight risk come from Revelio's own inference models. RPLS has diverged from BLS by tens of thousands of jobs in a single month, so treat it as an early directional read ahead of the official print. Those inferred fields are best read between the lines until an employer-confirmed count catches up.
Why it's ranked #6. Hiring is one of the earliest observable signals of a strategy change. The data is inferred, which caps confidence and the ranking.
Panjiva
Best fit: teams covering trade-exposed sectors where shipment volumes lead reported revenue.
Panjiva compiles import and export records into supplier-buyer relationships, which exposes sourcing shifts before either party discusses them.
The database indexes more than 9 million companies and 2 billion shipment records from bills of lading, manifests and customs filings, with named data sources across roughly two dozen countries including the US, Mexico, Brazil, China, India and Turkey, plus a broader global source capped at five years of history.
S&P Global acquired Panjiva in February 2018, on terms it didn't disclose, and now sells it as part of its Capital IQ Pro and Xpressfeed product lineup.
Features
- Network View, which visualizes supplier and buyer relationships and surfaces peer or competitor connections in the same trade data.
- Search by commodity name, HS or HTS code, D-U-N-S Number, or location, with saved searches and email alerts on new activity.
- Integration with S&P Capital IQ Pro and Xpressfeed for pushing shipment data into an existing CRM or quant workflow.
- Company-level trade profiles built from bill-of-lading and customs-filing records across roughly two dozen named countries.
Pricing
Quoted, usually within an S&P Global contract. Panjiva carries no published rate card and no listing on Vendr, and S&P sells it as a single global-access product with no tiered plans, so pricing depends on the surrounding contract.
Who should skip it
Teams that need trade coverage outside the roughly two dozen countries with dedicated data sources, or contact details that stay current after export. G2 reviewers cite gaps outside the US, China and parts of Europe, GDPR limits on EU customs data, and a reporting interface capped at a limited set of dimensions. Trade lanes off the beaten path fall outside Panjiva's dedicated-source list entirely.
Why it's ranked #7. Unmatched on trade flows and irrelevant outside them. The data itself holds up.
PassBy
Best fit: institutional data buyers who want a stated accuracy figure before committing.
PassBy sells geolocation data and publishes a 94% correlation to ground truth, which is a rarer claim in this market than it should be.
The 94% figure comes from PassBy's own validation against sensors, sales data and roughly a dozen other inputs. No independent audit of that figure was found, and it traces to a device panel PassBy states runs 177 million daily devices across more than 1,400 publicly traded brands.
The current platform launched in October 2023 after PassBy acquired two smaller geospatial firms, Tamoco and Olvin, and folded them into one predictive foot-traffic product. Folding two acquisitions into one platform is meant to deliver the best of both worlds for a buyer weighing footfall vendors.
Features
- Almanac, a dashboard product for browsing footfall and trade-area data by store or market.
- AI Retail Agents, ChatGPT- and Copilot-integrated assistants for querying the underlying foot-traffic data.
- Feeds and API access for pulling raw data into an internal system or model.
- A 90-day forward-looking predictive foot-traffic feed alongside more than five years of historical data back to 2019.
- Self-reported coverage of 1.5 million store locations and more than a million trade areas.
Pricing
Quoted across three named tiers, Essential, Premium and Ultimate, with Premium adding transaction-spend data and Ultimate adding custom data feeds. No dollar figures are published for any tier, and PassBy carries no listing on Vendr.
Who should skip it
Buyers who want a claim checked against independent review data. PassBy shows close to no third-party review coverage on G2 or Capterra, its accuracy and coverage figures all trace back to its own marketing content, and the current platform has run in its present form only since October 2023.
Why it's ranked #8. Publishing a correlation figure at all is a mark in its favour. Coverage and track record are shorter than Placer.ai's, which is why it sits below.
Volza
Best fit: importers, exporters and sourcing teams that want self-serve trade data without a quote call first.
Volza compiles bills of lading and customs shipment records into buyer, supplier and product-level search across more than 200 countries, with a free trial a buyer can start on their own. A buyer can start that trial at the drop of a hat, with no sales call standing in the way.
The database indexes more than 3 billion shipment records, with detailed coverage across 203 countries (12 exclusive, 30 premium) on the SME and Corporate plans, and history running back to 2014 on every paid tier. Volza describes itself on its own site as a UAE-based trade research company, sourcing records from customs departments, trading authorities, government agencies and private data partners.
Features
- Buyer and supplier search by company name, product or HS code, with pivot analysis across consignee, shipper, port and country.
- Verified decision-maker contacts, phone, email and LinkedIn, for up to 70% of the companies a search surfaces.
- A buyer-supplier CRM and relationship pivot for tracking who ships to whom over time.
- Email alerts and a "What's New" feed for tracking a named company or product as fresh shipments post.
- An API and 30-plus prebuilt dashboards for teams that pull the data straight into an existing BI or CRM workflow.
Pricing
A free plan runs 7 days with unlimited searches and a small starting credit. The paid Startup, SME and Corporate tiers publish no dollar figures on Volza's own pricing page; they gate instead on shipment-download credits (360,000 to 2.4 million a year) and verified-contact unlocks (150 to 1,000 a year). Volza backs paid plans with a refund if a buyer finds no profitable lead in the data. That refund policy lets actions speak louder than words.
Who should skip it
Buyers who need one quoted contract number before budget gets approved. Volza holds a 4.7 out of 5 rating on Capterra from 24 reviews, and reviewers there flag the free plan's credits running out fast and the subscription cost landing high against a single market's worth of data.
Why it's ranked #9. A self-serve free trial and a wider country count beat Panjiva's quote-only, roughly two-dozen-country footprint. It sits below Panjiva because it skips the S&P-enriched company profiles and Capital IQ integration Panjiva sells, and its own paid pricing stays unpublished past the free trial.
Try it yourself
Start a free trial of Volza
7 days, unlimited searches, no card required.
May earn a commission if you sign up through this link, at no extra cost to you. Full affiliate disclosure.
What an alternative data platform costs
Hedge funds spend over $1.6 million a year on alternative data on average, and that figure covers the datasets alone. The datasets are just the visible spend. Against total program cost including staff, that $1.6 million can be a drop in the bucket.
The headcount is the hidden line. An estimated 1,190 full-time alternative data employees existed across the industry in 2017, and the ratio of staff to datasets has not improved since.
Alternative data vendors price by dataset, by entity coverage and by delivery method. Raw data is cheapest, mapped data costs more, and a platform that runs the analysis costs most.
Data quality and regulatory compliance are the two standing challenges. Sourced data must comply with GDPR and CCPA, and personally identifiable information in a location or transaction feed is a legal problem.
See the rate card yourself
Compare Bright Data pricing
Refresh subscriptions cut the per-record rate by up to 80%; the SERP API and Web Unlocker start at $1 per 1,000 requests.
Visit Bright Data →
May earn a commission if you sign up through this link, at no extra cost to you. Full affiliate disclosure.
Alt data for consumer behavior and competitive intelligence
Alt data started as an edge for hedge funds and has become market intelligence for operators. Corporate clients now buy the same feeds their investors read.
Alternative data can reveal business patterns not visible in conventional reports, and those insights often surpass traditional financial reports in predictive power because they arrive first.
For competitive intelligence, the use is direct. Web traffic shows a rival's demand, job postings show what they are building, shipment records show what they are sourcing, and none of it waits for an earnings call. Keeping an eye on all three at once beats waiting for a single quarterly print.
For consumer behavior, transaction and geolocation feeds answer questions surveys ask badly: what people bought, where they went, how often they came back.
Alternative data improves due diligence and portfolio monitoring, and it helps investors anticipate trends before formal disclosures. Read alongside fundamental data.
How investors turn alt data into decisions
Non traditional datasets earn their cost where they change investment decisions. The purchase itself proves nothing. Most alt data programmes fail in the gap between the two.
The datasets that inform investment decisions are the ones tested against a thesis. Investment strategies built on a feed nobody backtested inherit the vendor's marketing as an assumption.
From data sets to market signals
Raw feeds are inputs. Someone has to analyze data against a hypothesis, and data analysis of a single dataset in isolation produces coincidence.
Pick a company you already understand, pull the dataset for a period you can check, and see if the series would have told you what the filing eventually did. That backtest is what separates investment research from dataset shopping.
Real time data matters more here than in most categories, because the entire edge is arriving before traditional sources do. A feed delivered monthly has already given the advantage away.
Where it fits across strategies
Public financial markets use alt data for earnings prediction and thesis testing. Private markets use it for diligence, where target companies disclose less and a workforce or web traffic series is one of few external reads on business performance.
Corporate teams use the same data sets for brand performance tracking and competitive benchmarking, which is the same analysis with a different question attached.
Weather patterns, government contracts and patent filings sit in the long tail. Each is decisive in one sector and noise in every other, which is why market data breadth matters less than fit.
Compliance and risk management
Compliance and risk management run alongside every purchase. Legal review covers the collection method as well as the licence, which is what enables teams to use a dataset without inheriting the vendor's exposure.
Data driven decisions built on a feed you cannot explain to a regulator are a liability dressed as actionable insights. Ask how the data was collected, from whom, and under what consent, before the first invoice.
Alternative data FAQ
What is alternative data?
Non-traditional data used to assess company performance and market trends: transactions, web traffic, satellite imagery, geolocation, job postings, app usage and sentiment. It sits alongside traditional data sources such as financial statements and regulatory filings.
Who buys alternative data?
Hedge funds, asset managers, private equity firms and institutional investors, increasingly joined by corporate strategy teams using the same feeds for competitive benchmarking.
How big is the alternative data market?
It reached $18.74 billion in 2025, with projections of $135.8 billion by 2030. That compound annual growth rate is why every data vendor now describes itself as an alternative data platform.
Is alternative data legal?
Yes, where sourcing and processing comply with GDPR, CCPA and the relevant market rules. The risks are personally identifiable information in raw feeds and material non-public information reaching an investment process, and both are diligence questions.
What is the most useful alternative data source?
It depends on the asset classes and sectors you cover. Transaction data for consumer names, geolocation for physical retail, web traffic for digital businesses, shipment records for industrials, energy asset data from Enverus. No single source works across all of them.
Explore the raw feeds
Start with Bright Data
Over 120 domains of structured web data, backed by a proxy network spanning 195 locations.
Visit Bright Data →
May earn a commission if you sign up through this link, at no extra cost to you. Full affiliate disclosure.
Bottom line
Match the dataset to what you cover, then check the mapping. Most alternative data disappoints because nobody joined the vendor's entities to the portfolio. The data itself was usually fine, and the join was never builng. The devil's in the details, and the join is the detail almost everyone skips.
AlphaSense and FactSet for research breadth, Bright Data for raw inputs, Similarweb for digital demand, Placer.ai and PassBy for footfall, Revelio Labs for workforce intelligence, Panjiva or Volza for trade.
Then run it against a period you already understand. Alt data that cannot explain last year is not going to predict next quarter.