Real estate data providers: 10 platforms ranked for 2026
 By Jan Suski. I go deep on every review, checking every number against its source and digging up details other coverage misses, a habit from six years of SEO and link building for tech companies. Bylines at Surfer, Brand24, and Senuto. How the scoring works.
· Prefer this source on Google
Quick comparison of real estate data providers
Most of this category quotes per deal. Where a provider publishes a rate, the column carries it; otherwise it names the basis a quote is built from.
| # | Provider | Strongest coverage | Owner | Data delivery | Pricing |
|---|---|---|---|---|---|
| 1 | CoStar | Commercial real estate, tenants and leases | Public (NASDAQ: CSGP) | Platform, limited export | Quoted, by seat and market |
| 2 | Cotality | Residential records, mortgage and valuation | Stone Point Capital and Insight Partners | Bulk, API, cloud | Quoted, by dataset |
| 3 | ATTOM | Nationwide property records and events | Lovell Minnick Partners | API, bulk, cloud, flat file | Quoted, by attribute set |
| 4 | MSCI Real Assets | Institutional transactions and benchmarks | MSCI (NYSE: MSCI) | Platform and data feeds | Quoted, enterprise |
| 5 | Reonomy | Commercial property ownership and contacts | Altus Group | Platform and API | Quoted, by market |
| 6 | Cherre | Integration of everything above | RealPage, since July 2026 | Warehouse-native connectors | Quoted, by connector count |
| 7 | Crexi Intelligence | Commercial listings, comps and buyer demand | Private, $45.3M raised | Platform | Free tier, paid tiers quoted |
| 8 | Placer.ai | Foot traffic and trade area behaviour | Private, venture-backed | Platform and API | Quoted |
| 9 | Bright Data | Listings scraped from public web sources | EMK Capital | Datasets and scrapers | From $2.50 per 1,000 records |
| 10 | BatchData | Investor-focused property and contact data | Private | API and bulk | Quoted, by volume |
Real estate data providers sell the same underlying public records to everyone, then compete on what they do with them. County records, assessor files and recorded deeds are a dime a dozen once you know where to look, available to any buyer willing to collect them from 3,000 jurisdictions. What you pay a data provider for is the normalization, the entity resolution and the data delivery.
That is why coverage claims stop being useful quickly. ATTOM covers 158 million US properties across 9,000 attributes. Cotality holds 5.5 billion property records collected over 50 years. Both numbers are real, and neither tells you if the provider has the one field your model needs at the refresh rate your workflow assumes.
The real estate industry runs on a handful of upstream sources, and the property data providers reselling them differ more in delivery than in substance. Ten real estate data providers are ranked below on record coverage, how the data arrives, and how much reconciliation work lands on your side after the contract is signed.
Ownership has consolidated hard in this category, which matters when a provider's roadmap decides your renewal. Seven of the ten are owned by a larger parent or a private equity firm, and one changed hands this month: RealPage acquired Cherre on 14 July 2026. Ownership, funding and pricing were verified on 27 July 2026.
How to evaluate real estate data providers
Coverage against your actual footprint
National coverage numbers hide county-level gaps, so reading between the lines matters more than the headline count. A provider strong across California real estate markets can be thin in the three Midwest counties where you buy. Ask for a county-level fill-rate report on your target markets before comparing headline property records counts.
Refresh rate measured field by field
Property characteristics change slowly. Ownership records change at closing. Distressed property indicators and lien data change constantly. A provider quoting one refresh cadence for the whole database is describing its slowest field. Market conditions move faster than assessor files, and a stack that treats both as current will misprice.
Data delivery and how it reaches your systems
This is where most real estate data buyers overspend. A platform seat suits an analyst doing property research by hand. Bulk data or an API suits a model. Paying platform prices for data your code consumes is the standard mistake in this category, and it can cost an arm and a leg at scale.
Entity resolution across sources
The same building appears under different owner names, LLC structures and assessor's parcel number formats across sources. Ask how the provider resolves an entity, because a stack that cannot join CoStar to your own records reliably produces two views of one asset.
Licensing, redistribution and compliance
Most contracts restrict what you may show a client, publish, or feed into a model. Confirm redistribution rights before pricing, since the same real estate data costs materially more when the licence permits downstream use.
Compliance posture is the other half of the licensing question, and it works the same way across every category in the data providers guide. ATTOM, Cotality, Bright Data and the Datarade marketplace all publish GDPR and CCPA compliance documentation; PropertyShark publishes little about its own, a red flag, which is the practical reason it stays off regulated shortlists.
Ownership and roadmap risk
A data provider inside a larger parent serves that parent's strategy first. CoStar is folding Domain into Homes.com, Cotality answers to a private equity board, and Cherre now sits inside RealPage. None of that is disqualifying, and all of it belongs in a three-year contract decision.
Top real estate data providers, ranked
CoStar
Best fit: commercial real estate teams that need the market standard for tenants, leases and comparable transactions.
CoStar is the default CRE data source in North America. Its researchers verify lease and sale comps by phone, the reason the data holds up under due diligence and the reason it costs what it does.
CoStar Group trades on the Nasdaq and is buying aggressively. Full year 2025 revenue reached $3.25 billion, up 19% year over year, with adjusted EBITDA of $442 million, up 83%, and net income of just $7 million after acquisition costs. It closed the $1.6 billion Matterport acquisition in February 2025 and launched a $1.7 billion takeover of Australia's Domain, which is being folded into Homes.com.
Guidance for 2026 runs $3.78 billion to $3.82 billion, and the company has said it will cut Homes.com spending by more than $100 million a year through 2030.
CoStar is also in hot water, fighting five lawsuits at once, including a $1 billion+ copyright claim against Zillow and two customer antitrust suits over its market share.
Key features
Verified lease and sale comps across major commercial property types. Tenant rosters by building with lease expiry detail. Property, owner and broker records. Market analytics with rent and vacancy forecasts, and market trends by submarket. LoopNet listings inside the same product line.
Pricing
Quoted per seat and per market. Multi-market access multiplies quickly, and export rights are the negotiation point most buyers miss.
Pros
Comp verification no rival matches. Tenant and lease depth that decides CRE underwriting. Universal enough that counterparties recognise the numbers.
Cons
Seat pricing punishes wide rollouts. Export and API access is deliberately restricted. Residential coverage is incidental.
Why it's ranked #1. It holds the commercial real estate data other providers benchmark against, and the verification process behind the comps is the reason.
Our CoStar review covers the platform in detail.
Cotality
Best fit: residential lenders, insurers and analysts who need the deepest property record history available.
Cotality, renamed from CoreLogic after its March 2025 rebrand, manages 5.5 billion property records collected over 50 years. The archive depth is the product.
The company has been private since 2021, when Stone Point Capital and Insight Partners took CoreLogic off the public markets in a deal worth roughly $6 billion in equity. Patrick Dodd has run it as president and chief executive since 2022, reporting to a board appointed by the two owners, who call the shots on both the technology rebuild and the rebrand.
Key features
Property records, tax records and ownership history at national scale. Mortgage data and lien data from recorded documents. Automated valuation models with published accuracy metrics. Climate and hazard risk scoring per parcel, now a standard input in acquisition screening. Bulk data, API and cloud delivery including Google Cloud Storage.
Pricing
Quoted by dataset and delivery method. Historical archives price separately from current records.
Pros
Longest history in the category, which matters for any model needing a full cycle. Mortgage and credit data alongside property characteristics. Delivery options suit engineering teams.
Cons
Enterprise contracting and procurement cycles. Commercial property coverage trails CoStar. The rebrand still confuses search and documentation.
Why it's ranked #2. Unmatched on residential depth and history, and it sits below CoStar only because the commercial side is where the money concentrates.
ATTOM
Best fit: teams building products on property data who want breadth of attributes over platform features.
ATTOM Data Solutions covers 158 million US properties with 9,000 property data attributes and more than 70 billion rows of transactional information, sold as data. Lovell Minnick Partners has owned it since January 2019, in a deal whose terms weren't disclosed, mum's the word on the price.
Key features
Property characteristics, sales history, tax and assessment records nationwide. Foreclosure data and distressed property indicators. Neighbourhood boundaries, demographics boundaries points and school data. Recorded document images. API, bulk data, flat file and cloud delivery, with published GDPR and CCPA compliance.
Pricing
Quoted by attribute set and volume. Narrow attribute selections price well below full-file access.
Pros
Attribute breadth few rivals approach. Delivery flexibility suits any architecture. Data samples available before commitment.
Cons
No analytics layer, so the interpretation is yours. Commercial coverage is thin. Support expects a technical buyer.
Why it's ranked #3. The best raw property data on this list, ranked here because raw data needs a team that can use it.
MSCI Real Assets
Best fit: institutional investors benchmarking portfolio performance against the wider market.
MSCI Real Assets is built on Real Capital Analytics, which MSCI acquired for $950 million in cash in a deal completed on 13 September 2021. It tracks institutional transactions and publishes the indexes capital markets participants price against. Its sister unit, MSCI ESG Research, covers 17,000+ issuers and takes first place in our list of the best ESG data providers.
Key features
Transaction records across global institutional deals. Property indexes and benchmarks for portfolio management. Capital flows analysis by buyer type and geography. Market forecasts on major metros, typically projecting trends over the next twelve months. Fund-level performance comparison.
Pricing
Quoted, enterprise, typically annual with index licensing separate.
Pros
The benchmark data institutional investors are measured against. Genuine global transaction coverage. Capital markets view no other provider here offers.
Cons
Built for institutions and priced accordingly. Thin below the institutional deal size threshold, a drop in the bucket by MSCI's own measure. Little use for property-level research.
Why it's ranked #4. Essential for one specific buyer and irrelevant to everyone else, which is what separates it from the three above.
See the MSCI Real Assets review.
Reonomy
Best fit: commercial brokers and investors who need to reach the owner behind an LLC.
Reonomy focuses on commercial property ownership: who owns a building, which entity holds it, and how to reach a decision maker. Altus Group bought it for $201.5 million in cash in a deal that closed on 12 November 2021, and it now sells inside the Altus product line.
Key features
Ownership records resolved through LLC and trust structures. Contact details for owners and decision makers. Property search across commercial real estate markets with sales comps. Debt and mortgage records per asset. API access for pipeline automation.
Pricing
Quoted by market coverage and seat count.
Pros
Best ownership resolution for off-market sourcing. Contact data attached to the entity. Search built for prospecting.
Cons
Contact accuracy varies by market. Lease and tenant depth trails CoStar. Coverage is US-only.
Why it's ranked #5. The strongest answer to one question, and the question is narrower than the four ranked above it.
Cherre
Best fit: teams that already buy from three real estate data providers and can't join the files.
Cherre is a connection layer playing jack of all trades among real estate data sources. It ingests CoStar, Cotality, internal systems and public records, resolves them to a common property identity, and lands the result in your warehouse.
Its ownership changed this month. RealPage acquired Cherre on 14 July 2026, after Cherre had raised $105 million across its funding history, most recently a $30 million Series C in September 2024 at a reported $150 million valuation.
Buyers evaluating Cherre on its vendor-neutral positioning should ask directly how that neutrality survives inside a property management software company. The answer decides if the integration layer stays independent of the sources it integrates.
Key features
Pre-built connectors to major real estate data providers. Entity resolution across sources to one property identity. Warehouse-native data delivery. Internal portfolio data integrated alongside licensed feeds. Governance and lineage on every field.
Pricing
Quoted by connector count and data volume.
Pros
Solves the reconciliation problem the rest of this list creates. Warehouse-first architecture suits analytics teams. Vendor-neutral by original design.
Cons
Adds cost on top of the data you already license. Value depends on already owning several feeds. Needs a data team to be worth it. New parent company with its own data products.
Why it's ranked #6. It fixes a real and expensive problem, and only for buyers far enough along to have created it.
Read the Cherre review for how the integration works.
Crexi Intelligence
Best fit: commercial brokers who want listings, comps and buyer demand signals without CoStar pricing.
Crexi built a commercial listings marketplace and layered intelligence on the activity running through it, which gives it demand signals CoStar cannot see. It has raised $45.3 million from investors including Founder Collective, Industry Ventures and Karlin Ventures, making it the smallest balance sheet among the platform providers here, a drop in the bucket next to CoStar's.
Key features
Commercial listings with sale and lease comps. Buyer and broker activity signals from marketplace behaviour. Ownership and property records. Market analysis by submarket and asset type. Free tier covering basic property search.
Pricing
Free tier available, with paid intelligence tiers quoted.
Pros
Buyer demand data unique to its marketplace position. Materially cheaper than CoStar for many brokers. Free tier makes evaluation trivial.
Cons
Comp depth trails CoStar in established markets. Coverage skews to listed assets. Younger dataset with less history.
Why it's ranked #7. Real differentiation on demand signals, held back by a shorter record history than the providers above.
The Crexi Intelligence review has the detail.
Placer.ai
Best fit: retail, industrial and mixed-use investors underwriting on actual visitation.
Placer.ai measures foot traffic from mobile location data, cutting to the chase on a question property records cannot answer: how many people go there.
Key features
Visit counts and trends per property and chain. Trade area analysis with visitor demographics. Competitor location benchmarking. Dwell time and visit frequency. Site selection scoring against comparable locations.
Pricing
Quoted, scaled by locations tracked and users.
Pros
Measures behaviour. Retail and mixed-use underwriting evidence no records-based provider offers. Fast to demonstrate value on a known asset.
Cons
Panel-based estimates need calibration against ground truth. Limited value for office or industrial without visitation. No ownership or transaction data.
Why it's ranked #8. A different data type entirely, and it earns its place for the asset classes where visitation drives value.
Our Placer.ai review covers the methodology, and the tool also appears in our alternative data providers ranking.
Best fit: engineering teams assembling their own real estate dataset from public web sources.
Bright Data collects listings, prices and property-related data from public websites at scale, serving more than 20,000 customers across every data category. It started in 2014 as Luminati Networks, a division of Hola VPN, was sold to London private equity firm EMK Capital in 2017 at a valuation around $200 million, and took the Bright Data name in March 2021.
Key features
Real estate datasets covering listings across global markets. Custom scrapers for specific portals and geographies. Structured delivery as JSON, CSV or Parquet. Refresh subscriptions on collected datasets. GDPR and CCPA compliance documentation.
Pricing
Datasets from $2.50 per 1,000 records, so 100,000 records costs $250, nowhere near costing an arm and a leg. Refresh subscriptions cut the per-record rate by up to 80%. New accounts also get 5,000 free credits a month, renewing monthly, across the Web Unlocker, SERP API, Web Scraper API, and Scraper Studio, no card required. The Browser API joined that same pool in September 2026.
Pros
Cheapest per-record option here by a wide margin. Published pricing in a category that hides it. Global coverage where US-focused rivals stop.
Cons
Listings data without authoritative recordation. No ownership, tax or lien coverage. You build the normalization yourself.
Why it's ranked #9. Excellent value for a specific technical buyer, and it is a different product from the authoritative property records above it.

See the listings data yourself
Sign up for Bright Data
Real estate datasets from $2.50 per 1,000 records, the cheapest per-record option in this ranking.
 Visit Bright Data →
May earn a commission if you sign up through this link, at no extra cost to you. Full affiliate disclosure.
BatchData
Best fit: residential investors running direct-to-seller acquisition at volume.
BatchData covers more than 155 million US properties with over 1,000 data points per property, packaged for investors doing outreach.
Key features
Property records with owner contact details and skip tracing. Distressed and life-event indicators for lead targeting. Property valuation estimates. List building and export for campaigns. API for pipeline automation.
Pricing
Quoted, scaled by record volume and skip-trace usage.
Pros
Contact data attached to property records in one buy, killing two birds with one stone for outreach-focused teams. Built for acquisition workflows. Practical for small investor teams.
Cons
Aimed at residential investors, so institutional use is limited. Contact accuracy varies. Commercial coverage is minimal.
Why it's ranked #10. Well built for its buyer, and the narrowest use case on this list.
Other real estate data providers worth a shortlist
Zillow supplies MLS data and public records behind the Zestimate automated valuation model, and its research feeds are free for market analysis. HouseCanary sells residential valuation and forecasting to lenders, and ranks fourth in our real estate intelligence platforms ranking.
Yardi Matrix covers multifamily and commercial fundamentals for property managers. Moody's Analytics CRE, formerly Reis, sells commercial market forecasts. ICE Mortgage Technology, built on the Black Knight business, holds mortgage servicing records.
PropertyShark and NeighborhoodScout serve smaller property research budgets, though PropertyShark publishes little about its compliance posture.
Two others solve the sourcing problem differently. Datarade is a marketplace, connecting buyers to more than 500 data providers across property and adjacent categories, with GDPR and CCPA compliance standards applied across listings, which makes it a reasonable first stop when you don't yet know who holds the field you need.
Dwellsy IQ covers 17 million rental listings collected since 2020, useful for rental market analysis that national property files handle poorly.
Testing data quality before you sign
Coverage claims are marketing. Data quality is what survives a sample, and every provider here will supply one if you ask.
Fill rate by field
Request a sample covering your own counties, then count how many rows carry the fields you use, since actions speak louder than words once a claim meets an actual file. A file with 9,000 available attributes and a 30% fill rate on ownership data is thinner than a narrow file that is complete.
Accuracy against a known answer
Pick twenty properties you know well and check the provider against them. Property event flags, sale prices and owner names are the fields worth testing, since those are what a decision hangs on.
Freshness on the fields that move
Compare the provider's most recent recorded document against the county's own portal. A two-week lag is normal; a two-month lag on distressed indicators makes the feed useless for acquisition.
Data access and how quickly you get it
Some providers grant immediate access to a sandbox. Others take six weeks to provision. Direct access to a test environment during evaluation tells you what support will feel like afterwards.
Sample before you commit
Request a Bright Data sample
Real estate datasets deliver as JSON, CSV or Parquet, with GDPR and CCPA compliance documentation included.
Visit Bright Data →
May earn a commission if you sign up through this link, at no extra cost to you. Full affiliate disclosure.
What real estate data contains
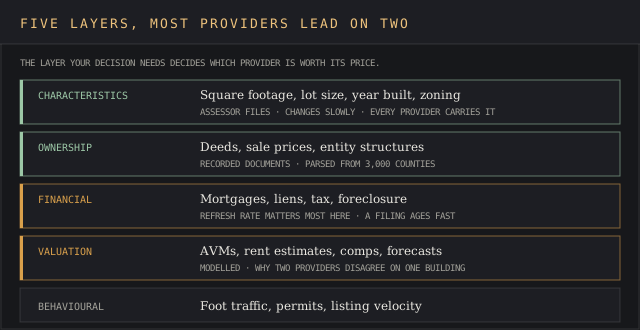
The category splits into five data types, and most providers lead on two.
Property characteristics
Square footage, lot size, year built, unit mix, zoning. Slow-changing attributes sourced from assessor files and county records. Every provider here carries them, and the difference is coverage completeness.
Ownership and transaction records
Deeds, sale prices, ownership history and the entity structures behind them. Sourced from recorded documents, which means accuracy depends on how well a provider parses 3,000 counties with different formats.
Financial and property data on the asset
Mortgage balances, lien data, tax assessments, foreclosure filings. This layer decides distress screening. Refresh rate matters most here, racing against the clock because a filing is only useful while it is current.
Valuation and market analytics
Automated valuation models, rent estimates, market forecasts, sales comps. Rental market insights sit here too: occupancy, asking rents and concession trends by submarket. Modelled, which is why two providers report different property value estimates for the same building. Predictive analytics in this layer typically forecasts a twelve-month horizon.
Behavioural and alternative signals
Foot traffic, permit filings, listing velocity. The newest layer and the one least standardised, which is what makes it useful for edge and risky to underwrite on alone.
How real estate professionals use each layer
Real estate investors screening acquisitions need transaction records and valuation together, since a comp without a current market condition read produces a stale number. Historical transaction data also carries the risk signal: a neighbourhood's price and turnover history identifies instability before it shows up in a listing.
Mortgage brokers and insurance agents work from ownership records and property characteristics, where field-level accuracy matters more than breadth.
Residential real estate agents mostly need MLS data and neighbourhood context, which the free and low-cost tiers cover adequately. Property managers need unit-level detail that national providers rarely carry, which is why multifamily specialists survive alongside the giants.
Negotiation is the use case buyers underrate. Walking into a deal with verified comps, a current ownership record and a market statistic the other side cannot dispute changes the conversation.
Institutional investors combine several sources by default, the whole nine yards on data coverage. That is the reason Cherre exists, and the reason a multi-vendor stack is the normal end state.
Building a real estate data stack
Start with the use case and buy the narrowest thing that answers it. A single question rarely needs a platform.
Match delivery to the consumer
If a person reads it, buy a seat. If a model reads it, buy bulk data or an API. Teams that get this backwards pay platform prices for files and API prices for research, and both mistakes are expensive at renewal.
For the vendors built specifically to sell that bulk data, see our data-buying companies ranking.
Validate before you commit
Request data samples covering your actual target counties, then check fill rate field by field. Most providers supply samples, and the ones that resist are telling you something about coverage.
Budget for more than one provider
No single provider covers commercial and residential, records and behaviour, national breadth and local depth. Planning for two or three from the start produces a cleaner architecture than bolting a second feed on later.
The data providers guide covers how this category sits against the B2B, company and alternative data markets, and our property market intelligence guide covers the wider research workflow. For the investor-side view, see real estate market intelligence for investors.
Integrating real estate data into existing systems
Buying the data is the cheap half. Getting it to integrate data cleanly with what you already run decides if anyone uses it.
Where the platform delivers against where you work
A platform delivers dashboards and exports. A warehouse delivers joins. Teams running advanced analytics on property intelligence need the second, and paying for the first and then exporting to CSV is the pattern that wastes the most budget in this category, a reminder that money doesn't grow on trees even at enterprise renewal time.
Workflow automation on the feed
The operational gain comes from removing manual steps: a lien filing that triggers a review task, a valuation refresh that updates a pipeline record, an ownership change that reassigns an account. A feed nobody has automated against is a subscription to a file.
Data enrichment on records you already hold
Most buyers already have a portfolio list, a pipeline or a lender's book. Enriching those records with ownership data and property related data usually costs less than licensing a full national file, and it answers the question faster.
Joining residential and commercial sources
Residential properties and commercial assets sit in different files with different identifiers, even inside one provider. A stack covering both needs an entity resolution step, which is one of the key elements buyers underestimate most often.
Financial insights from combined sources
Layering mortgage data over transaction history produces financial insights neither file carries alone: equity position, refinance likelihood, distress probability. The key factors are the join accuracy and the refresh gap between the two feeds.
Real estate data providers FAQ
What is the best source for real estate data?
CoStar for commercial real estate, Cotality for residential depth, ATTOM for raw property records at national scale. The best source depends on which of the five data layers your decision needs.
What is the best database for commercial real estate?
CoStar holds the deepest verified CRE data on tenants, leases and comps. Reonomy is stronger on ownership resolution, and Crexi is cheaper with better buyer demand signals.
Where does Zillow get its property data?
From MLS feeds and public records, combined with user-submitted updates. The Zestimate applies an automated valuation model on top, which is an estimate.
Is there a site like Zillow for commercial property?
LoopNet is the closest consumer-facing equivalent and sits inside the CoStar product line. Crexi is the main independent alternative with a marketplace of its own.
How much do real estate data providers cost?
Most quote per deal. Published exceptions exist: Bright Data starts at $2.50 per 1,000 records and Crexi offers a free tier. Platform seats at CoStar and enterprise datasets at Cotality run into five and six figures annually.
How often is property data updated?
Recorded documents reach providers within days to weeks of filing, varying by county. Listings update daily. Assessments update annually. A single refresh figure for a whole database describes its slowest feed.
Can I get real estate data through an API?
ATTOM, Reonomy, BatchData, Cherre and Bright Data all offer API and bulk delivery. CoStar deliberately restricts programmatic access, which is a common reason buyers add a second provider, unwilling to put all their eggs in one basket.
Who owns these providers?
CoStar and MSCI are public companies. Cotality is owned by Stone Point Capital and Insight Partners, ATTOM by Lovell Minnick Partners, Bright Data by EMK Capital, Reonomy by Altus Group, and Cherre by RealPage as of July 2026. Crexi, Placer.ai and BatchData remain independent.
Compare against platform pricing
Get started with Bright Data
100,000 listings records cost $250 to start, and refresh subscriptions cut that rate by up to 80%.
Visit Bright Data →
May earn a commission if you sign up through this link, at no extra cost to you. Full affiliate disclosure.
Bottom line
Decide which of the five data layers drives your decision, then buy the provider that leads on it. CoStar for commercial verification, Cotality for residential history, ATTOM for raw breadth, Placer.ai for visitation, Cherre when you already own three feeds and cannot join them.
Ask every provider for a data sample covering your own target counties before you compare price. County-level fill rate settles more evaluations than any headline coverage number.
Check the owner in the same pass. Seven of these ten answer to a parent or a private equity board, and the roadmap you buy in year one belongs to whoever holds the company in year three.