Reports

Market intelligence reports and snapshots.

Category reports, market snapshots, and research briefs that back up the rankings and buyer guides with underlying data.

·

Nothing matches that. Press Escape to clear the box.

Vendor pricing

Per-vendor pricing breakdowns: published rate cards, Vendr medians, and the negotiation levers that move a quote.

Vendor pricing

Data Axle pricing: $99 a month for Salesgenie, a sales quote for the rest

Data Axle prints two rate cards and quotes the rest, credits included. Salesgenie runs $99 to $299 a month on a 12-month first term, and the API $25 to $75 per 1,000 records.

Read the report
Vendor pricing

SISTRIX pricing

SISTRIX sells four self-serve packages from €119 to €799 a month, billed in euros. Premium rose 33% in 2024, from €599 to €799.

Read the report
Vendor pricing

AccuRanker pricing

AccuRanker sells 2,000 to 25,000 tracked keywords for $249 to $1,569 a month on monthly billing. Per-keyword cost halves across that range, from $0.125 to $0.063.

Read the report
Vendor pricing

Attio pricing

Attio publishes every self-serve rate and raised Plus to $35 and Pro to $79 a seat in July 2026. Plus now stops at 10 seats, so an 11th user lifts a $4,200 year to $10,428.

Read the report
Vendor pricing

Folk CRM pricing

Folk publishes its whole rate card, from $24 to $80 a member a month billed annually. Enrichment credits are pooled per workspace, so 500 on Standard split across ten members leaves 50 each.

Read the report
Vendor pricing

Muck Rack pricing

Muck Rack lists Starter, Standard and Premier with no price on any of them, and its own guide puts the range at $5,000 to $53,000 a year. Vendr tracks a $13,000 median across 80 purchases.

Read the report
Vendor pricing

RB2B pricing

Four public plans run from $0 to $50,000 a month, billed month-to-month. One identified visitor costs 33.2 cents on the smallest Pro+ tier and 2 cents at 2.5 million.

Read the report
Vendor pricing

UserTesting pricing

UserTesting puts no price on its plans page, yet its AWS Marketplace listing sells the Advanced edition at $30,000 a year for 2,000 Session Units and two seats. Vendr tracks a $41,200 median across 359 purchases.

Read the report
Vendor pricing

Demandbase pricing

Demandbase puts no price on its own site, yet its AWS Marketplace listing sells Demandbase One at $215,000 for 12 months. Vendr tracks a $68,591 median across 187 purchases.

Read the report
Vendor pricing

SpyFu pricing

SpyFu's checkout page sells Basic, Pro + AI and Team/Agency at $29 to $187 a month billed annually, while an older list with $33 and $79 plans stays online. Team/Agency costs less than Pro + AI from the fifth user, $187 against $209.

Read the report
Vendor pricing

Woodpecker pricing

Woodpecker meters cold email on contacted prospects, from $35 a month for 500 to $10,312 for 1,000,000, with seats and email accounts free. The rate per 100 prospects falls from $7.00 to $1.03 across the calculator.

Read the report
Vendor pricing

Gong pricing

Gong prices seat licenses, a platform fee, five applications and AI credits by quote only. Vendr tracks a $55,359 median contract across 1,145 purchases.

Read the report
Vendor pricing

PitchBook pricing

PitchBook keeps its rate card private, so the prices come from UK government order forms. A seat listed at $7,000 a year, and an 18-user block closed at $5,600 each.

Read the report
Vendor pricing

Cision pricing

Cision quotes every CisionOne package, so the numbers come from Vendr, PR Newswire's 2024 card and Cision's own terms. The median tracked contract is $12,625 across 107 purchases.

Read the report
Vendor pricing

Sensor Tower pricing

Sensor Tower quotes every deal, and each contract renews itself unless notice lands 90 days out. Vendr's 40 tracked purchases put the median at $75,000 a year, from $29,500 to $115,460.

Read the report
Vendor pricing

Placer.ai pricing

Placer.ai keeps its rate card behind a sales form, so the prices come from council packets. Nine public order forms put a year at $12,000 to $34,000, split by a 104-credit or 260-credit report allowance.

Read the report
Vendor pricing

Feedly pricing

Feedly sells its RSS reader at $0, $83.88 or $146.76 a year and its Market Intelligence team plans at $19,200 or $28,800. Pro+ costs $107.16 in its first year and renews 37% higher at $146.76.

Read the report
Vendor pricing

Trustpilot pricing

Trustpilot bills every paid plan per domain on a 12-month contract that renews itself unless cancelled 30 days out. Its average paying customer spends $11,513 a year, against $9,588 for one Premium domain at list.

Read the report
Vendor pricing

Qualtrics pricing

Qualtrics publishes one paid price and puts its Customer Experience and Employee Experience suites behind a quote. The online research plan costs $5,040 a year for 1,000 responses, and Vendr's median quoted contract is $30,000.

Read the report
Vendor pricing

Hootsuite pricing

Hootsuite sells three self-serve tiers at $99, $199 and $399 per user a month, and an 11th social account moves every seat onto Professional. Vendr's median Hootsuite contract runs $12,316 a year across 75 purchases.

Read the report
Vendor pricing

ATTOM Data pricing

ATTOM prints one price, $499 a year for a Property Navigator seat, and quotes every API, bulk and cloud contract through sales. Its only published API example, $1,000 a month for 100,000 reports, gets its own unit cost wrong by a factor of ten.

Read the report
Vendor pricing

Tegus pricing

Tegus is now sold through AlphaSense, and neither company publishes a subscription price. Vendr tracks a $30,000 median Tegus contract, and every expert call adds about $450 an hour plus a flat $75 fee.

Read the report
Vendor pricing

Reonomy pricing

Reonomy sells Monthly and Annual seats online with no dollar figure on its pricing page, and feeds and the API go through sales. Annual billing saves 30% and includes 1,000 exports a month.

Read the report
Vendor pricing

Capterra pricing

A $0 listing, then Promote and Grow budget bands up to $2,000 and $10,000 a month, billed per click, per lead and per meeting. G2 bought Capterra for $110.0 million and has published no new rates.

Read the report
Vendor pricing

CoStar pricing

Public city contracts put a CoStar Suite seat at $502 to $557 a month, and Vendr tracks a $15,360 median contract. Every contract auto-renews for a year unless notice lands 60 days before the term ends.

Read the report
Vendor pricing

Clearbit pricing

Clearbit stopped selling standalone plans on 30 April 2025, and its data now ships inside HubSpot. Enrichment costs zero credits on a $7 Starter seat, and visitor tracking burns 10 credits per company a month.

Read the report
Vendor pricing

Gartner pricing

Gartner's GSA price list runs from $33,346 for a single Reference seat to $240,600 for a Global CIO leader. Vendr tracks a $76,002 median contract across 149 purchases.

Read the report
Vendor pricing

Meltwater pricing

Meltwater prints no price on its pricing page, so the floors come from its own blog, its UK G-Cloud rate card and Vendr. Starter starts at $10,000 a year, and the median tracked contract is $25,800 across 126 purchases.

Read the report
Vendor pricing

ZoomInfo pricing

All six ZoomInfo plans are quoted through sales, and its one printed rate card sells GTM AI credits at $0.25 to $0.45. Vendr tracks a $33,500 median contract across 1,574 purchases.

Read the report
Vendor pricing

Ahrefs pricing

Ahrefs publishes six price points from $0 to $1,499 a month, and every self-serve tier includes one user. A three-person team pays $209 a month on Lite and $609 on Advanced before any add-on.

Read the report
Vendor pricing

Apollo.io pricing

Four plans run from $0 to $119 a seat a month, and a credit meter charges 8 credits for a phone number against 1 for an email. Vendr's 87 tracked deals average $19,000 a year.

Read the report
Vendor pricing

LinkedIn Sales Navigator pricing

Core lists at $119.99 a month and Advanced at $159.99, with Advanced Plus quoted on a sales call. Every tier carries the same 50 InMail credits, and refunds close after 7 days.

Read the report
Vendor pricing

Crayon pricing

Crayon quotes every deal through a 10-field form. Vendr tracks a $30,000 median across 93 purchases, from $12,700 to $46,000, and the June 2026 terms auto-renew at then-current fees.

Read the report
Vendor pricing

Medallia pricing

Enterprise accounts average $598,947 a year, SMB accounts $20,671, and none of it comes from a published rate card. What drives an EDR quote, and how it compares to Gainsight and Qualtrics.

Read the report
Vendor pricing

DataForSEO pricing

The $0.60 headline rate multiplies to $20.00 the moment depth hits 100, and a July 2026 update raised eight of DataForSEO's APIs by 20% with no rate-card notice.

Read the report
Vendor pricing

Bloomberg terminal pricing

Bloomberg publishes no rate card anywhere. A leaked renewal notice puts a single seat at $31,980 a year and $28,320 at two or more, and a UK contracts notice corroborates it at £135,936 over four years.

Read the report
Vendor pricing

GfK pricing

GfK publishes one rate card, for RegioGraph geomarketing software, from €2,080 a year. gfknewron tracking is quote-only on NIQ contracts that typically run two to five years.

Read the report
Vendor pricing

Brand24 pricing

All five tiers publish outright, $199 to $1,499 a month on annual billing. Pricing scales with keyword and mention volume; most competitors charge per seat. Two of the three big third-party pricing pages carry figures the vendor doesn't.

Read the report
Vendor pricing

Sprinklr pricing

Sprinklr publishes no price page; every quote comes from a sales call. Vendr's tracked contracts run $28,800 to $482,884 a year, with a $127,490 median.

Read the report
Vendor pricing

Seamless.AI pricing

One published price: $0 for Free. Basic, Pro and Enterprise are quote-only, and two of Seamless's own pages disagree on what the Pro plan's 10,000 credits means.

Read the report
Vendor pricing

Exploding Topics pricing

Three tiers publish outright: $39, $99 and $249 a month. The Trends API costs $1,000 to $4,000 a month on top, and only the $249 Business tier qualifies for it.

Read the report
Vendor pricing

D&B Hoovers pricing

Essentials costs $49 a month or $529 a year, the only published rate; every Enterprise tier is quote-only. Vendr's tracked median across 108 purchases runs $41,069, with company and contact credits that expire every three months.

Read the report
Vendor pricing

RocketReach pricing

Essentials, Pro and Ultimate run $229 to $1,379 a year per seat on annual billing. Custom team plans start at RocketReach's stated $6,000 floor, with a $6,750 median on Vendr.

Read the report
Vendor pricing

ThomasNet pricing

$200 to $400 a month in real supplier invoices, WebFX's $7,000 to $50,000 range, an 88% traffic decline since 2023, and the 12-month contract behind both.

Read the report
Vendor pricing

GlobalData pricing

A $68,500 median contract per Vendr, a $43,000 to $73,875 spread, no published rate card, and how it compares to AlphaSense and Bloomberg Terminal.

Read the report
Vendor pricing

FactSet pricing

Vendr's $25,160 median sits against a repeated $12,000 third-party estimate, a $985 to $26,294 Bloomberg spread that contradicts its own reputation, and what drives the quote.

Read the report
Vendor pricing

Amplemarket pricing

A published $600/mo Startup rate, custom Growth and Elite quotes, a $16,608 median contract per Vendr, and the 10-user floor that gates Elite.

Read the report
Vendor pricing

G2 pricing

$2,999 Starter that doubles to $6,000 at renewal, a $28,000 Vendr median across 313 deals, and what the Capterra acquisition changes for renewal negotiations.

Read the report
Vendor pricing

Wiza pricing

Credits, not seats: $49 to $199 a month, $0.15/$0.35 overage, and a 2,500-export cap on every annual "unlimited" plan.

Read the report
Vendor pricing

Clay pricing

Two pricing meters run at once: a monthly plan and a Data Credit pool that drains as you enrich, the March 2026 overhaul, and a $40,500 median Enterprise contract per Vendr.

Read the report
Vendor pricing

Lusha pricing

Five plans from $49.90 to $399.90 a month, a credit system where a phone reveal costs five times an email, and a $15,999 median contract per Vendr.

Read the report
Vendor pricing

Semrush pricing

Two parallel pricing lines, four Semrush One tiers from $139 to $549 a month, six standalone toolkits, and an $11,999 median contract per Vendr.

Read the report
Vendor pricing

LeadIQ pricing

A Universal Credits pool replaces flat seats, a phone number costs 10 times an email, and a $26,400 median contract per Vendr.

Read the report
Vendor pricing

Cognism pricing

Quote-only Standard and Pro plans, a $36,000 median contract per Vendr, and a renewal-control complaint worth negotiating around.

Read the report
Vendor pricing

Crunchbase pricing

The $99 Pro seat, sales-led Business and API tiers, a $20,000 median contract per Vendr, and where the data-accuracy complaints come from.

Read the report
Vendor pricing

Sprout Social pricing

Five plans from $79 to $399 per seat, the add-on modules priced separately, and the levers that move the quote.

Read the report
Vendor pricing

Brandwatch pricing

A $50,000 median contract, the three product suites, and how it compares to Hootsuite, Sprout Social and Meltwater.

Read the report
Vendor pricing

Similarweb pricing

The $199/mo Starter rate, a $37,800 Vendr median, the six add-on modules, and how it compares to Semrush and Ahrefs.

Read the report
Vendor pricing

AlphaSense pricing

A $17,500 median contract, $10,000 to $20,000 per seat, what each package includes, and where it lands against Bloomberg.

Read the report
Vendor pricing

6sense pricing

6sense's $62,440 median contract across 385 purchases, the free plan that ended in August 2026, and the hidden costs on top of the platform fee.

Read the report

Category report

Market size, segment share, and how the vendor field breaks down for the market intelligence software category itself.

Category report

Media monitoring pricing

Twelve media monitoring vendors priced from their rate cards and Vendr's tracked contracts. Awario starts at $29 a month, and Brandwatch's median contract runs $50,000 a year.

Read the report
Category report

Residential proxies pricing

Nine residential proxy providers priced per GB and per IP from their own rate cards. The same 100 GB of US traffic costs $200 a month at Rayobyte and $500 at Oxylabs.

Read the report
Category report

Customer data platform pricing

Fifteen CDP vendors priced across six billing units, from tracked users to Amps. At 100,000 profiles, list prices run from $6,000 a year on Klaviyo to $42,000 on Salesforce.

Read the report
Category report

Email finder pricing

Sixteen email finder vendors priced by what one credit buys. 1,000 found emails cost $39 a month on Skrapp and $399.90 on Lusha.

Read the report
Category report

Proxy pricing

Thirteen proxy providers priced per GB and per IP. One GB of residential traffic lists at $8.00 on Bright Data's pay-as-you-go card and $0.49 on Evomi's Core plan.

Read the report
Category report

Text analytics pricing

Cloud NLP APIs, LLM tokens and feedback platforms priced against one job. Scoring 100,000 short comments costs $30 on Amazon Comprehend and $100,000 at Thematic's per-comment rate.

Read the report
Category report

SEO tools pricing

Sixteen SEO tools priced from their own pages, from free Search Console to quote-only enterprise platforms. Self-serve suites run $23 to $549 a month, and Botify's median contract is $74,200 a year.

Read the report
Category report

Survey software pricing

Thirteen survey tools priced from vendor pages and Vendr's tracked contracts. The same 12,000 responses a year cost $84 on Microsoft 365 and $1,788 on SurveyMonkey's monthly plan.

Read the report
Category report

Market data pricing

Exchange fee schedules, broker pass-through fees, data APIs and terminal seats, priced from published rate cards. NYSE quotes cost a retail trader $1.50 a month and a professional $45.

Read the report
Category report

SERP API pricing

The same 10,000 Google searches cost $6 on DataForSEO's Standard queue and $150 on SerpApi. Google's num=100 removal raised a daily top-100 check of 1,000 keywords from $18 to $180 a month.

Read the report
Category report

News API pricing

Thirteen news APIs priced from their own rate cards, with the free-tier limits that force an upgrade. The same 10,000 monthly requests cost $19 on TheNewsAPI and $449 on NewsAPI.org.

Read the report
Category report

Reputation management software pricing

Eight published rate cards price 10 locations from $131 a month on BrightLocal to $800 on Reputation. Vendr tracks quote-only suites from a $10,800 median on Trustpilot to $318,204 on Yext.

Read the report
Category report

Sentiment analysis pricing

Sentiment analysis priced three ways: cloud and LLM APIs, listening suites and CX platforms. Scoring 1 million reviews costs $62 on GPT-5.6 Luna and $1,500 on IBM Watson NLU.

Read the report
Category report

Media database pricing

Thirteen PR contact databases priced from published plans and Vendr's tracked contracts. Semrush AI PR Toolkit starts at $149 a month, and Cision's median contract runs $12,625 a year.

Read the report
Category report

Social media management software pricing

Fourteen social media management tools priced across six billing units, from Buffer's free plan to quote-only Sprinklr. Three users on 10 profiles pay $495 a year on Later and $14,988 on Emplifi.

Read the report
Category report

Press release distribution cost

Fourteen press release distribution services priced per release, from free posting to PR Newswire circuits. One 600-word national release costs $149 at EIN Presswire and $2,465 on PRN.

Read the report
Category report

Contract management software pricing

Eighteen contract management vendors priced from rate cards and Vendr's buyer data. A 10-user team pays $5,880 a year on PandaDoc Business and $40,109 at Ironclad's median.

Read the report
Category report

Web analytics pricing

Seventeen web analytics tools priced from vendor pages, Vendr medians and UK contract notices. GA4 costs $0, while DWP paid £193,680 for one year of Analytics 360.

Read the report
Category report

Supply chain software pricing

18 supply chain vendors priced, from $29 a month on Zoho Inventory to $1,250 per user a month on Oracle Supply Planning. Vendr tracks NetSuite at a $74,816 median, and a federal Manhattan WMS contract runs $3.8 million a year.

Read the report
Category report

Rank tracker pricing

Tracking 1,000 keywords daily costs $69.86 a month on SerpRobot and $299 on Semrush. Weekly updates cut Keyword.com's bill for the same 1,000 keywords from $131 to $33.

Read the report
Category report

Trademark search cost

A trademark search costs $0 on the USPTO's own system and $1,800 at the top of the published attorney rate cards. The USPTO filing fee on top sits at $350 per class.

Read the report
Category report

Account-based marketing pricing

Platform fees, ad media, intent data and staff for an ABM program. Demandbase's median contract runs $68,591 a year, and ZenABM starts at $59 a month.

Read the report
Category report

Intent data pricing

15 intent data providers sorted by billing unit, from Leadfeeder's €0 plan to Apollo's $49 seat. Vendr medians run from $25,000 for Bombora to $95,292 for TechTarget.

Read the report
Category report

Revenue intelligence pricing

Five revenue intelligence platforms print seat prices from $10 to $149 a user a month, and Gong, Clari and Outreach print none. Vendr tracks Clari at a $76,000 median contract.

Read the report
Category report

Call center software pricing

Eleven call center software vendors publish a rate card, from $15 a user a month on Dialpad Connect to $360 for a concurrent Genesys CX 4 seat. Vendr tracks median contracts from $14,256 on Aircall to $88,536 on Talkdesk.

Read the report
Category report

Influencer marketing platform pricing

Self-serve influencer platforms start at $890 a year on Tapfiliate and $2,388 on Modash. Vendr tracks the quote-only suites from a $15,000 median contract on Upfluence to $39,250 on CreatorIQ.

Read the report
Category report

Sales engagement pricing

An Apollo.io seat with sequences and a dialer costs $49 a month on annual billing. Vendr tracks the quote-only Outreach at a $45,600 median contract and Salesloft at $30,740.

Read the report
Category report

Business intelligence cost

Seven of 11 BI vendors publish entry prices, from a $3 QuickSight Reader seat to a $115 Tableau Creator. Vendr tracks ThoughtSpot at a $100,000 median contract and Looker at $87,521.

Read the report
Category report

CRM software cost

Eleven CRM vendors priced per seat, from free plans for two or three users to $550 a user a month for Salesforce Max. Vendr tracks Salesforce at a $77,376 average contract and HubSpot at $26,250.

Read the report
Category report

Virtual data room pricing

Eleven of 17 data room vendors publish a rate card, from $52 per admin a month on Peony. Vendr tracks Datasite at a $25,555 median contract and one Intralinks contract at $150,803.

Read the report
Category report

Focus group cost

Five publishers price one focus group, and each one folds a different set of lines into the number. Agencies quote $5,000 to $20,000+ a group, and one online group of eight built from published rate cards costs $1,116 to $1,412.

Read the report
Category report

Expert network cost

A one-hour expert call costs $525 to $1,050 at the networks that publish a price, and GLG and Third Bridge publish none. Vendr tracks AlphaSights at a $78,980 median annual contract and Tegus at $30,000.

Read the report
Category report

Call tracking cost

The same 10-number, 1,000-minute month costs $30 at AvidTrak and $212 at Ringba on published rate cards. Invoca publishes no price, and Vendr tracks its median contract at $27,880 a year.

Read the report
Category report

Market research cost

The same 400 survey responses cost $380 on Pollfish and start at $5,000 through an agency. Vendr tracks Qualtrics at a $30,000 average contract and Gartner at $75,650.

Read the report
Category report

Patent search cost

A self-serve AI patent search report lists at $149, and published human searches run $400 to $4,500. The USPTO search fee on top sits at $770 for a large entity.

Read the report
Category report

Web scraping pricing

The same 1,000 rendered pages cost $1.35 on Oxylabs and $12.25 on ScraperAPI's $49 plan. Managed contracts start at $500 a month, and Vendr tracks Bright Data at a $27,000 average.

Read the report
Category report

Competitive intelligence pricing

Seven self-serve tools publish plans from $0 to $649 a month, and Klue, Crayon and AlphaSense publish none. Vendr tracks Klue and Crayon at a $30,000 average contract each.

Read the report
Category report

Procurement software pricing

Three of 18 procurement vendors publish a rate card, from $9 a user a month on Spendwise. Vendr tracks Coupa at a $94,519 average contract, and SAP charges suppliers up to $20,000 a year per buyer.

Read the report
Category report

What social listening tools cost in 2026

Five vendors publish a price, four don't, and the widest tracked contract runs past 1,300x the cheapest published tier. Brand24's often-quoted $119 figure is off by more than 65%.

Read the report
Category report

Sales intelligence market

Market size and growth figures from four analyst houses, segment shares, and the vendors behind them.

Read the report
Category report

Market intelligence platform pricing

Every pricing report in one table: entry prices, Vendr medians and pricing models for 49 vendors and 41 categories, from $83.88 a year to a $127,490 median.

Read the report
Category report

Business intelligence market

Five research houses price the 2025 market from $34.82 billion to $72.1 billion, why the estimates diverge, and who leads by install count.

Read the report

Market intelligence examples

Market intelligence reports built for a specific industry, each one proof of what the discipline produces when it's aimed at a vertical. Covered from the education side on the market intelligence examples page.

Market intelligence examples

Link building statistics

SEOs say they'll pay $508.95 for one high-quality backlink, and 48.6% rank digital PR first. BuzzStream rates 96.2% of 257,267 marketplace guest post sites low quality.

Read the report
Market intelligence examples

Printing industry statistics

Print was worth $868 billion worldwide in 2025 while volume fell 10% in five years. Published market sizes run from $319.4 billion to $868 billion, set by scope.

Read the report
Market intelligence examples

Moving industry statistics

U.S. movers booked $25.7 billion in 2026 while prices rose 44.6% since 2020. Published counts of Americans moving each year run from 15.0 million to 39.6 million.

Read the report
Market intelligence examples

EHR statistics

99.4% of US acute care hospitals and 95.0% of office-based physicians run an EHR. Only 43% of hospitals routinely exchange records in all four domains, and Epic holds 43.7% to 50.8% of hospitals.

Read the report
Market intelligence examples

CRM statistics

CRM software earned its vendors $128 billion in 2024, and Salesforce holds 20.0% of the market. Eurostat counts 28.51% of EU firms using CRM, with large firms at 65.43%.

Read the report
Market intelligence examples

Online learning statistics

10.76 million US college students, 54.7% of enrollment, took a distance course in fall 2024. Virtual public schools enrolled 562,659 K-12 students, and edX completion sat at 3.13%.

Read the report
Market intelligence examples

Etsy statistics

Etsy sold $11.92 billion of goods in 2025 and kept $2.88 billion as revenue, a 24.2% take rate. The marketplace counted 5.6 million active sellers and 86.5 million active buyers at the end of 2025.

Read the report
Market intelligence examples

Customer service statistics

The US employed 2,666,000 customer service reps in 2025, and BLS projects a 5% drop by 2035. 66% of service organizations now run agentic AI, and self-service fully resolves 14% of issues.

Read the report
Market intelligence examples

Employee engagement statistics

Gallup counts 20% of employees worldwide and 31% in the U.S. as engaged in 2025. Published engagement rates run from 20% to 70%, set by each house's definition and sample.

Read the report
Market intelligence examples

AI adoption statistics

19.8% of US businesses used AI in May 2026, up from 3.7% in September 2023, and 45.2% of employed adults used generative AI for work. Published adoption rates for the same economy run from 19.8% to 88%.

Read the report
Market intelligence examples

Augmented reality statistics

Four research houses size the 2026 AR market from $9.7 billion to $210.96 billion. Meta shipped 68.7% of smart eyewear in Q2 2026, and its Reality Labs unit lost $19.19 billion in 2025.

Read the report
Market intelligence examples

Web design statistics

58.99% of page views come from phones and 95.9% of home pages fail WCAG 2 checks. Web developers and digital designers hold 220,100 US jobs at a $99,520 median.

Read the report
Market intelligence examples

Sales enablement statistics

Teams with an enablement function won 49.0% of deals against 42.5% without one in CSO Insights' study. Research houses size the software at $2.4 billion to $6.13 billion.

Read the report
Market intelligence examples

Newsletter statistics

beehiiv newsletters averaged a 41.24% open rate in 2025, and Substack counts 5 million paid subscriptions. Open rates, paid platforms, B2B use and newsletter deals, each sourced.

Read the report
Market intelligence examples

Bluesky statistics

Bluesky had 46.9 million registered accounts on 6 October 2026 and about 3 million daily mobile users in mid-2026. Daily posts fell 35% from November 2024 to 3.36 million in September 2026.

Read the report
Market intelligence examples

Customer experience statistics

ACSI 2026 scores run from 73 for internet providers to 83 for community banks. 52% of US consumers stopped buying from a brand after a bad experience, and 91% of service leaders face pressure to deploy AI.

Read the report
Market intelligence examples

PPC statistics

Google sold 13% more paid clicks in Q2 2026 at 3% higher prices. Amazon ad revenue reached $19.8 billion a quarter, and the median Google Ads lead costs $66.69.

Read the report
Market intelligence examples

Walmart statistics

Walmart booked $713.2 billion of revenue in fiscal 2026 from 11,000 stores in 19 countries. Published shares of U.S. retail sales run from 7.3% to 11.08%, set by the denominator each house uses.

Read the report
Market intelligence examples

Direct mail statistics

USPS delivered 56.8 billion Marketing Mail pieces in fiscal 2025, 45% fewer than in 2007. Mail to house lists returned 161% ROI in the ANA's latest report, against 34% for prospect lists.

Read the report
Market intelligence examples

Robotics statistics

Factories installed more than 600,000 industrial robots in 2025, and China took 59% of them. Published robotics market sizes run from $50 billion to $90.2 billion for the latest year.

Read the report
Market intelligence examples

Market research statistics

The global insights industry turned over $153 billion in 2024, and research software now out-earns classic market research. Published market sizes run from $29.1 billion to $153 billion, set by scope.

Read the report
Market intelligence examples

Ecommerce statistics

Online sales took a record 17.1% of U.S. retail in Q2 2026 and $6.419 trillion worldwide in 2025. Published global e-commerce sizes run from $1.29 trillion to $36 trillion, set by what each house counts.

Read the report
Market intelligence examples

Remote work statistics

In March 2026, 22.6% of U.S. workers teleworked and 52% of remote-capable employees worked hybrid. Published remote work shares run from 8.8% to 35%, set by who each survey counts.

Read the report
Market intelligence examples

Snapchat statistics

Snapchat averaged 493 million daily users in Q2 2026, and North America, with 19% of them, paid for 59% of revenue. Published Snapchat audience counts run from 255 million to 971 million, set by definition.

Read the report
Market intelligence examples

Amazon statistics

Amazon booked $716.9 billion of net sales in 2025, and AWS earned 60% of its Q2 2026 operating income. Published Amazon seller counts run from 1.65 million to 1.9 million, set by what each source counts.

Read the report
Market intelligence examples

Pinterest statistics

Pinterest reached 640 million monthly users in Q2 2026, and the 17% in the U.S. and Canada paid for 75% of revenue. Published Pinterest audience counts run from 340 million to 640 million, set by definition.

Read the report
Market intelligence examples

Account-based marketing statistics

81% of ABM practitioners rate its ROI higher, and 52% of companies measure it. Adoption, budget share, buying committees and five market-size estimates, each traced to its publisher.

Read the report
Market intelligence examples

Creator economy statistics

US creator ad spend is projected at $44 billion for 2026, and research houses size the creator economy from $149.4 billion to $368 billion. The top 10% of creators took 62% of payments in 2025.

Read the report
Market intelligence examples

Wind energy statistics

The world added a record 165 GW of wind in 2025, and five publishers count the year between 158.7 GW and 169 GW. Wind made 8.5% of global electricity and 63% of Iowa's.

Read the report
Market intelligence examples

Black Friday statistics

US shoppers spent $11.8 billion online on Black Friday 2025, up 9.1%, and 202.9 million people shopped over Thanksgiving weekend. Adobe forecasts $12.9 billion for Black Friday 2026.

Read the report
Market intelligence examples

TikTok statistics

TikTok ads reach 2.21 billion adults, and 37% of US adults use the app. TikTok Shop sold US$64.3 billion worldwide in 2025, up 94%, with the US at US$15.1 billion.

Read the report
Market intelligence examples

Email marketing statistics

Platform benchmarks put average email open rates between 30.7% and 43.46%, and Apple Mail holds 62.26% of tracked opens. Automations earn 30% of Omnisend email revenue from 2% of sends.

Read the report
Market intelligence examples

SMS marketing statistics

89% of US consumers have opted in to business texts, and campaign SMS draws 5.6% clicks on Klaviyo's data. Five research houses size the market from $14.15 billion to $74.8 billion.

Read the report
Market intelligence examples

Content marketing statistics

92.4% of content marketers use AI to blog, and 13.9% say their blog delivers strong results, an all-time low. AI Overviews cut top-result clicks by 58%.

Read the report
Market intelligence examples

Music industry statistics

Recorded music earned US$31.7 billion worldwide in 2025, its 11th straight year of growth. 837 million people paid for a subscription, and fully AI-generated tracks passed 50% of Deezer's daily uploads.

Read the report
Market intelligence examples

Travel statistics

68.3 million international visitors reached the US in 2025, down 5.5%, with arrivals from Canada down 20.9%. US travel spending is forecast at a record US$1.37 trillion in 2026.

Read the report
Market intelligence examples

SaaS statistics

Four research houses put the 2026 SaaS market at $375.6 billion to $530.0 billion. Median net revenue retention sits at 101%, and SaaS prices rose 16.4% in June 2026.

Read the report
Market intelligence examples

Freelance statistics

Published U.S. freelancer counts run from 11.9 million (BLS) to 74.9 million (MBO Partners). Fiverr's annual active buyers fell to 2.7 million, and AI cut writing and coding posts 21%.

Read the report
Market intelligence examples

Shopify statistics

Shopify booked $11.56 billion of revenue on $378.4 billion of GMV in 2025. Store Leads, TechnologyChecker and Wappalyzer count between 1.5 million and 3.1 million Shopify stores.

Read the report
Market intelligence examples

B2B marketing statistics

B2B marketing budgets sit at 7.8% of revenue in 2026, and 15.3% of that money now goes to AI. 94% of business buyers used AI during a purchase in 2025.

Read the report
Market intelligence examples

Solar industry statistics

Four publishers put 2025 solar additions anywhere from 511 GW to about 690 GW. Solar supplied 8.7% of global electricity in 2025.

Read the report
Market intelligence examples

Cold calling statistics

Published cold call success rates run from 0.25% per dial to 16.7% per connected call, depending on who counts. 86% of calls from unknown numbers go unanswered.

Read the report
Market intelligence examples

Customer retention statistics

B2B SaaS keeps a median 91% of revenue before upsells, and 20% of bank customers moved money out of their primary bank in three months. 47.2% of U.S. auto policies got shopped in a year.

Read the report
Market intelligence examples

Facebook statistics

Meta counts 3.60 billion daily people across its apps, and Facebook ads can reach 2.39 billion. Only 0.15% of a page's followers engage with a typical post.

Read the report
Market intelligence examples

Streaming statistics

Streaming took a record 49.0% of US TV time in July 2026, with YouTube at 14.2%. Omdia counted 2.24 billion online video subscriptions worldwide at the end of 2025.

Read the report
Market intelligence examples

Entrepreneur statistics

18.5% of US adults are starting or running a new business, and 5.5% own one older than 3.5 years. The typical founder is 42, and women own 39.0% of businesses.

Read the report
Market intelligence examples

Chatbot statistics

Pew counts 49% of US adults using AI chatbots, and five research houses size the market between $1.42 billion and $13.28 billion. 7% of customers used a chatbot in their last service contact.

Read the report
Market intelligence examples

Reddit statistics

Reddit's own filings, Pew, Similarweb and Statcounter measure the platform four different ways. Reddit averaged 130.3 million daily and 514.6 million weekly users in Q2 2026, on $805 million of quarterly revenue.

Read the report
Market intelligence examples

Sales statistics

Sales reps spend 40% of their time selling, and 48% of account executives hit quota in The Bridge Group's 2026 study. Ebsta's CRM data puts the miss rate at 78%, and 67% of B2B buyers prefer a rep-free experience.

Read the report
Market intelligence examples

Google search statistics

Google handles more than 5 trillion searches a year and takes 89.94% of worldwide search referrals. 68.01% of US searches ended without a click in early 2026, and Search revenue hit $63.27B in Q2.

Read the report
Market intelligence examples

Pet statistics

U.S. owners spent $158 billion on pets in 2025, and APPA and AVMA count 95 million and 77.5 million pet households. Shelters took in 5.8 million dogs and cats.

Read the report
Market intelligence examples

Coffee statistics

66% of US adults drank coffee in the past day. Arabica fell to $7.26 per kg, ground coffee cost $9.30 a pound, and market estimates start at $144.5 billion.

Read the report
Market intelligence examples

Agriculture statistics

US net farm income heads for $158.4 billion in 2026, down 2.6%, and farms fell 15,000 to 1,865,000. Published sizes for agriculture run from $222.3 billion to $12.97 trillion.

Read the report
Market intelligence examples

Real estate statistics

Existing-home sales ran at 3.98 million in August 2026 at a $429,100 median, with the 30-year mortgage rate at 7.28%. Five trackers put the typical home price $59,422 apart.

Read the report
Market intelligence examples

Beauty statistics

Seven research houses size the beauty market between $355 billion and $1 trillion. Skincare holds 39% of sales, L'Oréal tops the field with €44.05 billion, and 41% of US beauty spending is online.

Read the report
Market intelligence examples

Social media statistics

DataReportal counts 5.79 billion social media identities and Meta reaches 3.60 billion people a day. US social ad revenue hit $117.7B in 2025, ahead of search.

Read the report
Market intelligence examples

YouTube statistics

YouTube passed $60 billion in 2025 revenue and Shorts averages 200 billion daily views. 84% of US adults use it, and MrBeast leads with 519 million subscribers.

Read the report
Market intelligence examples

Instagram statistics

Meta counts 3 billion monthly and 2 billion daily Instagram users. Reels took 46% of US time in 2025, and four engagement benchmarks run from 0.30% to 3.5%.

Read the report
Market intelligence examples

Cybersecurity statistics

FBI complaints passed one million in 2025, with $20.877 billion in reported losses. IBM puts the average breach at $4.99 million, and ransomware sits in 48% of breaches.

Read the report
Market intelligence examples

Insurance statistics

Insurers collected €6.9 trillion worldwide in 2025. 52% of US adults own life insurance, 7.9% of Americans went uninsured, and three houses put 2025 catastrophe losses $22 billion apart.

Read the report
Market intelligence examples

Small business statistics

SBA, Census, BLS and Fed data on 36.2 million U.S. small businesses. 34.7% of new establishments last ten years, and 42% of financing applicants got the full amount.

Read the report
Market intelligence examples

Podcast industry statistics

Three trackers put YouTube's podcast share at 37% to 44% and four indexes count 3.75M to 4.92M shows. US podcast ad revenue hit $2.862B in 2025, up 17.6%.

Read the report
Market intelligence examples

Retail industry statistics

Census, BLS and PPI data on 2026 U.S. retail sales, jobs, prices and the largest retailers. August sales hit $773.9 billion, up 6.0%, while producer prices rose 5.4%.

Read the report
Market intelligence examples

Search engine marketing statistics

Google sold 13% more paid clicks in Q2 2026 as 68% of US searches ended without a click. CPCs, AI Overview CTRs and $113 million in publisher search spend.

Read the report
Market intelligence examples

AI environmental impact statistics

Data center electricity, water, carbon and e-waste figures from the IEA, UN University, Berkeley Lab and the cloud providers. Data centers used 485 TWh in 2025, up 17%, and Google's water use rose 34%.

Read the report
Market intelligence examples

Advertising industry statistics

Four forecasts size 2026 global advertising from $1.06 trillion to $1.42 trillion. Q2 ad revenue for Google, Meta and Amazon, plus CTR, CPM and email benchmarks that disagree.

Read the report
Market intelligence examples

AI statistics

ChatGPT passed 1 billion weekly users and Anthropic reports the larger revenue run-rate. 49% of US adults use chatbots while 52% of Americans are more concerned than excited.

Read the report
Market intelligence examples

Video game industry statistics

Global games revenue, players, platforms, regions, prices and jobs, each figure tied to its 2026 source. Newzoo puts the market at $213.9 billion while US console prices rose 16% to $542.

Read the report
Market intelligence examples

Esports industry statistics

Counter-Strike's 2,752,353 record peak, an LCS all-time low, and three research houses sizing the 2026 market from $3.3B to $5.34B. Co-streamers carried 46.7% of H1 2026 watch time.

Read the report
Market intelligence examples

Contract research organization market

Ten research houses price the 2025 market from $59.6B to $99.8B, the major players by revenue, and AI vendor claims checked against peer review.

Read the report
Market intelligence examples

Automotive industry statistics

An industry trade group's own page understating figures its members quote, EV sales growing in some counts and stalling in others, and where a subscription fee turns a feature you paid for back off.

Read the report
Market intelligence examples

Publishing industry statistics

$33.4 billion in US revenue, 84.6% of new titles self-published, and why global estimates span $97.7B to $156.6B.

Read the report
Market intelligence examples

Life science market report

Lab space vacancy near a cyclical peak, falling rents, and a $38 billion 2025 venture capital year.

Read the report
Market intelligence examples

UK retail market report

Sales volumes edging up, online share near 28.8%, record labour costs, and a golden quarter that undershot.

Read the report
Market intelligence examples

Construction market report

Market size to 2030, regional shares, major players, and the building types driving segment-level demand.

Read the report
Market intelligence examples

Retail real estate market

Vacancy, asking rents, and construction pipelines across major metros, plus where investment capital is flowing.

Read the report
Market intelligence examples

Business travel market

Why market size estimates diverge by billions, segment shares, the management companies, and AI's role in booking.

Read the report

Vendor events

Acquisitions, shutdowns, and rebrands, and what each means for buyers holding a contract with the affected vendor.

Research brief

Tested claims: an AI engine's answer checked against a vendor's own page, or a metric's definition checked against how tools calculate it.

Research brief

AI visibility and Reddit: a 9-vendor citation study

Reddit is a top-3 AI-cited source for 8 of 9 social listening vendors. The 0.73 correlation to a vendor's own Reddit backlinks collapses to -0.11 once company size is held constant.

Read the report
Research brief

Subscription based car features

BMW charged $27.50 a month for heated seats the car shipped with, then reversed course. Tesla removed Autosteer from cars that already had it. Louis Rossmann's Consumer Rights Wiki tracks the pattern by name.

Read the report
Research brief

The IQVIA Veeva lawsuit: what it was and how it ended

IQVIA and Veeva Systems settled an eight-year trade secret and antitrust lawsuit in August 2025 with no damages paid, then signed a data-sharing partnership.

Read the report
Research brief

What trademark infringement costs a growing business

A cease and desist letter runs $500 to $1,500. A lawsuit through trial costs $120,000 to $750,000, and a forced rebrand after losing adds $50,000 to $1,000,000 more.

Read the report
Research brief

Pricing errors in software

Twelve AI answers tested against the vendor's own page, sixteen vendor self-contradictions, and a pricing audit that went stale in eight days.

Read the report
Research brief

End of life software: what the dates mean

Microsoft publishes a lifecycle table and prices three years past it. SaaS vendors publish a 301. What two AI engines answered when asked if a product still exists.

Read the report
Research brief

AI traffic report

How much website traffic AI platforms drive, how fast crawler and agent activity is growing, and how to track it.

Read the report
Research brief

SEO visibility score

What the metric measures, the 35 to 45% benchmark, how tools calculate it, and where the number misleads.

Read the report

Review platform legitimacy

Tests of the review platforms cited as sources across the review section.

What Market Intelligence Reports Are

Market intelligence reports are structured documents that synthesize external data about an industry: the specific market's size, the competitive field, customer behavior, and the regulatory and macro environment, assembled to support one decision. That last clause separates working market intelligence reports from shelfware.

A market report commissioned "to understand the space" produces a polished document nobody opens twice; the same budget aimed at "should we enter the German market in 2027" gets read, argued over, and acted on.

The line between market intelligence and traditional market research matters here. Market research digs into specific customer preferences and consumer behavior, usually through surveys and focus groups; market intelligence takes the wider view, covering competitors, market trends, and industry shifts on an ongoing basis.

Most organizations need both. The best market intelligence reports fold market research findings into the wider market picture.

What Market Intelligence Reports Contain

Zenit Data's breakdown of commissioned market intelligence reports lists eight core sections, and the structure holds across most vendors: executive summary, market sizing, competitive landscape, customer analysis, regulatory context, trend signals, opportunity analysis, and a methodology appendix listing every source. The market research report template on this site follows the same skeleton for teams building reports internally.
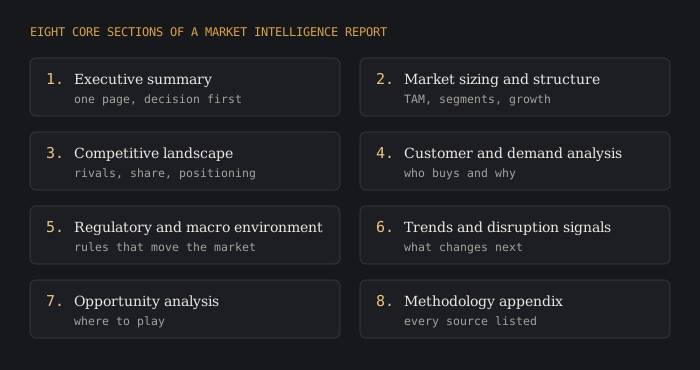
The eight core sections of a market intelligence report from executive summary to methodology appendix

Two sections carry most of the weight. The executive summary is what the leadership team reads, so it leads with the answer ahead of the method: one page, bullet points, data points with sources attached. And the methodology appendix tells you if to trust the rest; market intelligence reports that won't show their data sources are asking for faith.

Market sizing deserves its own caution. Published analyst reports covering the same industry routinely disagree by billions because they draw the geographic scope and customer type differently. Our sales intelligence market report shows the spread in practice: four research houses, four different market sizes, each defensible on its own definitions.

Who Commissions Market Intelligence Reports

Companies commission market intelligence reports around a short list of triggers.

  • Market entry, the classic one: a clear understanding of demand, rivals, and regulation before capital moves.
  • Acquisition target assessment, where the report doubles as diligence.
  • Competitive intelligence and brand positioning: how the target market perceives the category, which market opportunities are open, and where consumer preferences are drifting.

What organizations commissioning a market intelligence report receive depends on what they feed it. Internal data, sales records, churn numbers, win-loss notes, sharpens the external picture; vendors working without it produce reports about the market in general. Those reports say little about your specific position within it.

Teams that pair commissioned work with their own customer intelligence get actionable data where others get description, and the market intelligence reports that drive data driven decisions are almost always the ones built on both.

Report Types and Timelines

Infomineo's commissioning guide splits market intelligence reports into four working types, each with its own clock.
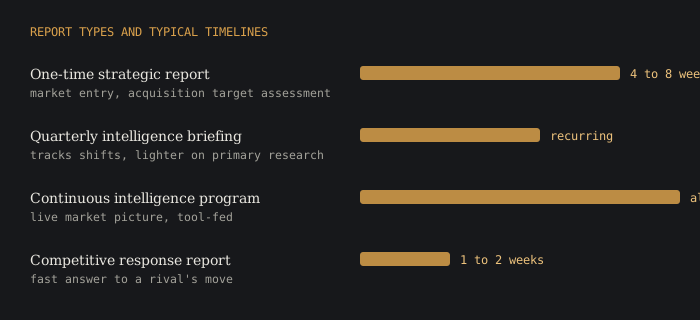
Four report types with typical timelines from one to two weeks for competitive response to always-on programs

One-time strategic reports

Built for a single decision: market entry, an acquisition, a new product line. These take four to eight weeks when done with primary research, and they go stale; the report describes the market as of its delivery date, nothing after.

Quarterly intelligence briefings

Recurring snapshots that track what changed in the market. Lighter on primary research, heavier on monitoring; the value is the delta between issues. No single edition carries it.

Continuous intelligence programs

A live market picture fed continuously by tools. The market intelligence tools ranking covers the platforms that run this model; the trade-off is cost and the research team time to maintain it.

Competitive response reports

The fast lane: one to two weeks, triggered by a rival's launch or price move. Narrow scope, mostly secondary research, built to answer "what do we do about this" while the competitive response still matters.

Infomineo reports that companies with a formal process for matching report type to question see 40% higher report utilization. The mechanism is unglamorous: a competitive response question answered with an eight-week strategic report arrives six weeks late.

What Market Intelligence Reports Cost

The market intelligence report cost question has a wide honest answer, because the price tracks the research approach and ignores the page count.

Cost bands for commissioned reports from secondary-only sweeps to continuous programs

Zenit Data prices market intelligence reports carrying a significant primary research layer at $20,000 to $80,000. Secondary-only work runs well under that, and a syndicated market research report from a large analyst house sells for $3,000 to $7,000 per license because the cost spreads across every buyer; the trade-off is that competitors can buy the identical document. Custom market intelligence reports cost more because the questions are yours alone.

Free market intelligence reports exist too, and companies underuse them. Government databases, trade associations, and public sources like company websites, annual reports, news articles, and job postings cover a large share of what commissioned work charges for. Collecting it is time consuming, which is the real price: the gap between free and paid is mostly labor and access to primary sources. None of it is secret data.

Industry associations in particular publish market data on specific segments that analyst houses resell with more resources behind the formatting.

Primary and Secondary Research

Every market intelligence report runs on primary and secondary research in some mix, and the mix decides what the report can claim about the market.

Secondary research is what already exists: published analyst reports, government databases, filings, the public secondary data layer anyone can reach. It is fast and cheap and answers "what is known about the industry." Primary research is what gets created for the report: expert interviews, channel partners, customer conversations, surveys.

Infomineo puts the minimum viable primary layer at 8 to 15 structured interviews, reports that only 34% of commissioned market intelligence reports include primary interviews at all, and finds reports built on primary research 2.8 times more likely to drive action.

The reason is checkable specificity. Secondary data says the market grew; a distributor on the phone says which customer type drove it and what they paid. Market intelligence reports that cite only recycled secondary sources can be replicated by any competitor with the same subscriptions, which is exactly why organizations pay for the interview layer.

How AI Changed the Production Work

Infomineo reports 72% of companies now use AI somewhere in market intelligence work, and cites Allianz SE cutting manual research time by 80% on the collection side. The compression is real for the secondary sweep: reading filings, clustering news articles, extracting data across sources. Our AI market intelligence section covers the tooling.

What AI does not compress is the primary layer or the judgment. A model cannot interview a channel partner, and it will happily synthesize secondary sources that disagree without noticing. The practical split: AI compresses the research team's collection weeks into days, and the analyst hours move to interviews, verification, and the actionable insights the report exists to produce.

Business intelligence dashboards and data analytics feed the same pipeline, but someone still decides what the numbers mean for the market.

Commissioning Without Wasting the Budget

Infomineo's buyer data points at one failure mode above the rest: 61% of buyers who rated market intelligence reports ineffective cite an unclear brief. The fix costs nothing. Define the decision the report must inform before contacting a vendor, in one sentence, and require every proposed section to map to it; the same source finds organizations that align report sections to decisions 2.8 times more likely to act on the findings.

A workable brief names the decision, the geographic scope, the customer segments in and out of scope, the deadline with the reason for it, and the format the detailed insights should arrive in. Ask which findings will come from primary work and which from secondary sources, ask about the key features of the deliverable (charts, raw data, editable files), and get the methodology appendix requirement in writing.

A vendor that resists listing data sources has answered a question you didn't have to pay to ask. Organizations that provide insights from their own internal data during scoping get sharper reports back; vendors are not mind readers about your market position.

Common Questions About Market Intelligence Reports

How often should market intelligence reports be updated?

On the cadence of the market, and the calendar has no say. Companies in fast-moving categories refresh market intelligence reports quarterly because consumer behavior and their competitors' moves shift under them; companies in slow regulated sectors get by on annual updates plus event-driven ones when the regulatory environment changes. The test: if a report's market sizing or share figures are more than a year old, decisions built on them are running on memory.

How do market intelligence reports differ from plain research studies?

Scope. Market research reports answer a narrow question about buyers, product-price fit for one target market, message testing, brand positioning against two rivals. Market intelligence reports wrap that in the wider frame: market trends, competitive intelligence on every named rival, and the forces reshaping the industry.

One studies the customer; the other maps the specific market the customer sits in, which is why market intelligence budgets sit with strategy teams while research budgets sit with marketing.

Companies that treat the two as substitutes usually discover the gap at the worst time: a launch built on solid customer data that never checked what the market intelligence would have flagged, a rival's pricing change announced three weeks earlier.

Can free sources replace commissioned market intelligence reports?

For monitoring, often; for decisions, rarely. Free secondary data keeps companies current on market intelligence between report cycles and helps teams stay ahead of obvious moves. What it cannot deliver is the interview layer, and a polished document built entirely from public material carries the same blind spots as every competitor reading the same pages.

The honest budget answer: use free sources to sharpen the brief, then pay only for the primary work that turns description into actionable insights.

The Reports Published Here

The market intelligence reports above the fold follow the same rules this page describes: every number attributed, methodology stated, actionable data over narrative. The sales intelligence market report is a category report on market size and vendors across the industry. The AI traffic report is a research brief on how AI platforms send and consume website traffic.

Five of the reports here study market intelligence output aimed at a single industry. The construction market report projects size to 2030 across regional shares, and the life science market report tracks a $38 billion 2025 venture capital year against lab-space rents near a cyclical peak. Both sit in the market intelligence examples group, covered from the education side on the market intelligence examples page.

The Adobe Semrush report covers a single vendor event and what it means for companies buying either product, and the Searchmetrics report documents a platform shutdown. Teams building their own market intelligence reports can start from the templates library and the examples above, make informed choices about scope, and stay ahead of the next reporting cycle in their industry.