Pet statistics for 2026: ownership, industry spending and shelter outcomes
 By Jan Suski. I go deep on every review, checking every number against its source and digging up details other coverage misses, a habit from six years of SEO and link building for tech companies. Bylines at Surfer, Brand24, and Senuto. How the scoring works.
The numbers U.S., UK and EU pets, checked 4 October 2026
APPA expects 4.4% growth in 2026 and credits about 2 points of it to inflation, so real volume is growing at roughly half the headline rate.
APPA's 95 million households and AVMA's 77.5 million describe the same country in the same year, so the publisher you cite decides the answer.
Shelters took in 121,000 fewer dogs and cats in 2025 than in 2024, and euthanized 597,000 dogs and cats that year.
U.S. pet owners spent $158 billion on their pets in 2025, up 3.7%, according to the American Pet Products Association (APPA). The trade body projects $165 billion for 2026. Its count of 95 million pet-owning U.S. households runs 17.5 million ahead of the 77.5 million in the American Veterinary Medical Association's own 2025 sourcebook.
This report gathers the pet industry statistics published in 2025 and 2026: spending by category, ownership by species and generation, veterinary care costs, pet insurance, shelter intake and euthanasia, plus the UK and European counts. Every figure links to the body that published the data, with the report name and date.
It's written for analysts, retailers and shelter teams who need a sourced number fast. Where two publishers disagree, both figures sit side by side with the reason for the gap.
U.S. pet industry expenditures: $158 billion in 2025
The American Pet Products Association splits spending into four categories, and pet food takes the lion's share. Food & treats came to $68.3 billion of the 2025 total, per APPA's industry trends and stats, ahead of veterinary care at $41.0 billion. Supplies, live animals and over-the-counter medicine added $34.4 billion. Other services, the smallest line and the one holding grooming and boarding, grew fastest at 8%.
| Category ($ billions) | 2024 | 2025 | 2026 projected | Share of 2025 |
|---|---|---|---|---|
| Pet food & treats | 66.0 | 68.3 | 69.7 | 43% |
| Vet care & product sales | 40.0 | 41.0 | 42.4 | 26% |
| Supplies, live animals & OTC medicine | 33.0 | 34.4 | 35.6 | 22% |
| Other services | 13.2 | 14.3 | 14.9 | 9% |
| Total (headline) | 152 | 158 | 165 | 100% |
APPA's 2024 column comes from its 2026 State of the Industry figures as reported on 1 April 2026. APPA's longer forecast puts the pet industry at $197.9 billion by 2030, with pet food and treats at $78.4 billion.
The devil's in the details on APPA's 2026 row. The four category projections add up to $162.6 billion, $2.4 billion short of the $165 billion headline on the same APPA page. A bottom-up model built from the category lines lands at the lower number.
APPA defines other services as "boarding, grooming, insurance, training, pet sitting and walking and all services outside of veterinary care," per its 2023 release. NAPHIA's $5.7 billion in 2025 U.S. pet insurance premiums equals 40% of that $14.3 billion line, which leaves grooming, dog training, boarding and walking a smaller pool than the category label implies.
Spending per pet-owning household
Divide $158 billion by 95 million households and average pet expenses come to about $1,663 per pet-owning household in 2025. The Bureau of Labor Statistics measures a wider base. Its Consumer Expenditure Survey put spending on pets at $880 per consumer unit in 2024, averaged across every household with or without an animal, up from $690 in 2020.
Vet bills are the second-largest line. AVMA puts annual veterinary spending at $598 per dog-owning household and $529 per cat-owning household. Forbes Advisor's own analysis prices essential dog expenses at $1,533 a year, and doggy day care twice a week adds an estimated $2,980.
Pet stores, ecommerce and the listed companies
Company filings show where pet supplies and pet food dollars land. Four listed businesses posted their 2025 results between February and March 2026:
- Chewy: $12.60 billion in net sales, up 6.2%, from 21.3 million active customers spending $591 each
- Petco: $6.0 billion, down 2.5%, across 1,382 pet stores, with $1.025 billion from services and other revenue
- Zoetis: $9.5 billion in animal health revenue, up 2% reported and 6% organic operational
- Freshpet: $1.102 billion in net sales, up 13.0% from $975.2 million
Chewy's Autoship subscriptions alone brought in $10.5 billion, 83.3% of its sales and 1.75 times Petco's full year. Repeat orders of pet supplies and food now carry Chewy's revenue, which matters for anyone tracking the sector with ecommerce analytics tools or the wider retail industry statistics.
Why the published pet industry estimates diverge
Four bodies sized U.S. pet spending for 2024 or 2025, and their totals span $69 billion. Each one counts a different thing, and APPA's pet industry expenditures series lands in the middle.
| Publisher | Figure | Year | What it counts |
|---|---|---|---|
| BLS Consumer Expenditure Survey | $880 per consumer unit, about $119.5B across 135.76M units | 2024 | Spending households describe in interviews and diaries |
| American Pet Products Association | $152B | 2024 | Trade-body estimate across four product and service categories |
| Packaged Facts, US Pet Market Outlook 2026-2027 | $155B | 2025 | Retail sales of pet products and services |
| American Pet Products Association | $158B | 2025 | Same four categories, one year on |
| Bureau of Economic Analysis | $188.8B | 2024 | Personal consumption on pets, pet products and related services |
| Bloomberg Intelligence | $320B global | 2023 | Global pet economy, forecast near $500B by 2030 |
The BLS total multiplies its $880 average by the 135.76 million consumer units in its December 2025 release. Packaged Facts forecasts 3.9% annual growth from 2025 to 2030. Bloomberg Intelligence, which estimated the global market for pets at $320 billion in 2023, expects U.S. sales approaching $200 billion by the end of the decade.
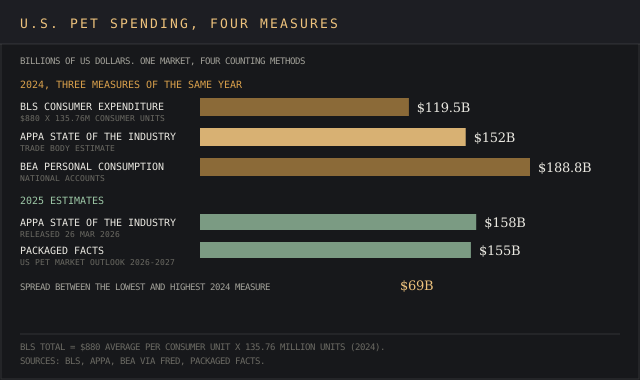
Swapping APPA's $152 billion for BEA's $188.8 billion inside one 2024 model adds 24% to the market with no change in how owners treat their pets. A forecast stays consistent when every year comes from one series, which is the first rule in our market sizing template and the total addressable market template.
Pet ownership statistics from three surveys
The household count for pets moves with the survey, and the gaps run to millions of homes. APPA counted 94 million pet-owning U.S. households for 2024 in its 2025 State of the Industry release, roughly 71% of homes, and 95 million for 2025. AVMA's sourcebook, built from 7,519 respondents surveyed in early spring 2025, puts the total number at 77.5 million, or 58.6%.
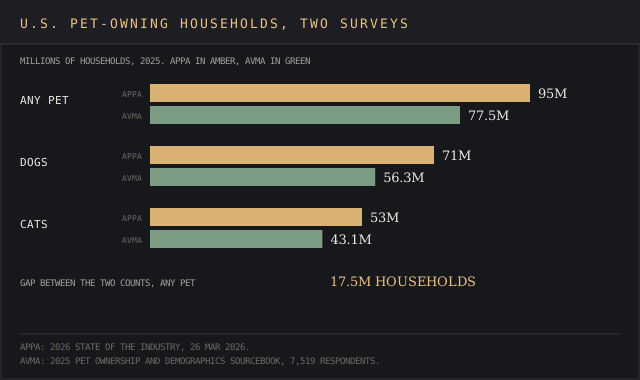
APPA's own series jumped from 82 million households in 2023 to 94 million in 2024, 12 million in one year. That's a red flag for any trend line drawn across the two editions. The Pew Research Center asked 5,073 adults in April 2023 and found 62% own a pet.
Direction differs too. Packaged Facts puts the fall in dog-owning households at 4.2% between 2019 and 2025 while cat households rose 4.1%. APPA puts dog ownership at 53% of households in 2025, up from 51% a year earlier.
Pet ownership by species and generation
Dogs and cats, the most popular pet types
In 2025, 95 million U.S. households owned at least one pet, and dogs are the most popular pet in every count here. APPA puts dog owners in 71 million U.S. households in 2025 and cat owners in 53 million, 39% of homes, up 5% in a year. AVMA counts 87.3 million dogs and 76.3 million cats, with 1.6 dogs per dog-owning household and 1.8 cats per cat-owning household.
Pet owners treat their pets as kin. In Pew's survey, 97% of pet owners say their pets are part of their family, and 51% call a pet as much a family member as a human relative. Dog owners lean further, with 53% of dog-only owners saying so against 48% of cat-only owners. Pet ownership peaks in rural communities, where 71% of adults have a pet, and 35% of all Americans have more than one.
Fish, birds, small animals and reptiles
APPA's species reports from September and December 2025 size the market for other pets. Households run into the millions for every species on the list:
| Pet type | U.S. households (millions) | Detail from APPA |
|---|---|---|
| Dogs | 71 | 53% of households in 2025 |
| Cats | 53 | 39% of households, up 5% in a year |
| Freshwater fish | 10 | 77% of fish owners keep two or more |
| Birds | 6 | Cockatiel ownership up 58% from 2023 |
| Small animals | 6 | Rabbits 37% of owners, guinea pigs 23%, hamsters 18% |
| Reptiles | 6 | Gen Z holds a third of reptile ownership |
| Saltwater fish | 2 | 34% run tanks of 126 gallons or more |
| Horses | 2 | 55% of horse owners keep more than one |
Rabbit ownership among small-animal owners is up 37% since 2018, and hamster ownership is down 25% in that time. Pet stores and online sellers stock small-animal supplies, bedding and live animals for the small pets in those 6 million households.
Gen Z pet owners, millennials and other age groups
Gen Z made up 20% of pet-owning households in 2024, or 18.8 million, a 43.5% jump from 2023, according to the American Pet Products Association. Some 70% of Gen Z pet owners keep two or more pets.
Millennials hold 38% of freshwater fish ownership and 35% of small-animal ownership. Gen X, the third generation in APPA's data, drove 2025 growth with pet ownership up 12% in a year as empty-nest families added pets of new species. Splitting buyers this way is standard demographic market segmentation.
Demand outside current owners exists as well. Among non-pet owners, 30% say they might like to have pets and 21% picked the strongest yes on offer, per Packaged Facts.
Some 14% of people said their workplace allows pets in APPA's 2025 survey, up 17% from 2023, and 80% of the HR professionals and senior leaders it polled said such benefits help recruit and retain staff.
Veterinary care costs and pet insurance
Veterinary care costs strain pet owners' budgets in both APPA's and Forbes Advisor's surveys. In APPA's 2025 survey, 37% of pet owners worried about access to a vet and 60% cited affordability. A $499 vet bill already costs an arm and a leg for 28% of owners, who told a Forbes Advisor survey of 2,000 pet owners they couldn't pay it without going into debt. That's below the $598 in yearly veterinary expenses AVMA records for a dog-owning household.
Owners are adjusting what they spend on pets. Forbes Advisor's 10,000-owner poll found 39.29% of dog owners lived on a tighter budget to afford their dogs' expenses. APPA counted 22% of pet owners spending less on pets in 2025, a 10% rise from 2024, as more families work to make ends meet.
Pet insurance statistics
The North American Pet Health Insurance Association counted 6.98 million insured pets in the U.S. at the end of 2025, up 9.0%, and 7.6 million across North America. U.S. premiums reached $5.7 billion, up 19.7%. Dogs make up 74.9% of insured pets.
- Average accident & illness premium: $836 a year for a dog (about $70 a month) and $435 for a cat in 2025
- One year earlier: $749.29 for a dog ($62.44 a month) and $386.47 for a cat, with 6.41 million insured U.S. pets at the end of 2024, per NAPHIA's 2025 report
- Two years earlier: 5.17 million insured pets and $4.2 billion in written premium across North America in 2023, per the same report
- Share of U.S. pets insured: 4.27%, or 5.99% of dogs and 2.29% of cats
- Top states by insured pets in 2025: California 18.1%, New York 7.4%, Florida 6.2%, Texas 6.1%
- The total number of U.S. insured pets grew about 76% from 2021 to 2025
A 4.27% penetration rate for insured pets is a drop in the bucket next to 95 million pet households, and Packaged Facts forecasts 17.4% annual growth in pet insurance from 2025 to 2030. Premiums for people get their own breakdown in our insurance statistics report.
Shelter pet statistics for intake, adoptions and euthanasia
Shelter Animals Count recorded 5.8 million dogs and cats entering U.S. animal shelters and rescues in 2025, 2% fewer than 2024. Dogs accounted for 2.8 million and cats for 3.0 million, per its annual release. SAC labels these community intakes, the animals arriving from the communities each organization serves. Millions of those pets left alive:
- Adopted: 4.2 million, up 0.7%, including 2 million dogs and 2.2 million cats
- Euthanized: 597,000, with 320,000 dogs and 277,000 cats
- Returned to owner: 638,000, down 3%
- Transferred in from other organizations: 1.26 million, up 3%
Strays make up 59% of shelter intake and owner surrenders 30%, per the ASPCA. Lost pets get home at uneven rates. Shelters returned 34% of stray dogs to their owners in 2025 and 6% of stray cats, so dogs arriving as strays went home about six times as often.
Euthanasia rates for shelter pets differ by species. The 320,000 dogs euthanized equal about 11% of dog intake, and the 277,000 cats about 9% of cat intake. Kittens made up 59% of cat intake in 2025, with arrivals peaking in May and September, per SAC's kitten-season analysis.
Community cats sit behind those kitten numbers. Humane World for Animals puts the estimated community cat population at 30 to 40 million, per its Pets by the Numbers page, and counts 20 million pets in underserved communities, figures drawn from its Pets for Life program for pet owners in those communities.
Access to care is thinnest there, with 88% of those pets unaltered and 70% never seen by a veterinarian. Some 29% of Americans feed community cats, per the same page, and only 23% of cats were spayed or neutered at shelter intake in 2025.
Municipal and private shelters and rescue groups across U.S. communities submit data to SAC, which covers 13,471 organizations: 4,100 government shelters and 9,371 rescues. The ASPCA announced its acquisition of Shelter Animals Count on 10 December 2025.
Shelter Animals Count and Best Friends publish two national counts
Best Friends Animal Society's 2025 report counts nearly 4.7 million dogs and cats entering U.S. shelters and 396,000 killed, including 187,000 cats. Its save rate reached 82.5%, and 68% of the nearly 4,000 shelters in its dataset met its no-kill threshold.
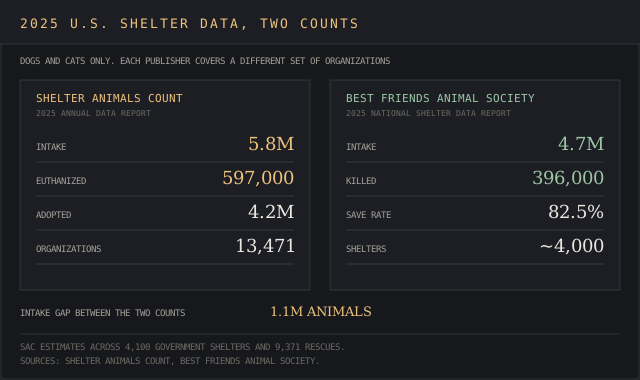
The 1.1 million gap in intake traces to scope. SAC estimates across 13,471 organizations including 9,371 rescues, and Best Friends tracks nearly 4,000 shelters. Both show the same direction. Best Friends counted 34,000 fewer shelter deaths in 2025 than in 2024, and SAC counted dog non-live outcomes down 5%.
Pet populations in the UK and Europe
UK pet ownership grew by millions of pets in five years, and UK pet owners now keep more dogs than cats. UK Pet Food's pet population survey, run by Kantar with 8,951 adults in January 2026, counts 15.5 million dogs and 13.1 million cats among 36.5 million pets, with 62% of households, around 18 million homes, owning at least one.
Dog-owning households rose from 33% in 2021 to 41%. Dog ownership reaches 58% among 25 to 34 year-olds and 53% among 16 to 24 year-olds, and 52% of UK households with children own a dog.
The PDSA's PAW Report 2025 puts the UK at 11.1 million dogs, 10.5 million cats and 700,000 rabbits. That's 4.4 million fewer dogs than UK Pet Food counts. PDSA measures ownership among adults, 30% with a dog and 24% with a cat, and UK Pet Food measures it among households.
Across Europe, FEDIAF's 2025 Facts & Figures counts 139 million households with at least one pet and 299 million pets. European pet food sales reached €29.3 billion.
Pet industry trends for 2026
Owners keep trading up on what their pets eat while cutting elsewhere. These are the trends worth keeping an eye on, each from a 2025 or 2026 filing or survey:
- Premium food: 41% of dog owners buy premium dog food, up 5% from 2023, per APPA's 2025 Dog & Cat Report
- Supplements: 53% of dog owners buy vitamins or supplements for their pets, up 56% since 2018
- Fresh food: Freshpet grew net sales 13.0% in 2025 and guides to 7% to 10% growth in 2026
- Subscriptions: Autoship produced 83.3% of Chewy's net sales, up from 79.2%
- Store fleets: Petco plans 15 to 20 net store closures in 2026 after a 1.6% comparable sales decline
- Online share: Bloomberg Intelligence expects U.S. pet ecommerce to reach nearly $60 billion by 2030, about 30% of sales, up from 22%
Spending caution and premium buying are running at the same time. A shopper who cuts back on toys can still pay for their pets' fresh food on subscription, so the retailers and brands growing fastest sell the recurring basket. Tools covered in our trend research rankings and retail analytics rankings track this shift at the SKU level, and the retail market intelligence guide covers the category view.
How this report's statistics were collected
Every number above comes straight from the horse's mouth: the trade body, federal agency, insurer association, shelter database or listed company that produced it. Each trusted source answers one question well. APPA covers spending, APPA and AVMA (the professional body for U.S. veterinarians) cover pet ownership, NAPHIA covers insurance and Shelter Animals Count covers shelters and the communities they serve.
The methods differ in ways that move the totals:
- Household surveys: AVMA (7,519 respondents, spring 2025), Pew (5,073 adults, April 2023) and UK Pet Food's Kantar panel (8,951 adults, January 2026)
- Trade estimates: APPA's annual spending figures and its National Pet Owners Survey
- Government data: BLS household spending and BEA personal consumption accounts
- Administrative data: SAC and Best Friends shelter submissions, plus insurer submissions to NAPHIA
- Company filings: Chewy, Petco, Zoetis and Freshpet annual results
APPA's full survey tables sit behind paid access, so the public figures here come from its releases and summary pages. Read between the lines of each method note and most gaps come down to survey design and sample frames, which our guide to market research methods walks through, and the secondary market intelligence guide covers how to cite a published figure.
Teams buying consumer panels for this work can compare vendors in our market research tools ranking or read up on consumer intelligence.
Where every pet figure was published, and the 2026 totals still to come
Spending and ownership: americanpetproducts.org (2026 State of the Industry release of 26 March 2026, 2025 State of the Industry release of 26 March 2025, 2025 Dog & Cat Report of 24 June 2025, fish and reptile report of 24 September 2025, bird, small animal and horse report of 3 December 2025, industry trends and stats page) and petfoodprocessing.net (1 April 2026).
Surveys and forecasts: avma.org (2025 Pet Ownership and Demographics Sourcebook), pewresearch.org (7 July 2023), freedoniagroup.com (Packaged Facts US Pet Market Outlook 2026-2027) and bloomberg.com (Bloomberg Intelligence, 24 March 2023).
Federal data: fred.stlouisfed.org (BEA personal consumption and BLS Consumer Expenditure Survey series) and bls.gov (consumer expenditures release of December 2025). Costs and insurance: forbes.com (Forbes Advisor, updated 3 September 2026) and naphia.org (State of the Industry 2026 highlights of June 2026, 2025 report release of 22 April 2025).
Shelters: shelteranimalscount.org (2025 annual data report and kitten-season analysis), aspca.org (shelter statistics page, acquisition release of 10 December 2025), aspcapro.org (3-3-3 guide), bestfriends.org (2025 National Shelter Data Report, release of 15 April 2026) and humanepro.org (Pets by the Numbers).
Companies: investor.chewy.com (25 March 2026), ir.petco.com (11 March 2026), news.zoetis.com (12 February 2026) and investor.freshpet.com (full-year 2025 results). UK and Europe: ukpetfood.org (31 March 2026), pdsa.org.uk (PAW Report 2025) and europeanpetfood.org (FEDIAF Facts & Figures, 12 June 2025).
Every figure was checked against its source on 4 October 2026. NAPHIA's full 2025 report now returns a 404, so its 2023 and 2024 figures come from the April 2025 release. APPA keeps its full survey tables behind paid access. No publisher cited here has full-year 2026 spending, insurance or shelter totals yet, so the 2026 numbers on this page are projections, guidance and survey answers.
Frequently asked questions
How big is the pet industry in the USA?
The American Pet Products Association puts U.S. pet industry expenditures at $158 billion for 2025 and $165 billion projected for 2026. The Bureau of Economic Analysis counted $188.8 billion of consumer spending on pets, pet supplies and related services for 2024.
Is the pet industry growing or shrinking?
It's growing. APPA recorded 3.7% growth in spending on pets in 2025 and expects 4.4% in 2026, about 2 points of which is inflation. Packaged Facts forecasts 3.9% a year through 2030.
What percentage of Americans own pets?
APPA says 95 million U.S. households owned a pet in 2025, up from 94 million, about 71% of homes, in 2024. AVMA counts 58.6% of households, and Pew found 62% of American adults own a pet.
What pet products are in high demand?
Pet food and treats lead at $68.3 billion in 2025. Within that, 41% of dog owners buy premium food and 53% buy supplements, per APPA, and Freshpet's fresh food sales grew 13.0%.
What are the key trends in the pet care industry for 2026?
Five trends stand out in the 2025 and 2026 data. Owners are buying premium and fresh food, ordering on subscription and paying higher pet insurance premiums. Other services such as grooming and boarding grew 8%, and 22% of owners cut their overall pet spending.
What are the statistics for animal shelters in the USA?
Shelter Animals Count recorded 5.8 million dogs and cats entering shelters and rescues in 2025. Of those, 4.2 million were adopted, 638,000 went back to their owners and 597,000 were euthanized.
What percentage of shelter animals are euthanized?
About 10% of shelter pets. SAC counted 597,000 euthanized against 5.8 million intakes in 2025, roughly 11% of dogs and 9% of cats. Best Friends puts its save rate at 82.5% across nearly 4,000 shelters.
What is the biggest problem in animal shelters?
The documented challenges are dogs and kittens. Dogs leave shelters alive at lower rates than cats, and in 2025 SAC counted 320,000 dogs euthanized from 2.8 million intakes. Kittens from community cats filled 59% of cat intake, with peaks in May and September, and 20 million pets live in underserved communities with thin access to care.
What is the 3-3-3 rule for shelter pets?
The ASPCA's 3-3-3 guide tells families what to expect from an adopted pet's adjustment: 3 days of stress, 3 weeks of settling into routines and training, and about 3 months to feel at home.
Bottom line
The U.S. pet industry is a $158 billion market by APPA's count, spread across tens of millions of households, and grows at about 4% a year, with food taking 43% and vet care 26%. Pet insurance, fresh food and subscriptions are the fastest-moving lines for pet owners and the companies selling to them.
The headline numbers depend on the publisher. Households range from 77.5 million to 95 million, spending from $119.5 billion to $188.8 billion and shelter intake from 4.7 million to 5.8 million. For anyone building a market model, consistency is the top priority, so pick one source per question, cite its year and keep it for every year in the model.