Total Addressable Market Template
 By Jan Suski. I go deep on every review, checking every number against its source and digging up details other coverage misses, a habit from six years of SEO and link building for tech companies. Bylines at Surfer, Brand24, and Senuto. How the scoring works.
·
A total addressable market template turns the number every investor asks for first into a calculation with sourced assumptions behind every input. A slide with a big font on it collapses under the first follow-up question.
The download is a spreadsheet: a segment-definition sheet, three separate TAM calculations (top down, bottom up, and value theory) that cross-check each other, a SAM narrowing sheet, a SOM capture-rate sheet, and a one-page slide narrative formatted for a pitch deck.
This page covers what TAM, SAM, and SOM mean, the three ways to calculate a total addressable market, a worked example carrying the numbers from a target-customer count through to a serviceable obtainable market figure, and the mistakes that make investors distrust a TAM slide on sight.
It's built for founders and product teams sizing a market ahead of a raise, and for anyone entering a new vertical who needs a number that survives the first hard question in the room: how did you get that figure?
Public companies run the same math at a different scale. Morgan Stanley estimated in 2015 that Apple's addressable market could grow from $800 billion to $3.4 trillion by 2020, a figure Wikipedia's entry on TAM cites directly; the discipline that sizes billion-dollar public companies produces a credible number for a seed-stage startup too.
Download the free total addressable market template
Download the total addressable market template (XLSX)Five tabs: assumptions with a source column, the three-method TAM comparison, SAM narrowing, SOM capture rate, and a slide narrative ready to paste into a deck.
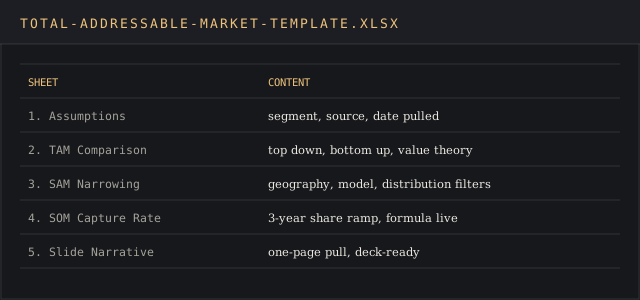
The primary file is an XLSX workbook. Sheet one logs the target segment and every assumption with a source column. Sheet two runs top down, bottom up, and value theory side by side so the three methods can argue with each other before an investor gets the chance.
Sheet three narrows TAM to SAM by the filters that apply: geography, business model fit, and distribution reach. Sheet four turns a current or projected market share into a SOM figure. Sheet five is the slide narrative, a single page stating the final TAM, SAM, and SOM numbers with sources, ready to paste into a deck.
Every cell that isn't a formula is pre-filled with the worked example below. Replacing the example with a real target segment means overwriting numbers; the formulas stay in place.
What is a total addressable market?
Total addressable market TAM represents the total revenue a company could earn in a given year if it captured 100% of the market for a product or service. Wikipedia's entry on the term, drawing on Steve Blank and Bob Dorf's The Startup Owner's Manual, defines it as the maximum revenue or unit-sales opportunity available if the whole addressable market is achieved.
No company hits that number. A monopoly serving every possible buyer doesn't exist outside a textbook, which is why Salesforce calls TAM the "blue sky" figure: useful for sizing the ceiling, useless as a forecast. Investors use TAM to size the investment opportunity. The number that forecasts next year's revenue is SOM.
TAM, SAM, and SOM
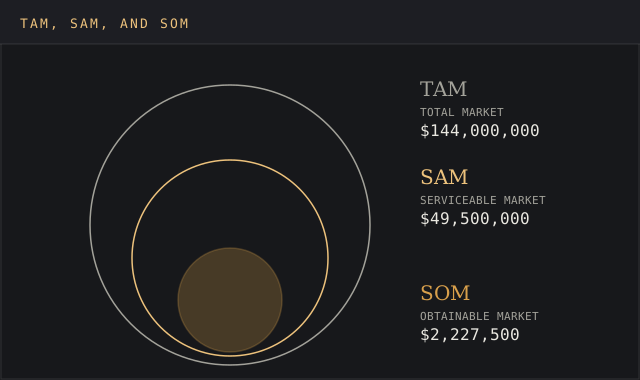
TAM, SAM, and SOM are three metrics describing the same market at different scales, and market sizing work leans on all three so often that precise definitions matter. TAM includes every potential customer, reachable or not.
Serviceable addressable market (SAM), sometimes written serviceable available market, is the slice of TAM a company has access to, narrowed by geography, distribution, and product fit. Wikipedia frames SAM as the portion of TAM reachable through a company's distribution footprint, and Antler's guide adds that SAM accounts for geographic limits and differing customer needs, since no product serves an entire market regardless of size.
Serviceable obtainable market (SOM), sometimes written service obtainable market, represents the share of SAM a company can realistically capture given current competition, resources, and sales capacity. For an early-stage company it's a projection; for an established one it's measurable as actual market share.
Antler's guide notes SOM is calculated by applying last year's market share to this year's SAM. Founders without a sales history can still build hypothetical SOM scenarios by applying an assumed share to a new SAM as the market grows, so long as the assumptions behind them are stated.
Layer | Answers | Narrowed by |
|---|---|---|
TAM | What's the ceiling? | Nothing; it's the whole market |
SAM | What can we reach? | Geography, business model, distribution |
SOM | What can we win? | Competition, sales capacity, time |
Three ways to calculate TAM
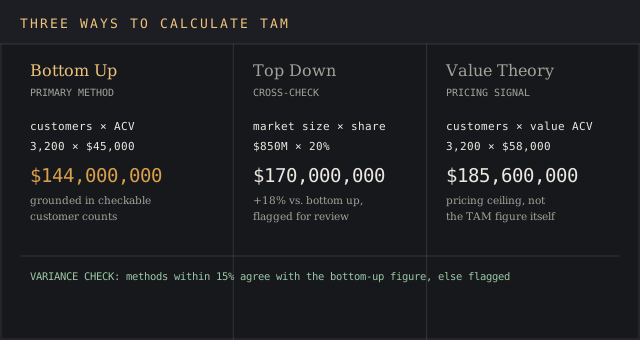
Most market-sizing guides stop at two methods. A total addressable market template built for a fundraising slide needs a third, because the strongest TAM slides triangulate across all three and use the gaps between them as the argument.
Top down
The top down approach starts with a published industry figure and narrows it by the share relevant to the product. Jared Sleeper, a partner at Matrix Partners writing on For Entrepreneurs, calls this his least favorite framing. It leans on an analyst firm's published methodology; the founder runs no original research to check it.
It also assumes a disruptive product won't change the size of the category it's entering, a mistake Sleeper traces in Uber's own early materials, which sized the opportunity against existing taxi revenue and missed the larger pool of trips a superior product could create. Sleeper cites Uber's early San Francisco ridership data as exactly that kind of original research.
Bottom up
The bottom up approach starts with the total number of potential customers and multiplies by average revenue per customer, sometimes expressed as annual contract value for subscription businesses: TAM = potential customers × average revenue per customer. Salesforce's guide walks through a software company example: 30,000 potential North American clients at a $5,000 average account value gives a $150 million TAM.
Slideworks, written by two ex-McKinsey and ex-BCG consultants, calls bottom up the generally preferred method among market sizing companies, since it's grounded in checkable numbers a founder can defend line by line.
Value theory
Value theory prices the product by the value it delivers to the customer, treating the current price list as one data point among several. Sleeper describes it as "a dark art, but nonetheless useful": estimate what a customer would pay for the problem solved, then apply a capture rate to that value.
Salesforce frames the method as useful for a new or unproven product category or a fast-moving sector, where no comparable price list exists yet. Value theory won't replace bottom up as the number on the slide. It shows if current pricing leaves money on the table.
The parts of the file
Segment and assumptions. Target customer definition, every number's source, and the date it was pulled.
TAM comparison. Top down, bottom up, and value theory calculated side by side, with the gap between them flagged automatically.
SAM narrowing. Geography, business model fit, and distribution reach applied to TAM.
SOM capture rate. Current or targeted market share applied to SAM to calculate SOM, with a three-year ramp for a pre-revenue segment.
Slide narrative. The final TAM, SAM, and SOM figures with sources, formatted for a pitch-deck slide.
The slide-narrative sheet is built to drop straight into a go-to-market plan or a fundraising deck without reformatting.
How to fill in the template, step by step
DARPA's SBIR/STTR guidance on determining market size lays out a five-step process built for hardware founders, and it transfers cleanly to any product.
First, research the overall market: its size, growth rate, market trends, and existing segments, before talking to a single customer. Second, collect TAM data through market research: industry reports, trade journals, and, if any competitors are public, their own financial reports. Step two's industry reports and trade journals are the same primary sources a market research report pulls from, organized instead around a single market-sizing question.
Third, segment that market, since a single TAM figure usually hides several sub-markets with different buyers inside it. Fourth, apply the segmentation to the specific product to isolate SAM; the limiting factor might be a performance gap, a design choice, or a constraint like geography or regulation.
Fifth, rank potential customers within the target market by fit and by influence to determine which ones to pursue first: an early customer who shapes adoption for ten more carries more weight than one who shapes none.
McKinsey and BCG's segmentation discipline, documented in Slideworks' guide, adds one rule for every step: keep segments MECE, mutually exclusive and collectively exhaustive, so no customer is double-counted and none falls through a gap.
Worked example: sizing a new vertical
A mid-size B2B SaaS vendor sells shift-scheduling software to retail chains and is evaluating entry into hospital nurse-scheduling, a new vertical with a different buyer and budget cycle.
Target segment: US hospitals and health systems with 100 or more beds that run centralized nurse scheduling and don't yet license a dedicated platform, an estimated 3,200 organizations spanning private hospitals, nonprofit systems, and public health networks. Current list price averages $45,000 a year per hospital.
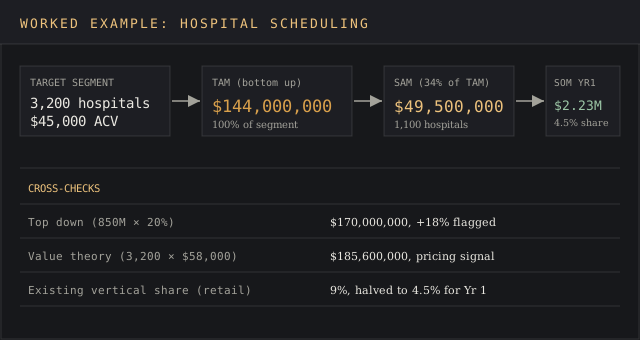
Bottom-up TAM: 3,200 hospitals × $45,000 = $144,000,000.
Top-down cross-check: a workforce-management market report sizes the global clinical staff-scheduling software category at $850 million; the US acute-care hospital slice runs roughly 20% of that, or $170 million. That's 18% above the bottom-up figure, and the gap traces to the report folding in outpatient and long-term-care facilities the target-segment definition excludes. The bottom-up number stays primary.
Value theory: nurse overtime and agency-staffing premiums cost the average target hospital an estimated $290,000 a year. Capturing roughly 20% of that unlocked value as price implies an ACV near $58,000, above the current $45,000 list price. That is a pricing signal. TAM itself stays anchored to the bottom-up figure.
SAM: narrow to the 100-to-400-bed range, excluding the largest health systems that typically build scheduling tools in-house. That's 1,100 hospitals × $45,000 = $49,500,000, or 34% of TAM. Narrowing SAM by bed-count range is a segmentation call; the customer segmentation template extends the same filtering logic to an existing customer base once the vertical is live.
SOM: the vendor holds roughly 9% share in its existing retail vertical. Applying half that rate in year one, since the new vertical carries no track record, gives 4.5% of SAM: $49,500,000 × 4.5% = $2,227,500.
TAM $144M, SAM $49.5M, SOM $2.23M, every step traced to the 3,200-hospital count and the $45,000 ACV on the assumptions sheet.
Building a TAM slide investors trust
Antler's investor guide lists five habits behind a TAM slide that lands well: lead with bottom up, since a top-down number reads as unresearched; don't fold in customers outside the actual target audience to inflate the figure; state the geography explicitly, since an unlabeled TAM defaults to reading as global; keep the pricing math ready even if it never appears on the slide; and show how the TAM expands over time as the product roadmap reaches new segments.
Facebook's earliest investor deck sized its market by counting college students eligible for a school email address, an example Antler cites as an early, credible TAM slide that helped the company raise money.
There's a size problem behind that kind of slide too: Antler describes investors wanting a "Goldilocks" TAM. Too small and the business hits a ceiling before it matters; too large and the market reads as too competitive to defend a position in.
A $144 million TAM with a credible path to a few million in SOM sits in that range for a Series A-stage vertical SaaS business. A $10 billion TAM built by including every hospital, clinic, and long-term-care facility on earth reads as the opposite of researched.
A credible TAM number invites the next question investors ask: how the company wins share inside it. A competitive analysis template answers that once the TAM slide has done its job.
Common mistakes
Salesforce names two failure patterns worth watching for on any total addressable market template: sizing the TAM too broad by including segments the product doesn't serve, and treating the number as fixed when it needs reevaluating at least annually.
A third shows up constantly in pitch decks: presenting only a top-down TAM estimate, with no bottom-up or value-theory cross-check. That is the fastest way to have a TAM slide dismissed before the rest of the deck gets a fair hearing.
A fourth: doing the research online and never confirming a number with an actual customer. Our market research methods guide covers other primary sources. Avoiding these patterns is most of what separates a credible TAM number from a guess.
The software question
The download is an XLSX file built for Excel and Google Sheets, with live formulas across all five sheets; the TAM number the workbook outputs stays identical whichever one is used. Opening it in Google Sheets preserves every formula; Apple Numbers keeps the numbers but can flatten some conditional formatting.
FAQ
What does TAM stand for?
Total addressable market, sometimes written total available market. Both mean total revenue at 100% market share.
What is a TAM plan?
Not a standard term with one fixed meaning; it usually refers to the market-sizing section of a fundraising plan that states TAM, SAM, and SOM with their sources.
What is a TAM?
The maximum annual revenue a product or service could generate if it captured every potential customer in its market, with zero competition.
What is a TAM report?
A document stating the TAM figure, the calculation method, and the source for each input.
What is a TAM chart?
Usually the nested-circle diagram: TAM, SAM, and SOM as three concentric shapes, sized to scale, with each layer's dollar figure labeled inside it.
How do I calculate the TAM?
Multiply potential customers by average revenue per customer for a bottom-up figure, or start from a published industry number and narrow it for a top-down one. Run both, and add a value-theory estimate if the product is priced against the value it unlocks. A category's existing list price won't apply to a product with no comparable predecessor.
How to build a total addressable market?
Define the target segment precisely, gather data from at least two calculation methods, narrow TAM to SAM with real filters, and apply a realistic capture rate to reach SOM. The template above walks the same five steps.
Can you give me an example of a TAM, SAM, and SOM?
The worked example above: a scheduling-software vendor entering hospitals finds a $144 million TAM across 3,200 target hospitals, narrows it to a $49.5 million SAM by bed-count range, and models a $2.23 million SOM at a 4.5% first-year capture rate.
What is a total addressable market?
The total revenue opportunity for a product or service if it reached 100% of its potential customers, expressed as an annual dollar figure or unit-sales count.
What is a good total addressable market?
One large enough to support the growth a business is chasing and small enough to be credible. A multi-billion-dollar TAM built by defining the market too broadly does more damage to a pitch than a smaller, defensible figure with a clear SAM and SOM behind it.
Bottom line
A total addressable market template earns its place when it forces the same discipline onto every new market a company considers: define the segment, run more than one calculation method, and defend the smallest number in the room as carefully as the biggest one.
Download the workbook, replace the hospital-scheduling example with a real target segment, and let the three TAM methods disagree with each other before an investor gets the chance to.
For a broader, non-fundraising approach to sizing any market, the market sizing template covers that ground with a full six-step methodology and a wider set of data sources; this template is built specifically for the number that goes on a pitch-deck slide, the one investors use to judge market potential.