Customer Segmentation Template
 By Jan Suski. I go deep on every review, checking every number against its source and digging up details other coverage misses, a habit from six years of SEO and link building for tech companies. Bylines at Surfer, Brand24, and Senuto. How the scoring works.
· Prefer this source on Google
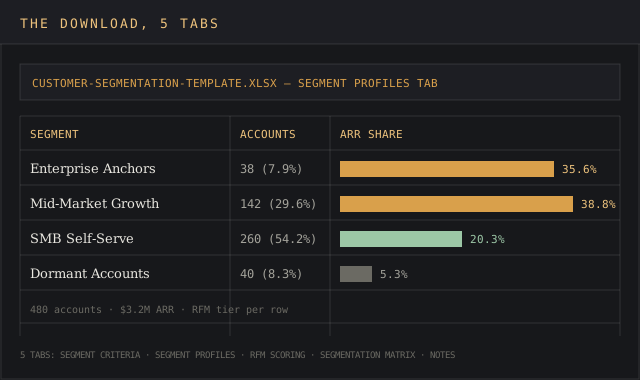
Get the customer segmentation template
An Excel workbook that turns a customer list into named segments, scores each one with RFM, and ranks them on a segmentation matrix by size & revenue.
Download XLSXA customer segmentation template is a working spreadsheet. It takes a customer list and a handful of fields, demographic, geographic, psychographic, behavioral, and turns them into smaller groups sharing characteristics like company size or purchasing habits.
Each group gets a size, a revenue share, and a next action. Every field feeds a market segmentation template as much as a customer one; the worksheet doesn't care if the row is a signed account or a prospect a sales team is still qualifying.
This page covers the four bases behind that split, the market segmentation matrix used to prioritize the resulting groups, a full worked example on 480 accounts, and the RFM method for scoring segments by how customers behave.
It's built for anyone who owns a customer base past the point where a founder can name every account from memory: a marketing team choosing which segment gets which campaign, a customer success lead deciding where renewal risk sits, or a product marketing lead scoping the target audience before a launch.
Market research that stops at "our customers are mostly mid-market" misses the point and tells a team nothing about where the revenue concentrates.
Segmentation enables businesses to route limited resources toward the account tier that carries the most value, keeping marketing campaigns concentrated there and out of a customer base that doesn't behave evenly. A flat list treats a 38-account enterprise tier the same as a 260-account self-serve tier, and they don't churn the same way, buy the same way, or need the same service level.
Download the free customer segmentation template
Download the customer segmentation template (XLSX)Five tabs covering the segment criteria worksheet, the segment profiles, RFM behavioral scoring, and a prioritization matrix, pre-filled with a worked example and ready to clear for your own customer data.
The file opens in Excel, Google Sheets, or LibreOffice Calc without reformatting; the RFM tab's nested IF formulas carry over to Sheets unchanged, and reusing them can save time against rebuilding the same logic from scratch for every new customer segmentation project.
What a customer segmentation template does
Market segmentation divides a customer base into groups sharing enough in common, similar demographics, shared purchasing habits, comparable social class or income band, that a single message, price, or service level can serve the whole group. Customer segmentation is the same operation run on the accounts you already have.
The criteria worksheet also captures psychographic detail a CRM field never records on its own: stated customer needs, pain points, preferences, and interests, gathered from support tickets and sales notes. Those inputs feed the segment profiles the same way demographic and behavioral data do.
The template's job is narrower than a full customer intelligence profile. A customer intelligence template tracks needs, satisfaction, and buying behavior across the entire customer experience as one continuous picture.
This one exists to define the lines between groups and hand each group a size, a value, and an owner, which is the step a broader profile doesn't force a team to finish. A business that wants to tailor pricing or support by group needs the lines drawn first; the benefits of a shared view come after that.
The four bases: demographic, geographic, psychographic, and behavioral segmentation
Demographic segmentation is usually the starting basis, since company size, industry, and job title already sit in the CRM before any behavioral data gets collected. Wendell R. Smith's 1956 paper in the Journal of Marketing first framed segmentation as an alternative to blanket product differentiation.
Philip Kotler's Marketing Management, now past its 15th edition, later grouped the remaining criteria into four bases, still the clear framework behind most customer segments and the marketing strategies built on top of them.
| Basis | Typical criteria | Drives the decision on |
|---|---|---|
| Demographic | Company size, industry, job title (B2B); age, income, social class, education (B2C) | Who gets which product tier or price point |
| Geographic | Region, location, timezone, urban/rural, regulatory zone | Localization, event targeting, GDPR or CCPA handling |
| Psychographic | Values, priorities, risk tolerance, stated preferences | Brand positioning and content angle |
| Behavioral | Purchasing habits, login frequency, feature adoption, brand loyalty | Lifecycle campaigns, churn risk, RFM scoring |
Most working segmentation strategy blends two of the four bases, taking the best of both worlds in the process. A demographic filter narrows the field to the right target market and the right audience for a launch; a behavioral characteristics layer on top of it decides which of those enterprise prospects get an expansion pitch and which get a retention call instead.
How to create customer segments, step by step
Name the business question first. "Which accounts should get the new feature announcement" and "which accounts are at renewal risk" produce different market segments from the same customer base.
Map the customer data you already have. CRM fields, product usage logs, support tickets, and billing history each supply a different segmentation basis, and each is worth double checking against the source system before it goes in the worksheet.
Pick a segmentation basis, or combine two. Firmographic plus behavioral is the most common B2B pairing; demographic plus psychographic is more common in a consumer business selling one specific product line.
Set the cutoffs. A criterion like "enterprise" needs a number attached to it (250+ employees, $25,000+ ARR) or every reviewer draws the line at a different place, and target customers end up split across two segments by accident.
Score behavioral segments with RFM. Recency, frequency, and monetary value turn login logs and billing data into a comparable score across accounts and identify which ones are sliding.
Plot segments on the market segmentation matrix. Size against value shows growth potential at a glance, without forcing a read through eleven rows of a spreadsheet.
Assign an owner, a channel, and a message to tailor to each segment. A segment nobody's accountable for is a case of passing the buck, and it reverts to a spreadsheet nobody opens again.
The market segmentation matrix: plotting segments by size and value
The prioritization tab plots each segment on two axes, account count against share of annual recurring revenue, and sorts the four resulting quadrants into an action: Invest in the segment carrying disproportionate value, Grow the segment with headroom and growth potential, Automate service for the high-count, lower-value segment, and Reactivate or sunset the segment losing both.
| Quadrant | Reads as | Typical action |
|---|---|---|
| Small & high-value | Concentrated revenue, low headcount | Invest: dedicated owner, premium service |
| Large & high-value | Scale with growth potential | Grow: expansion campaigns, sales teams follow up |
| Large & low-value | Volume, thin margin | Automate: self-serve resources, targeted ads over outbound |
| Small & low-value | Declining engagement | Reactivate or sunset the segment |
A grid like this one helps a team prioritize efforts, without spreading a fixed marketing budget evenly across specific segments that don't return it evenly. The revenue axis is a stand-in for lifetime value, current ARR times an expected renewal-adjusted horizon, which is what keeps the Invest quadrant from just rewarding whichever segment billed the most last month.
It also gives product marketing, sales teams & marketing teams one shared source to reference, replacing the three competing lists kept for the same launch; sales teams track customer accounts by segment for outbound sequencing, working each segment in turn and dropping the flat end-to-end list.
Behavioral patterns: scoring segments with RFM
RFM (recency, frequency, monetary value) scores each account on how recently it engaged, how often, and how much it spent, then sums the three into a single number. Arthur Hughes popularized the method for database marketers in his 1994 book Strategic Database Marketing, and Jan Bult and Tom Wansbeek gave it a formal statistical treatment in Marketing Science in 1995, showing that RFM-based selection cut direct mail costs against a random mailing list.
| Score | Recency | Frequency (per month) | Monetary (ARR) |
|---|---|---|---|
| 5 | 0-7 days since last activity | 20+ logins | $25,000+ |
| 4 | 8-14 days | 10-19 logins | $10,000-$24,999 |
| 3 | 15-30 days | 5-9 logins | $5,000-$9,999 |
| 2 | 31-60 days | 2-4 logins | $1,000-$4,999 |
| 1 | 61+ days | 0-1 logins | Under $1,000 |
Add the three scores and a total of 13 to 15 reads Champion, 9 to 12 reads Loyal, 5 to 8 reads At Risk, and under 5 reads Dormant. Brand loyalty is a stated preference; customer loyalty measured this way, through frequency and recent activity, is what predicts a renewal.
The RFM tab runs the scoring with a nested IF() per column, so the thresholds stay visible and editable in the formula bar, a highly effective way to catch a segment sliding in the nick of time, before the renewal date makes it official.
Worked example: segmenting 480 accounts and $3.2M in ARR
A mid-market SaaS vendor with 480 active accounts and $3.2M in annual recurring revenue ran its customer base through the template on demographic and behavioral criteria together, producing four different market segments from two bases stacked on top of each other.
| Segment | Accounts | ARR | Renewal | RFM tier |
|---|---|---|---|---|
| Enterprise Anchors | 38 (7.9%) | $1,140,000 (35.6%) | 96% | Champion (15) |
| Mid-Market Growth | 142 (29.6%) | $1,240,000 (38.8%) | 84% | Loyal (10) |
| SMB Self-Serve | 260 (54.2%) | $650,000 (20.3%) | 61% | At Risk (7) |
| Dormant Accounts | 40 (8.3%) | $170,000 (5.3%) | flagged for win-back | Dormant (4) |
Enterprise Anchors is defined demographically (250+ employees, $25,000+ ARR) and averages $30,000 per account, 22 logins a month, and activity within the last four days, which is why its RFM total lands at the ceiling and the matrix places it in the Invest quadrant.
Dormant Accounts is defined behaviorally: 60 or more days since last login, spend averaging $4,250 per account, and a total under 5.
The segment that needed a win-back campaign is also the segment the RFM score flags lowest. That's hitting the nail on the head, the agreement a segmentation exercise is supposed to produce and the benefit of running both methods on the same customer base.
Mid-Market Growth carries the largest ARR share at 38.8% from 29.6% of accounts, ahead of Enterprise Anchors on total revenue despite a lower renewal rate, the kind of result a headcount-only view of the customer base would miss entirely, and it lands squarely in the Grow quadrant of the matrix.
Common mistakes when building customer segments
- Segmenting by demographics alone and skipping behavior. Company size and industry identify who to sell to; login frequency and purchasing habits identify who's about to leave.
- Setting cutoffs without a number attached. "Growth accounts" and "high-value accounts" both need a dollar figure or a headcount range in the segment profile; a bare label leaves a reviewer guessing six months later.
- Building segments nobody owns. A segmentation matrix with no assigned channel, owner, or tailored service tier reverts to a static export the moment the person who built it moves to another project.
Excel, Google Sheets, or a CDP?
The workbook covers segmentation for a customer base a marketing or customer success team can review by hand, roughly up to a few thousand accounts. Past that volume, or where segment membership needs to update in real time as usage changes, a customer data platform with native segmentation rules replaces the spreadsheet.
The RFM formulas still work as scoring logic inside that platform; the actionable insights transfer directly, and the template just proves the thresholds on a smaller set first.
More free templates for customer research
The customer intelligence template covers needs, satisfaction, and buying behavior across the base as one continuous profile. The user persona template builds a single fictional buyer from qualitative research, a different job than scoring the accounts already on the books. Both sit beside this one on the templates hub, along with market sizing, win-loss analysis, and a dozen others. Free templates are a dime a dozen, but each one earns its spot.
FAQ
How do you create market segments?
Start with the business question the segments need to answer, map the customer data available, pick a segmentation basis such as demographic or behavioral, set numeric cutoffs for each group, then score and prioritize by size and revenue.
What is a market segment example?
"Accounts with 250 or more employees paying $25,000 or more in annual recurring revenue" is a market segment example built on demographic criteria; "accounts with no login in 60 or more days" is one built on behavioral criteria.
What are the 5 basic market segmentation types?
Most textbooks name four: demographic, geographic, psychographic, and behavioral. A fifth, firmographic, splits demographic into its B2B form, company size, industry, and revenue, when the audience is other businesses.
What are the 6 main types of market segmentation?
Beyond the four core bases and firmographic, technographic segmentation groups B2B accounts by the software and infrastructure they already run, which shapes if a new tool fits their stack or competes with something already in it.
What is a marketing segmentation table?
A marketing segmentation table lists each segment as a row against a fixed set of columns, criteria, size, revenue, and a primary need or channel, so specific segments can be compared side by side in one table, a clearer format than separate paragraphs. In a nutshell, one table beats reading through several separate write-ups to make the same comparison.
What are the four types of market segmentation?
Demographic, geographic, psychographic, and behavioral, the taxonomy Kotler's Marketing Management made standard; most working segmentation strategy combines two of the four bases.
What's the difference between customer segments and buyer personas?
A segment is a slice of the existing customer base defined by data already on file, an account count and a revenue figure attached. A buyer persona is a single composite profile built from qualitative research to represent a type of buyer.
A persona doesn't track where an account sits in the buyer's journey or carry a size or a dollar figure the way a segment does.
Bottom line
To cut to the chase, reach for this template when the customer list already exists and the job is dividing it: naming the groups, sizing them, and scoring them by behavior so campaigns, service tiers, and renewal outreach can target the right one.
It won't build a persona from scratch or replace a full-base customer intelligence profile, and it isn't market research for a market you haven't entered yet.
The RFM tab and the segmentation matrix are the parts worth keeping past the first pass. Segment definitions and the marketing strategies built on them change as a business and its customer base grow, but recency, frequency, and monetary scoring stays a reliable way to catch a segment sliding toward Dormant before the renewal date makes it official.