Direct mail statistics 2026: 56.8 billion Marketing Mail pieces and a 161% house-list ROI
 By Jan Suski. I go deep on every review, checking every number against its source and digging up details other coverage misses, a habit from six years of SEO and link building for tech companies. Bylines at Surfer, Brand24, and Senuto. How the scoring works.
The numbers U.S. and UK direct mail, checked 14 October 2026
Volume has fallen by 45% since 2007, and USPS now earns 28% more per Marketing Mail piece than it did in fiscal 2019.
House lists return close to five times what prospect lists do, so list quality decides most of a campaign's outcome.
Advertising mail makes up 62% of what lands in a U.S. household mailbox, about seven pieces a week.
The U.S. Postal Service delivered 56.8 billion pieces of Marketing Mail in fiscal 2025, down 1.3% on the year, while the revenue it earned from them rose 2.3% to $15.7 billion. Those are the USPS fiscal 2025 results, published November 14, 2025. USPS carried fewer pieces and earned more on each one. That trade sits under every direct mail statistic on this page.
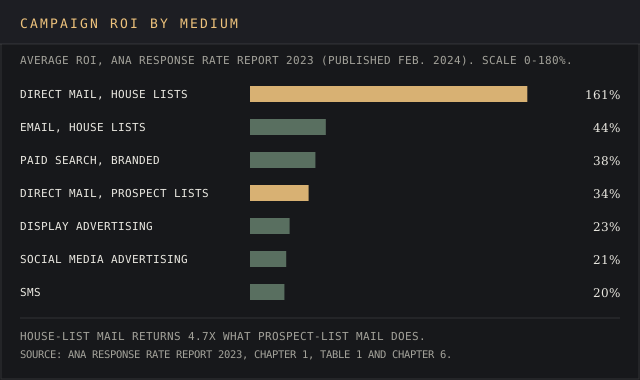
On the return side, direct mail sent to house lists produced a 161% ROI in the ANA Response Rate Report 2023, published February 22, 2024. That was the top ROI of any medium the Association of National Advertisers measured. The same report put mail sent to cold names at 34%.
This report collects direct mail statistics on volume, household reach, response rate and ROI, consumer reading habits, spend and direct mail campaign cost, each figure linked to the body that published it. It's written for marketers deciding how much of the marketing mix to give physical mail as an advertising channel against digital marketing, and for analysts tired of recycled numbers.
Direct mail marketing has better primary data than the five figures copied across most direct mail pages, and the sections below use it.
Direct mail statistics from the US Postal Service
Marketing mail is the single largest class the US Postal Service carries. Its 56.756 billion pieces in fiscal 2025 made up 52% of the 108.7 billion total mail pieces USPS delivered, ahead of First-Class Mail at 42.0 billion. The USPS 2008 annual report puts the class, then called Standard Mail, at 103.5 billion pieces in 2007.
The pandemic took the biggest single bite. The USPS fiscal 2020 results show Marketing Mail falling 11.5 billion pieces in one year, from 75.7 billion to 64.1 billion, a 15.2% drop. Volume never came back to the 2019 level.

Revenue tells a different story. The class earned $16.36 billion in fiscal 2019 on 75.65 billion pieces, about 21.6 cents a piece. Fiscal 2025 earned $15.73 billion on 56.76 billion, about 27.7 cents. Postage increases are carrying the line, and a mailer paying 28% more per piece has to get more from each direct mail piece to stand still.
What the average American household receives
The average household received about 620 pieces of mail in 2025, against roughly 1,480 at the 2005 peak, according to Elena Patel's July 2026 Brookings analysis of the USPS Household Mail Survey, which samples about 5,200 households a year. Advertising mail held 62% of household mail in 2025, up from 59% in 2010.
Run the two numbers together and the average American household gets roughly 384 advertising mail pieces a year, about seven a week. That scarcity is the case physical mail makes to a media planner: each of the direct mail recipients sorts a short stack, and the direct mail piece in it competes with six others that week.
The Postal Regulatory Commission's fiscal 2025 compliance determination, issued March 27, 2026, counts average volume per delivery point at 638 pieces, close to the household survey's figure.
Average direct mail response rate, conversion rates and ROI
The average response rate most direct mail marketing pages quote has a primary source, straight from the horse's mouth: the ANA/DMA 2018 Response Rate Report, published November 15, 2018, measured a 9% direct mail response rate. A Canada Post datagram cites the same report for a direct mail response rate 5 to 9 times higher than digital direct marketing media, the category that includes email.
The 2023 edition moved its headline from response rate to ROI. Its ROI by medium table ranks every channel the ANA measured:
| Medium (ANA Response Rate Report 2023) | Average ROI |
|---|---|
| Direct mail, house lists | 161% |
| Email, house lists | 44% |
| Paid search, branded keywords | 38% |
| Direct mail, prospect lists | 34% |
| Digital display advertising | 23% |
| Social media advertising | 21% |
| SMS | 20% |
Direct mail ROI sits at both ends of that table. Mail to existing customers returns 3.7 times what email to the same customers does. Mail to prospect lists returns 34%, below paid search & branded email but above display and social ads. The ANA's direct mail chapter names house-list mail the top ROI of all media in the study, ahead of every digital marketing channel.
The highest response rates come from people who already buy from you, and the direct mail campaign that mails them first sets its own benchmark. The UK numbers agree: the JICMAIL Response Rate Tracker, built from nearly 5,000 campaigns submitted by fifteen industry organisations, puts ROI at £11.50 per £1 for warm direct mail against £2.0 for partially addressed mail. An average conversion rate that blends both lists describes nobody's campaign.
Conversion itself is measured at the household. JICMAIL's Q2 2026 panel found 6% of all mail items prompted a purchase, and 41% of those mail-driven purchases happened in a physical store, up from 34% a year earlier. Four in ten mail-driven sales ended at a till.
Spend per buyer moves too. PebblePost and Alter Agents' 2020 study The Shopping Shift, cited in a 2022 Canada Post datagram, found direct mail recipients spent 28% more than people who didn't receive mail, and 60% of shoppers said mail influenced their purchase decision. PebblePost sells programmatic mail, so weigh the source.
Why published direct mail statistics diverge
The direct mail industry has three published size figures, and they explain most of the contradictions between direct mail statistics pages. The figures sit on different scales. Read between the lines and each house measures a different slice of the money:
| Figure | Year | What it counts | Publisher |
|---|---|---|---|
| $37.3 billion | 2024 | Total U.S. direct mail ad spend: postage, print, data, creative | Winterberry Group |
| $15.7 billion | FY2025 | USPS revenue from the Marketing Mail class only | U.S. Postal Service |
| $11.2 billion | 2025 | Revenue of direct mail advertising firms, NAICS 54186 | IBISWorld, Jan. 2026 |
The Winterberry Group figure counts everything a brand spends to put a piece in a mailbox, with postage at roughly half. IBISWorld counts only the agencies that design and send mail for clients, and it shows that slice shrinking 4.3% in 2025. USPS counts one mail class, so marketing sent First-Class sits outside its number.

Direction differs too. Winterberry measured 2024 spend up 2.6%, and its January 2026 outlook, reported by MediaPost, puts 2025 down about 3%. USPS Marketing Mail revenue rose 2.3% in fiscal 2025 on higher prices, since volume fell 1.3%.
ROI is the third trap. The ANA reports ROI across digital channels and mail as a percentage return; JICMAIL reports pounds back per pound spent. A 161% ANA return and an £11.50 JICMAIL return measure different things on different samples, and a page that sets them side by side as one direct mail ROI is comparing two rulers. Where a figure on a vendor blog carries no edition and no publisher, treat it as a red flag, whatever it claims about direct mail performance.
How American consumers read advertising mail
Consumers read direct mail fast, and that speed is a large part of direct mail effectiveness. In Lob's 2025 State of Direct Mail Consumer Insights Report, an online survey of 2,000 U.S. adults run with PureSpectrum in April and May 2025, 84% said they read direct mail immediately or the same day, up from 70% a year earlier. Lob sells direct mail automation software, so its survey sits on the side of the channel it measures.
The same survey found 86% of American consumers like receiving direct mail, 49% see brands that send mail as more credible, and 53% say direct mail feels more special, valuable or exclusive. Physical mail has a failure mode too: 72% throw out mail that feels irrelevant, so consumers read direct mail selectively and bin the rest within a day.
The UK's Joint Industry Committee for Mail tracks behavior. JICMAIL's panel of 1,100 households records every mail item, and its homepage figure is that 96% of direct mail prompts a physical interaction. Canada Post's 2021 Spring Omnibus Report put the share of Canadians who read the direct mail they receive at 88%. Its Q2 2026 metrics by mail type:
| Mail type (JICMAIL, Q2 2026) | Interactions per item | Item reach (people) | Lifespan (days) | Attention (seconds) |
|---|---|---|---|---|
| Direct Mail | 4.4 | 1.14 | 7.4 | 151 |
| Door Drops | 3.1 | 1.07 | 6.0 | 70 |
| Business Mail | 4.9 | 1.16 | 8.9 | 197 |
| Partially Addressed | 4.0 | 1.06 | 6.9 | 100 |
Households keep a direct mail item for 7.4 days, and it gets 151 seconds of attention across 4.4 interactions. That is the closest thing to a direct mail open rate with a method behind it, since direct mail recipients on the panel log each touch in a diary.
Email marketing measures opens by pixel, and our email open-rate benchmarks run from 30.7% to 43.46%, against 96% of direct mail handled. Attention is what makes direct mail work in this data: a door drop gets 70 seconds, less than half a direct mail item.
Brand recall and cognitive effort: the Canada Post study
Canada Post commissioned neuromarketing firm True Impact to compare physical and digital ads on 270 participants. The Canada Post release of August 27, 2015 reports that physical media took 21% less cognitive effort to understand, and that direct mail produced 70% higher brand recall than digital ads.
Motivation scored 20% higher for direct mail, and 30% higher for mail with sensory features. The study is eleven years old with 270 participants, so its percentages aren't set in stone. Lob's 2025 data points the same way for the physical communication channel: 56% said they remember brands better from mail than from digital ads alone.
Direct mail and younger audiences
Younger consumers engage with direct mail marketing at higher rates than older ones. Lob's 2025 survey found 85% of Gen Z and Millennials engage with direct mail, and 80% of Gen Z share mail with others, against 63% of Boomers. QR codes split by age: 60% of Millennials are comfortable scanning one on mail, against 26% of Boomers.
JICMAIL's panel shows the same direction with behavior data. Frequency of interaction among 25 to 34 year olds grew 8% across 2025, per the Q4 2025 release published by the DMA. In Lob's survey 58% of consumers said they feel overwhelmed by digital brand messages, and a paper envelope flies under the radar of that digital noise.
Integrating direct mail with digital campaigns
Combining direct mail with digital channels is now standard direct mail marketing practice for most marketers, and marketers expect the mail piece to report back like any other marketing campaign. Winterberry's Delivering Performance: Direct Mail in the United States 2023, published September 2023 with USPS as sponsor, found 39.0% of marketers integrating direct mail with other channels and seeing benefits, plus 20.2% integrating without benefits yet.
Tracking is what makes integrating direct mail measurable, and it puts mail and digital teams on the same page. The ANA's 2023 report found 82% of direct mail users track response online with QR codes, personalized URLs or similar tools, up from 67% in the previous study. A personalized URL turns a mail piece into a click you can attribute.
QR codes pay off in the panel data. JICMAIL's Q2 2026 release found a direct mail item with a QR code was 60% more likely than average to prompt website visits, and 9.5% of all mail drove a website visit that quarter. That kills two birds with one stone: the mail piece gets read, and the click gets logged.
Direct mail automation closes the loop from the other side. Direct mail marketing platforms trigger a physical mail piece from behavioral data such as an abandoned cart or a lapsed subscription, so targeted campaigns go out on the same rules as triggered email. More data on each customer means the mail piece goes to the people most likely to answer, which is how teams increase response rates without raising volume.
Winterberry's 2023 survey found 53% of marketers shifting to more personalized content, and in Lob's survey 67% of consumers said a personalized detail led them to act.
Direct mail spend, campaign cost and postage
Winterberry's 2023 report tracks U.S. direct mail spend at $43.18 billion in 2019, $38.79 billion in 2020, $41.06 billion in 2021 and $41.70 billion in 2022. Direct mail industry spend then fell by double digits in 2023 before the 2.6% rise to $37.3 billion in 2024. Eight in ten U.S. brands told Winterberry they plan to increase direct mail marketing spend in 2025, so marketers plan for growth even as the mail stream shrinks.
Postage takes the lion's share of a direct mail campaign cost. Winterberry measured postage at 45.7% of spend in 2019 and 48.4% in 2023, the rest going to print, data, list rental and creative. Every USPS rate case moves that share up, and a mailer who wants campaign performance to hold has to cut waste from the list before cutting the print spec.
List data carries its own rate card: our Data Axle pricing report covers Salesgenie's $99 to $299 monthly packages and the refund terms on bad records.
For small businesses, the entry price is public. USPS lists Every Door Direct Mail Retail flats at $0.26 a piece and the bulk-entry version at as low as $0.259, with a 200-piece minimum.
Service is the other cost. The PRC's fiscal 2025 determination found 20 of 27 market dominant products and categories missed their service performance targets, and 4 of 28 products didn't cover their costs. Mail that arrives late undercuts a dated offer, and the devil's in the details of each mailing's in-home window. The same review counted 406 fewer USPS physical locations than a year earlier.
Formats: postcards, letter sized envelopes and dimensional mailers
Postcards are par for the course with existing customers. In the ANA's 2023 data, 76% of house-list mailers used postcards, up from 59% in the previous study, while 67% of prospect campaigns used letter sized envelopes. The ANA tracks catalogs, dimensional mailers, oversized envelopes and magalogs as the remaining formats.
Bigger pieces push the envelope on response. JICMAIL's 2026 Response Rate Tracker update found A4 mailers achieve response rates around 2.7 times those of postcards, and campaigns combining brand and response objectives reach up to five times the response of the rest. Oversized postcards and envelopes cost more postage, so the lift has to cover it.
Purpose shapes format too. The ANA found 35% of campaigns mail to make a direct sale, almost double the next purpose, and 56% use mixed house and prospect lists.
Direct mail response rates by industry
Retail posts the clearest sector response rate data. JICMAIL's tracker found warm retail direct mail response rates up 26% year on year in 2025 and cold retail up 21%, with warm mail delivering £12 or more ROI for retailers. Supermarkets and political parties lifted the Q2 2026 panel figures, with political direct mail volumes rising six-fold year on year.
For sector benchmarks with a method, the JICMAIL tracker publishes its campaign count, close to 5,000 in 2025. The ANA's 2023 sample is smaller: 25 to 42 direct mail users answered each direct mail question, so its response rate data is reported by list type, and 73% of them track response rate, the metric they rely on most.
Frequently asked questions
Is direct mail marketing still effective in 2026?
Yes, on existing customers. House-list direct mail returned 161% ROI in the ANA's 2023 data, top of every medium measured, and 84% of U.S. consumers in Lob's 2025 survey read mail the same day.
What is a good ROI for direct mail?
Benchmark against the ANA: 161% for house lists, 34% for prospect lists. A prospect campaign beating 34% is ahead of the measured average; a house campaign under 44% returns less than the ANA's average for email marketing to house lists.
What is the success rate of direct mail?
The last average direct mail response figure the ANA published was 9%, in the 2018 report, and the highest response rates come from house lists. JICMAIL measures success as interaction: 96% of direct mail is handled, and 6% of mail prompted a purchase in Q2 2026.
What industries use direct mail the most?
Retail is the sector JICMAIL's tracker reports by name for 2025, and supermarkets & political parties drove its Q2 2026 panel growth. In the ANA's sample, 35% of campaigns aim at a direct sale.
What are common mistakes when using EDDM?
Three USPS rules trip up first-time EDDM Retail mailings:
- Sending more than 5,000 pieces per ZIP Code per day, the Retail cap.
- Bundling outside the required 50 to 100 pieces, or above 6 inches high.
- Printing indicia smaller than 0.5 by 0.5 inches or in the wrong position.
Is direct mail making a comeback?
Spend rose 2.6% in 2024 per Winterberry, and USPS Marketing Mail revenue rose 2.3% in fiscal 2025, but volume fell 1.3%. Fewer pieces at higher prices is a repricing, and the 2019 volume of 75.7 billion is a long shot.
Bottom line
Direct mail delivers when it goes to people who already know the sender, and the industry's own direct mail statistics say so. The ANA's 161% house-list ROI against 34% for cold names is the single most useful number on this page, and it says to spend list budget on existing customers first & test prospects second.
The channel is shrinking in pieces and growing in price per piece. USPS carried 45% fewer marketing pieces in fiscal 2025 than in 2007, and postage now takes nearly half of every dollar spent. Planning a mailing means pricing postage first, then checking that the list earns it, since direct mail delivers its 161% only on house lists.
For the digital side of the mix, compare these numbers with our email marketing benchmarks, SMS marketing statistics and advertising industry statistics. B2B teams weighing mail for account-based campaigns will find buyer data in our B2B marketing statistics.
Where each direct mail figure comes from, and the response rate nobody has measured since 2018
Postal data: about.usps.com (fiscal 2025 results, 14 November 2025; fiscal 2020 results, 13 November 2020; 2008 annual report; Household Mail Survey page), usps.com (Every Door Direct Mail page), prc.gov (fiscal 2025 Annual Compliance Determination, 27 March 2026) and brookings.edu (Household Mail Survey analysis, 9 July 2026).
Response and ROI: ana.net (ANA Response Rate Report 2023, published 22 February 2024; ANA/DMA Response Rate Report, 15 November 2018), user-23310503727.cld.bz (public flipbook copy of the 2023 report), jicmail.org.uk (Q1 and Q2 2026 releases and the Response Rate Tracker), dma.org.uk (JICMAIL Q4 2025 release) and canadapost.ca and canadapost-postescanada.ca (datagrams of 2022 and earlier; True Impact neuromarketing release, 27 August 2015).
Spend and consumer surveys: winterberrygroup.com (direct mail spend release, 11 December 2024; Delivering Performance: Direct Mail in the United States 2023, September 2023), mediapost.com (Winterberry outlook, January 2026), ibisworld.com (Direct Mail Advertising in the US, January 2026) and lob.com (2025 State of Direct Mail Consumer Insights Report).
Every figure was checked against its source on 14 October 2026. No U.S. body has published an average direct mail response rate since the ANA's 2018 report, and the Household Mail Survey PDF would not load for fetching, so the household figures come through the Brookings analysis.