Email marketing statistics 2026: open-rate benchmarks run from 30.7% to 43.46%
 By Jan Suski. I go deep on every review, checking every number against its source and digging up details other coverage misses, a habit from six years of SEO and link building for tech companies. Bylines at Surfer, Brand24, and Senuto. How the scoring works.
The numbers Email marketing benchmarks, ROI and deliverability, checked 4 October 2026
Open rate is the least comparable of all email marketing stats, because Apple's proxy opens sit inside every platform's average.
Automated emails earn 16 to 18 times the value of a campaign send in Omnisend and Klaviyo data.
Inbox placement rose 3.7 points in Validity's 2025 data, the first full year of Gmail and Yahoo bulk sender enforcement.
Email marketing platforms that published 2025 and 2026 benchmarks report average open rates between 30.7% and 43.46%. The spread is 12.76 points. Apple Mail holds the lion's share of tracked opens, 62.26% in July 2026, and its privacy feature loads tracking pixels before anyone reads the message.
Clicks and revenue tell a steadier story. Campaign click through rates sit between 1.69% and 2.62% at Klaviyo and Mailchimp, and automated emails produce 30% to 41% of email marketing revenue from 2% to 5.3% of sends.
This email marketing statistics report is for email marketers and marketing teams who compare their own results with published benchmarks. It covers open and click industry benchmarks by platform, email ROI surveys, automation revenue, deliverability, opens on mobile devices and where the most-quoted stats come from. Each figure carries its publisher and edition, because targets and budgets get set from these numbers.
Email marketing benchmarks: average open rates range from 21.5% to 43.46%
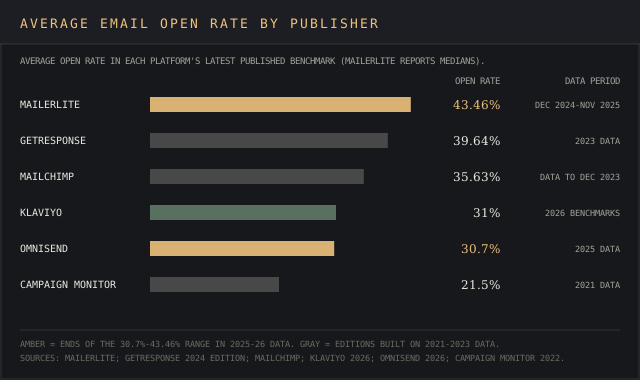
Six email marketing software vendors publish open-rate averages, and the newest editions disagree by more than 12 points. MailerLite reports a 43.46% median across 3.6 million email campaigns sent from December 2024 to November 2025. Omnisend reports 30.7% across 150,000 brands for calendar 2025.
| Publisher | Edition and data period | Sample | Average open rate | Average click rate |
|---|---|---|---|---|
| MailerLite | Dec 2024 to Nov 2025 (medians) | 3.6 million campaigns, 181,000 accounts | 43.46% | 2.09% |
| GetResponse | 2024 edition, 2023 data | 4.4 billion messages | 39.64% | 3.25% |
| Mailchimp | Data updated Dec 2023 | Campaigns sent to 1,000+ subscribers | 35.63% | 2.62% |
| Klaviyo | 2026 benchmarks, published Jan 23, 2026 | 183,000+ customers | 31% (campaigns) | 1.69% (campaigns) |
| Omnisend | 2026 report, 2025 data | 150,000 brands, 27 billion emails | 30.7% | No campaign figure published |
| Campaign Monitor | 2022 edition, 2021 data | 100 billion+ emails | 21.5% | 2.3% |
Campaign Monitor's 21.5%, the oldest figure in the set, already includes the +3.5% year-over-year jump Campaign Monitor reported and tied to iOS 15, released on September 20, 2021.
Click through rates in email marketing cluster tighter. Klaviyo's campaign average is 1.69%, Mailchimp's is 2.62% and MailerLite's median is 2.09%. Mailchimp puts the optimal average click through rate for email marketing campaigns at 2.66%, with a 1% to 5% range by industry.
Why the published email marketing stats diverge
Three documented mechanics separate one set of email marketing benchmarks from the next. The house that publishes each number documents the mechanic itself.
- Apple Mail Privacy Protection. Apple announced the feature on June 7, 2021, saying it stops senders from using invisible pixels and hides when a user opens an email. Litmus estimates the feature now touches roughly 55% to 60% of all email opens.
- Platform customer mix. Klaviyo and Omnisend sell marketing automation to ecommerce brands. Mailchimp's base runs from one-person startups and small businesses to Fortune 500 companies, and MailerLite's top open rates come from religion (55.71%) and hobby senders (53.25%).
- Averages and medians. MailerLite reports medians across 181,000 accounts. Mailchimp counts only email campaigns sent to at least 1,000 email subscribers, and GetResponse counts senders with 500 or more contacts.
Three platforms call a spade a spade and print the MPP caveat on their email marketing benchmarks pages. MailerLite writes that MPP "automatically marks emails sent to Apple Mail clients as opened." GetResponse attributes part of its reported engagement growth to Apple's auto-opens, and Mailchimp tells readers to factor MPP into any open rate comparison.
Gmail's own guidance comes straight from the horse's mouth. Google's email sender guidelines state that "Google doesn't track open rates" and can't verify open rates reported by third parties. A practitioner on Hacker News described the cost for list hygiene in June 2021, the week Apple announced the feature:
"Open rates are an important metric for ESPs to track bad actors on their platforms. If this implementation is a 100% preload those metrics then have no value."
_wp3r, Hacker News, June 10, 2021
Email marketing teams score campaign performance on outcomes. In the DMA's 2026 tracker, 45% of UK email marketers measure email objectives through engagement and 44% through revenue, and more than 83% use email across every stage of the customer journey. HubSpot's State of Marketing 2026, its annual marketing strategy survey, found 8.4% of marketers call open and click through rates the most important email marketing metrics.
Email marketing ROI statistics: almost £41 per £1 in the DMA's 2026 tracker
Marketers report email ROI in surveys, and platforms report it for their own customers. The DMA's Marketer Email Tracker 2026, based on 250 UK marketers, puts ROI at almost £41 per £1, up from just over £38 the year before. The reported value of email marketing rose from £36.63 to £40.53.
| Publisher | Edition | Return reported per unit spent | Method |
|---|---|---|---|
| DMA (UK) | Marketer Email Tracker 2026 | Almost £41 per £1 | Survey of 250 marketers |
| Litmus | 2025 State of Email survey | 35% get $10 to $36, 30% get $36 to $50, 5% get more than $50 per $1 | Survey of nearly 500 marketing professionals |
| Litmus | State of Email 2026 | Top 8% of programs report 45:1 or higher | Survey of 500 marketing professionals in the US, UK, Australia and New Zealand |
| Omnisend | Blog post, April 3, 2026 | $79 per $1 in 2025 | Omnisend's paid-plan merchants |
| Campaign Monitor | Infographic, updated July 2019 | $44 per $1 | Campaign Monitor statistic, no sample stated |
In Litmus' survey, $36 per $1 is a bracket edge, the same figure common in email marketing stats roundups. In the 2025 edition, about one third of marketing leaders (35%) placed their email ROI between $10 and $36, and 21% didn't measure ROI at all, down from 36% in 2023.
The jury's still out on the most effective marketing channel by ROI, because each survey asks a different question. HubSpot's 2026 respondents rank email fifth, with 22% listing it among their top ROI channels. Email ties with organic social media marketing as the second most used marketing channel at 40%, and about 75% of marketers plan to hold or raise email marketing investment in 2026.
The advertising industry statistics and search engine marketing statistics reports track paid media and organic search in the same marketing plan, and the social media statistics report covers the channel email ties with. Litmus links high ROI to AI adoption. Advanced AI adopters were 75% more likely to report ROIs above 45:1.
Email automation: 2% of sends drive 30% of email revenue
Triggered campaigns, the welcome flows sent to potential customers after signup and the abandoned cart and birthday flows set off by consumer behavior and past interactions, carry the clearest revenue data in email marketing. Omnisend's 2026 report found automations made up 2% of all sends and produced 30% of email-driven revenue in 2025. Each automated email earned $2.87 per send against $0.18 for scheduled email campaigns, a 16x difference.
| Metric | Campaigns | Automations or flows | Source |
|---|---|---|---|
| Share of sends | 94.7% | 5.3% | Klaviyo 2026 |
| Share of email marketing revenue | About 59% | Nearly 41% | Klaviyo 2026 |
| Average click rate | 1.69% | 5.58% | Klaviyo 2026 |
| Average open rate | 31% | 32.2% | Klaviyo 2026 |
| Revenue per send | $0.18 | $2.87 | Omnisend 2026 |
| Share of sends / revenue | 98% / 70% | 2% / 30% | Omnisend 2026 |
Klaviyo's 2026 benchmarks, drawn from 183,000 brands, are on the same page. Flows generate nearly 41% of email marketing revenue from 5.3% of sends, with revenue per recipient nearly 18 times higher than campaigns and placed order rates 13 times higher. Omnisend measured 19x higher conversion rates for automated messages.
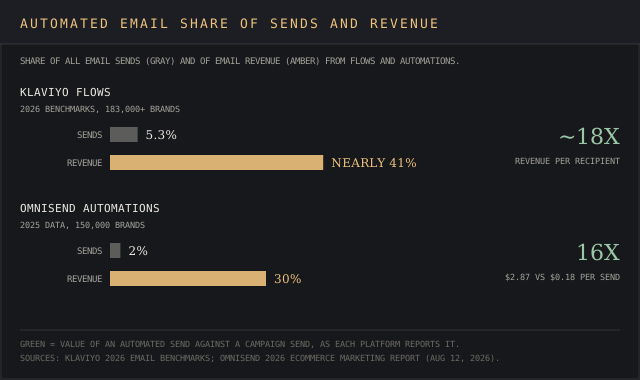
Two flow types carry most of the email automation volume. Abandoned cart and welcome messages drove 76% of all automation-generated orders on Omnisend in 2025. Back-in-stock emails posted the highest conversion rate of any automation at 6.46%, and consumers spend $744.37 on the average order from a birthday message, more than four times the overall average.
Omnisend's figures come from ecommerce stores, so the retail industry statistics and the ecommerce analytics tools ranking give the surrounding context. Marketing automation for B2B lead generation, such as cold outreach sequences in lemlist, sits outside both datasets.
Click through rates by industry: 1.19% to 4.58% on Mailchimp
Industry mix moves email marketing performance by 3.39 points of click rate in Mailchimp's data. Government senders post the highest average click rate at 4.58% and the highest average open rate at 40.55%. Vitamin supplement brands sit at the bottom on both, with 1.19% clicks and 27.34% opens.
| Industry (Mailchimp) | Average open rate | Average click rate | Unsubscribe rate |
|---|---|---|---|
| Government | 40.55% | 4.58% | Not listed |
| Non-profits | 40.04% | 3.27% | 0.18% |
| Education and training | 35.64% | 3.02% | 0.18% |
| Business and finance | 31.35% | 2.78% | 0.15% |
| Ecommerce | 29.81% | 1.74% | 0.19% |
| Vitamin supplements | 27.34% | 1.19% | Not listed |
| All users | 35.63% | 2.62% | 0.22% |
Mailchimp suggests aiming for an open rate around 34.23%, slightly below the 35.63% industry average across all its users. Mailchimp's customer range includes small businesses, which the small business statistics report covers.
Conversion rates vary by vertical too. Klaviyo's placed order rate for campaigns runs from 0.97% in clothing to 1.34% in home and garden, and flows go the extra mile, lifting those two to 1.62% and 2.17%.
Email deliverability: inbox placement rose to 87.2% in 2025
Validity's seed-list tests of email marketing campaigns put global inbox placement at 87.2% in 2025, with 6.6% of messages landing in spam and 6.1% going missing. The previous report measured 83.5% inbox placement for 2024, with 9.8% missing.
| Mailbox provider | Inbox rate 2024 | Inbox rate 2025 | Spam rate 2025 |
|---|---|---|---|
| Gmail | 87.2% | 89.8% | 6.4% |
| Yahoo | 86.0% | 87.3% | 6.4% |
| Apple | 76.3% | 82.0% | 10.8% |
| Microsoft | 75.6% | 77.4% | 15.1% |
| All providers | 83.5% | 87.2% | 6.6% |
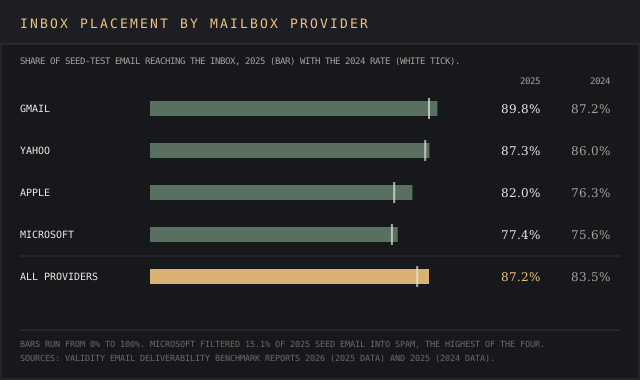
The rise follows the sender rules Gmail and Yahoo announced in late 2023. Google's October 3, 2023 announcement defined a bulk sender as anyone sending more than 5,000 messages a day to Gmail addresses, starting February 2024. Yahoo's sender requirements took effect the same month, and bulk senders had to get their act together by that deadline. The combined rules for marketing emails and promotional emails are:
- SPF, DKIM and a DMARC record for bulk senders, with DMARC at p=none or stricter for Yahoo.
- One-click unsubscribe for marketing emails, with requests processed within two days.
- A user-reported spam rate below 0.3%, with Google asking senders to stay under 0.10%.
- Promotions kept out of transactional emails such as sales receipts, per Google's guidelines.
Gmail says it stops more than 99.9% of spam, phishing and malware and blocks nearly 15 billion unwanted emails every day. That filter sits in front of every email marketing send to Gmail, where 27.03% of tracked opens happen.
Mobile email marketing statistics: Apple Mail holds 62.26% of opens
Litmus tracked more than 1 billion opens in July 2026 and attributed 62.26% to Apple, counting Apple Mail on mobile devices (iPhone and iPad) and Mac plus MPP opens. Gmail followed at 27.03%, Outlook at 5.83% and Yahoo Mail at 2.59%. Apple and Gmail together hold nearly 90% of the market.
Litmus states that "mobile devices continue to be the primary reading environment for the majority of subscribers."
The Apple share is the elephant in the room behind open-rate inflation in email marketing statistics. More than half of all opens now pass through Apple's privacy proxy, so a list with many iPhone readers shows a higher open rate with no change in email engagement. Mailchimp ties its limit on subject lines to readers on mobile devices, a basic form of mobile optimization.
Personalization, subject lines and AI: 85% of B2B marketers who personalize use email
Email marketing campaigns are the top channel for personalized content in B2B. The Content Marketing Institute's 2026 research, a survey of 1,015 B2B marketers fielded in mid-2025, found 89% of organizations personalize content and 85% of those apply it to email campaigns. In the same study, 54% of thought-leadership creators publish in email newsletters, behind LinkedIn at 76%.
HubSpot's State of Generative AI 2026 found 53% of marketers use basic personalization such as a name in email copy, and over 80% use AI for content creation, including email copy. Its State of Marketing 2026 found 26% of marketers rate email among the most effective channels for segmentation and personalized experiences.
Mailchimp's guidance cuts to the chase with testable limits for email subject lines:
- Up to 9 words and 60 characters.
- Up to 3 punctuation marks per subject line.
- One emoji at most.
Personalized subject lines in marketing emails use merge tags to put the name or location of email recipients in the subject line itself, and Mailchimp recommends them for most senders. CMI found 36% of B2B marketers use AI email marketing tools for campaign optimization and personalized email content. The AI statistics report covers adoption across marketing teams.
In Litmus' State of Email 2026, 78% of email marketing teams take three days or less to produce an email, against 62% who took two weeks or more in 2024.
Email users worldwide: 4.4 billion, rising to 4.9 billion by 2028
The Radicati Group counted over 4.4 billion email users worldwide in December 2024 and forecast more than 4.9 billion by year-end 2028. Its earlier Email Statistics Report, 2023-2027, put daily traffic at 347.3 billion business and consumer emails in 2023, rising past 408 billion by the end of 2027.
Radicati counts people, and one person often holds several email accounts. An email marketing strategy reaches that base through a handful of providers, and Gmail, Apple and Yahoo call the shots on which email marketing campaigns arrive. Contact records for those campaigns often sit in a CRM that tracks customer relationships, such as Capsule CRM or folk.
Where the most-quoted email marketing stats come from
Several figures repeated in email marketing statistics roundups trace back to single studies published between 2014 and 2019. The table lists each origin and date so a reader can judge the age of a number before building an email marketing strategy on it.
| Statistic as quoted | Original publisher | Date |
|---|---|---|
| Personalized emails deliver six times higher transaction rates | Experian Marketing Services 2013 email study | Feb 5, 2014 (Q4 2013 data) |
| Personalized subject lines are 26% more likely to be opened | Campaign Monitor infographic | Nov 2017, updated July 2019 |
| 760% increase in revenue from segmented campaigns | Campaign Monitor infographic | Nov 2017, updated July 2019 |
| 73% of consumers prefer email as a marketing channel | DMA Customer Engagement report | 2018 |
| Automated emails earn many times more revenue per recipient | Klaviyo benchmarks (current figure nearly 18x) | 2026 edition |
Experian's 2014 release also reported 29% higher unique open rates and 41% higher unique click rates for personalized promotional emails. The DMA's 2018 report put post, the UK term for direct mail, second at 41%, with social media, text messages and phone calls further back.
Campaign Monitor appears twice because its 2017 infographic seeded many personalization email marketing stats still in rotation. For newer customer insights on personalized email, the CMI and HubSpot surveys above are 2025 and 2026 editions.
Which platform, survey and mailbox provider published each email figure
Platform benchmarks, checked 4 October 2026: klaviyo.com (2026 benchmarks, published 23 January 2026), omnisend.com (2026 Ecommerce Marketing Report, 12 August 2026, and an email ROI post of 3 April 2026), mailerlite.com (December 2024 to November 2025 data), mailchimp.com (data updated December 2023), getresponse.com (2024 edition, 2023 data) and campaignmonitor.com (2022 benchmark edition and an infographic updated July 2019).
Surveys: dma.org.uk (Marketer Email Tracker 2026, July 2026, and a 2018 release), litmus.com (State of Email 2026, July 2026, the 2025 State of Email survey and the July 2026 email client market share), hubspot.com (State of Marketing 2026 and State of Generative AI 2026) and contentmarketinginstitute.com (B2B research, 8 October 2025).
User counts and older studies: radicati.com (Email Statistics Report, 2023-2027 executive summary), einpresswire.com (Radicati release, 9 December 2024) and experianplc.com (5 February 2014).
Deliverability and mailbox rules: validity.com (2025 and 2026 benchmark reports, March of each year), blog.google (3 October 2023), support.google.com (sender guidelines), senders.yahooinc.com, apple.com (7 June 2021) and news.ycombinator.com (10 June 2021).
Omnisend publishes no campaign click rate, Mailchimp's benchmark data stops at December 2023, Campaign Monitor's newest benchmark covers 2021, and its 2019 infographic states no sample. Google states that it doesn't track open rates, so no Gmail-side figure exists to check a platform's open-rate average against.
Frequently asked questions
Is email marketing still worth it in 2026?
The 2026 email marketing stats from HubSpot, the DMA and Litmus say yes. About 75% plan to hold or raise email marketing investment (HubSpot), the DMA's email marketers report almost £41 back per £1, and the top 8% of programs in Litmus' 2026 report claim 45:1 or higher. All three ROI figures are self-reported, so a marketing strategy that cites them should name the survey.
What is the 80/20 rule in email marketing?
Platform data shows a small share of sends producing the lion's share of revenue. Automated emails were 2% of Omnisend sends and 30% of revenue in 2025, and Klaviyo flows were 5.3% of sends and nearly 41% of revenue. By revenue per send, marketing automation flows are the most effective marketing tools in both datasets.
What are good metrics for email marketing?
Email marketing metrics that hold up under Apple's privacy proxy are click rate, conversion rates and revenue per recipient. Klaviyo's 2026 averages are campaign click through rates of 1.69% and flow click through rates of 5.58%, with the top 10% of campaigns at 3.38%. Google's sender guidelines add a spam-rate ceiling of 0.3% and a target under 0.10%.
What is the success rate of email marketing?
Measured by orders, Klaviyo's placed order rates for email campaigns run from 0.97% to 1.34% across clothing, automotive, electronics and home and garden. Omnisend's click-to-conversion rate rose from 5.9% in 2024 to 9% in 2025, a measure of campaign success on the landing pages after the click.
Is email marketing declining?
Email users rise from 4.4 billion to a forecast 4.9 billion by 2028 (Radicati), Omnisend customers sent 27 billion emails in 2025, and 40% of marketers in HubSpot's 2026 survey use email marketing, tied for the second most used channel.
What are the current trends in the email marketing industry?
Four email marketing trends shape email strategies in the 2026 reports:
- Measurement moving to clicks and revenue, with 45% of DMA respondents measuring engagement and 44% revenue.
- Stricter sender authentication at Gmail and Yahoo, with inbox placement up to 87.2%.
- More automation revenue, with flows at nearly 41% of Klaviyo email revenue.
- AI in production, with 78% of teams in Litmus' survey producing an email in three days or less.
Bottom line
Open-rate benchmarks range from 30.7% to 43.46% depending on the platform, and the three platforms that explain the gap name Apple's Mail Privacy Protection, which touches 55% to 60% of opens.
Click rates between 1.69% and 2.62%, Validity's 87.2% inbox placement and the 2% of sends that produce 30% of Omnisend's email revenue are the email marketing statistics to compare across sources. Every email marketing ROI figure, from the DMA's £41 to Omnisend's $79, comes from a marketer survey or a platform's own customers.