Ecommerce analytics tools: 12 platforms ranked for 2026
 By Jan Suski. I go deep on every review, checking every number against its source and digging up details other coverage misses, a habit from six years of SEO and link building for tech companies. Bylines at Surfer, Brand24, and Senuto. How the scoring works.
· Prefer this source on Google
Quick comparison of ecommerce analytics tools
Pricing below is what each vendor publishes. Where a plan is quoted, the column names the basis. Nobody has to guess at a figure.
| # | Tool | Strongest at | Pricing | Best fit |
|---|---|---|---|---|
| 1 | Google Analytics 4 | Traffic, acquisition and funnel basics | Free; GA360 quoted | Any store needing a baseline |
| 2 | Contentsquare | Session replay and experience analytics | Quoted, by session volume | Teams fixing checkout friction |
| 3 | Adobe Analytics | Enterprise segmentation and predictive models | From around $100,000 a year | Enterprise retail with an analyst team |
| 4 | Mixpanel | Event-level product and funnel analysis | Free to 20M events a month | Teams measuring actions over pageviews |
| 5 | Amplitude | Cohort and retention analysis | Free plan; Growth quoted | Subscription and repeat-purchase models |
| 6 | Triple Whale | Blended marketing attribution for Shopify | Published tiers by order volume | Shopify stores buying paid media |
| 7 | Hotjar | Heatmaps and qualitative behavior | Free plan; paid tiers by session | Small teams diagnosing one page |
| 8 | Glew | Multichannel profitability reporting | Free to 20 metrics | Merchants selling across channels |
| 9 | Heap | Autocapture without tagging | Quoted, by session volume | Teams without engineering support |
| 10 | Shopify Analytics | Native store reporting | Included in all Shopify plans | Shopify merchants starting out |
| 11 | WooCommerce Analytics | Native WordPress store reporting | Free | WooCommerce stores |
| 12 | Littledata | Server-side tracking accuracy | Published tiers by order volume | Stores whose numbers do not reconcile |
Ecommerce analytics tools turn raw store traffic into the three answers an online store needs: which visitors buy, which drop out, and which marketing spend brought the ones who converted. Every platform below does some version of that, and they disagree sharply on how.
Google Analytics runs on around 31 million websites and costs nothing. Adobe Analytics typically starts at $100,000 a year. Both are ecommerce analytics software, and the gap between them is what this ranking exists to explain.
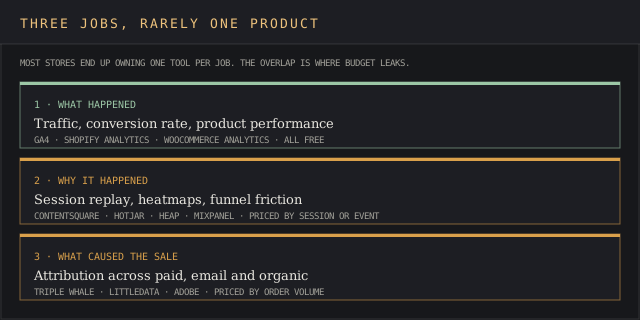
E-commerce analytics tools split into three jobs that rarely live in one product: reporting what happened, explaining why, and attributing the sale to a channel. Teams making data driven decisions usually end up owning one tool for each.
Twelve ecommerce analytics platforms are ranked here on data accuracy, how much engineering sits between install and a usable dashboard, and how honestly each one handles attribution after the iOS privacy changes broke last-click reporting.
What ecommerce analytics tools measure
Every platform here collects some mix of three data types. Traffic and website traffic data covers who arrived and from where. User behavior data covers what they did once they landed. Order data covers what they bought.
The key metrics fall out of combining them. Conversion rate needs sessions and orders. Customer lifetime value needs orders joined to a customer identity across months. Marketing performance needs orders joined to acquisition source, which is the join that breaks most often.
Analytics tools help by automating that join and reporting the result. The actionable insights come from the analyst reading it, and no platform has closed that gap yet.
Turning reports into decisions
Competitor price monitoring sits outside all of this and answers a different question. A dashboard showing conversion rate by device is a report. A dashboard showing that mobile checkout converts at half the desktop rate on one payment method is a decision. The difference is specificity, and it comes from how the team analyzes data.
Teams that understand customer behavior at that level share a habit: they ask a question first and open the tool second. Opening the tool first produces valuable insights nobody acts on and custom reports nobody reads twice.
How to evaluate ecommerce analytics software
Data accuracy before features
An ecommerce analytics platform that undercounts revenue by 15% produces confident dashboards nobody should trust. Compare the tool's revenue figure against your payment processor for one full month before you compare feature lists. Client-side tracking loses events to ad blockers and browser restrictions; server-side tracking recovers most of them and costs more to implement.
Attribution model, stated plainly
Ask which attribution model runs by default and what happens to a conversion with six touchpoints. Last-click attribution is the cheapest to compute and the most likely to misallocate a marketing budget, because it hands full credit to whichever channel appeared last.
Time from install to first insight
Some tools need a developer to tag every event. Others autocapture everything and let you define events later. The second approach costs more per session and saves weeks, which is the right trade for a team without engineering time.
Integration capabilities across the stack
Ecommerce analytics tools connect to ecommerce platforms, CRM systems, email tools and ad accounts. Check the direction of each integration: reading from Shopify is common, and writing a segment back into an email platform is rarer. Integration capabilities decide how much manual reporting survives after go-live, and if you can unify data from every marketing channel in one place.
Data ownership matters here too. Some platforms let you export raw event data to your own warehouse; others keep it and sell access back. If you plan to integrate Google Analytics data with warehouse tables later, confirm the export path before signing.
Cost as data volume grows
Usage-based pricing on events or sessions means a successful campaign raises your analytics bill. Model the cost at three times current traffic before signing, since that is the scenario the tool is supposed to help create.
Reporting flexibility
Standard reports cover the first month. After that a team wants custom dashboards and custom reports built around its own categories and margins. Ask how much of that is self-service and how much needs a data team, since advanced features gated behind an enterprise plan change the real cost.
Top ecommerce analytics tools, ranked
Google Analytics 4
Best fit: any online store that needs a reliable traffic and conversion baseline at no cost.
GA4 is the default for a reason. It runs on around 31 million websites, tracks the standard ecommerce funnel from product view to purchase, and connects to Google Ads without an intermediary.
Key features
Full ecommerce event tracking across the purchase funnel. Exploration reports for custom funnel and path analysis. Audience building that pushes into Google Ads. BigQuery export on the free tier. Attribution reporting across Google and non-Google channels.
Pricing
Free. Google Analytics 360 is quoted for enterprises needing higher data limits and a service agreement.
Pros
Costs nothing and integrates with the ad platform most stores already spend on. BigQuery export gives raw data access rivals charge for. Universal enough that every agency knows it.
Cons
Event-based model confuses teams migrating from Universal Analytics. Data sampling appears on large queries. Client-side collection loses conversions to ad blockers.
Why it's ranked #1. Nothing else gives this much ecommerce reporting for free, and every other tool on this list is bought to fix a specific gap in it.
Contentsquare
Best fit: teams that know where customers drop out and cannot work out why.
Contentsquare runs on over 1.3 million websites and specializes in experience analytics: session replay, zone-level heatmaps and struggle detection that quantifies frustration on a specific page element.
Key features
Session replay tied to revenue impact. Zone-based heatmaps showing engagement per page element. Journey analysis across sessions and devices. Automated friction detection on checkout steps. Error and rage-click reporting.
Pricing
Quoted, scaled by monthly session volume.
Pros
Turns a drop-off percentage into a visible cause. Revenue attribution on individual page elements is unusual. Strong on mobile web behavior.
Cons
Priced for mid-market and above. Replay volume needs governance to stay useful. Overlaps with cheaper heatmap tools at the low end.
Why it's ranked #2. It answers the question GA4 raises and cannot resolve, which makes it the most common second purchase in this category.
Adobe Analytics
Best fit: enterprise retailers with an analyst team and data across many channels.
Adobe Analytics sits inside Adobe Experience Cloud and handles segmentation, cross-channel attribution and predictive modeling at a depth no free tool approaches.
Key features
Unlimited custom segmentation across any dimension. Attribution IQ with multiple models applied to the same data. Predictive analytics for churn and propensity. Customer journey analytics across web, app and offline. Real-time dashboards at enterprise data volumes.
Pricing
Typically starts around $100,000 a year, sold through Adobe Experience Cloud contracts.
Pros
Deepest segmentation available. Multiple attribution models applied retroactively to historical data. Handles data volumes that break other platforms.
Cons
Cost rules out most stores. Needs dedicated analysts to repay. Implementation runs to months.
Why it's ranked #3. Technically the most capable platform here, held below GA4 and Contentsquare because the buyer who can justify it is rare.
Mixpanel
Best fit: teams that measure what customers do. Page loads alone don't tell that story.
Mixpanel tracks user actions, which suits an ecommerce business analyzing add-to-cart behavior, repeat purchase patterns and multi-session buying journeys.
Key features
Event-based funnel analysis with step-level drop-off. Cohort analysis by first purchase date or behavior. Retention reporting across repeat purchases. User profiles combining events with customer attributes. Impact reporting on feature and layout changes.
Pricing
Free plan covering up to 20 million events a month, with paid tiers above that.
Pros
The free tier is genuinely generous for a mid-sized store. Funnel analysis is faster than GA4 explorations. Cohort tooling suits repeat-purchase models.
Cons
Needs an event tracking plan before it produces value. Weaker on acquisition and channel reporting. Event volume pricing punishes high-traffic stores.
Why it's ranked #4. Best event-level analysis at a price most stores can absorb, and it sits behind the top three because it needs planning work they don't.
Amplitude
Best fit: subscription and repeat-purchase businesses measuring retention over months.
Amplitude covers similar ground to Mixpanel with more emphasis on cohorts, retention curves and behavioral segmentation over long time horizons.
Key features
Retention and cohort analysis as the primary view. Behavioral segmentation built from event sequences. Experiment analysis tied to revenue outcomes. Predictive cohorts based on early behavior. Data governance tooling for event taxonomies.
Pricing
Free plan available, with Growth and Enterprise tiers quoted.
Pros
Strongest retention analysis in this list. Governance tooling keeps event naming clean at scale. Good experiment reporting.
Cons
Ecommerce templates are thinner than product-analytics ones. Quoted pricing above the free tier. Overkill for a store measuring one-off purchases.
Why it's ranked #5. It edges past Mixpanel on retention and falls behind on ecommerce-specific reporting, which decides the order for a store.
Triple Whale
Best fit: Shopify stores spending meaningfully on paid media across several channels.
Triple Whale exists to answer one question: which ad drove the sale. It blends platform-reported data with its own pixel to rebuild attribution the iOS changes broke.
Key features
First-party pixel recovering conversions ad platforms lose. Blended ROAS across Meta, Google, TikTok and email. Creative-level performance reporting. Post-purchase survey attribution. Real-time dashboards built for daily media decisions.
Pricing
Published tiers scaled by monthly order volume.
Pros
Purpose-built for the attribution problem most Shopify stores have. Creative-level reporting media buyers act on daily. Setup takes hours.
Cons
Shopify-centric. Blended attribution is a model, and the model needs checking against incrementality tests. Costs rise with order volume.
Why it's ranked #6. The clearest answer to attribution for its specific buyer, ranked here because that buyer is narrower than the five above.
Hotjar
Best fit: small teams diagnosing one problem page without an analytics budget.
Hotjar covers heatmaps, session recordings and on-site surveys, which is the qualitative layer that explains numbers other ecommerce analytics tools report.
Key features
Click, move and scroll heatmaps. Session recordings filtered by behavior. On-site surveys and feedback widgets. Funnel drop-off visualization. Conversion-focused reporting on individual pages.
Pricing
Free plan with limited sessions, and paid tiers priced by monthly session volume.
Pros
Fastest way to see why a page underperforms. Free tier is usable for a small store. Surveys collect the reasoning no behavioral data captures.
Cons
Session limits bite quickly on the lower tiers. No revenue attribution on recordings. Contentsquare does the same work with more rigour at higher cost.
Why it's ranked #7. Excellent value for its job, and its job is narrower than everything ranked above it.
Glew
Best fit: merchants selling across several channels who need profitability per product.
Glew unifies data from ecommerce platforms, ad accounts and email tools into multichannel reporting, with a focus on margin.
Key features
Profitability reporting per product, channel and customer. Customer lifetime value segmentation. Inventory and merchandising reports. Multichannel data unification across marketplaces. Automated report delivery.
Pricing
Free plan covering up to 20 metrics, with paid tiers above it.
Pros
Margin-level reporting most analytics tools skip. Genuinely multichannel where rivals assume one store. Free tier covers a small merchant's core metrics.
Cons
Reporting depth trails dedicated BI. Interface feels dated against newer rivals. Data refresh lags real-time tools.
Why it's ranked #8. The best profitability view in this list, held down by weaker behavioral analysis than the tools above.
Heap
Best fit: teams that want complete event data without asking a developer to tag it.
Heap autocaptures every interaction on the site, so an analyst can define an event retroactively and get historical data for it immediately.
Key features
Autocapture of all clicks, form fills and pageviews. Retroactive event definition against historical data. Funnel and path analysis without prior tagging. Session replay linked to event data. Data governance for defined events.
Pricing
Quoted, scaled by monthly session volume.
Pros
Removes the tracking plan bottleneck entirely. Retroactive analysis answers questions nobody thought to tag for. Fast to deploy.
Cons
Autocapture generates noise that needs curating. Quoted pricing lacks transparency. Ecommerce reporting is less opinionated than purpose-built tools.
Why it's ranked #9. The autocapture advantage is real and mostly matters to teams without engineering support, which is a narrower group than it sounds.
Shopify Analytics
Best fit: Shopify merchants who need core reporting without adding a tool.
Shopify Analytics is included with all Shopify plans and reports sales, sessions, conversion rate and product performance from data the platform already holds.
Key features
Sales and order reporting by product, channel and region. Conversion funnel from session to checkout. Customer reports covering repeat purchase behavior. Live view of current store activity. Report depth that scales with the Shopify plan tier.
Pricing
Included with every Shopify plan.
Pros
Zero setup and no tracking gaps, since the data comes from the order system. Revenue figures reconcile with payouts. Costs nothing extra.
Cons
Reporting depth is tied to your Shopify plan. Weak on marketing attribution. No visibility outside Shopify.
Why it's ranked #10. Accurate and free for merchants who already pay for Shopify, ranked here because it answers fewer questions than anything above it.
WooCommerce Analytics
Best fit: WooCommerce stores wanting native reporting inside WordPress.
WooCommerce Analytics ships free to the more than 6 million WordPress sites running the plugin, covering orders, products, coupons and customer reporting.
Key features
Order and revenue reporting with date comparison. Product and category performance. Coupon and discount analysis. Customer reports covering new against returning. Scheduled email summaries.
Pricing
Free with WooCommerce.
Pros
No cost and no integration work. Order data matches the store database exactly. Extends through the WooCommerce plugin ecosystem.
Cons
Reporting is basic against paid tools. Performance degrades on large catalogues. No behavioral or attribution analysis.
Why it's ranked #11. Sound native reporting for WooCommerce merchants, and a starting point most stores outgrow.
Littledata
Best fit: stores whose analytics revenue never matches their payment processor.
Littledata fixes tracking accuracy through server-side connections between Shopify and analytics destinations, recovering conversions that client-side tracking loses.
Key features
Server-side tracking from Shopify to GA4 and other destinations. Subscription and recurring order tracking. Marketing channel attribution corrected for lost sessions. Automated audit of tracking setup. Support for headless storefronts.
Pricing
Published tiers scaled by monthly order volume.
Pros
Solves a specific and expensive accuracy problem. Subscription order tracking that GA4 handles poorly. Fast setup for a technical fix.
Cons
A tracking fix with no broader reporting layer. Adds a subscription on top of the tools it feeds. Value depends entirely on how broken your current tracking is.
Why it's ranked #12. Genuinely useful and the narrowest tool here, since a store with accurate tracking needs none of it.
The metrics ecommerce analytics has to get right
Conversion rate
Conversion rate is sessions that end in a purchase, and the number is meaningless without a denominator you trust. A store counting bot traffic as sessions reports a lower conversion rate than it earns.
Average order value
Average order value tracks what a customer spends per order. Watch it alongside conversion rate, because a discount that lifts conversion while cutting order value can leave revenue flat and margin worse.
Customer lifetime value
Customer lifetime value estimates total revenue from a customer across their relationship with the store. It decides what you can afford to pay to acquire one, which makes it the number that governs marketing spend.
Cart abandonment rate
Cart abandonment is the share of shoppers who add to cart and leave. The rate itself changes little; the value is in the friction points behind it, which is where session replay earns its cost.
Customer acquisition cost
Customer acquisition cost divides marketing spend by new customers. Compared against lifetime value, it is the ratio that tells you if growth is profitable or borrowed.
Customer retention and repeat rate
Customer retention measures how many buyers come back. For most stores it moves profit further than acquisition does, since a repeat buyer costs nothing to reach and converts at a higher rate.
Marketplace and channel performance
Stores selling on Amazon, eBay or a physical channel need marketplace performance reporting alongside their own site data. Few analytics tools handle this natively, which is where a multichannel platform like Glew or a BI layer earns its place.
Choosing ecommerce analytics tools by store size
The right platform changes more with revenue than with industry. A store doing $50,000 a month and one doing $5 million have different problems, and buying the second store's stack early is the most common way merchants waste an analytics budget.
Early-stage stores under $100,000 a month
Native reporting plus GA4 covers this stage completely. The questions that matter are which products sell, which traffic sources bring buyers, and where the checkout loses people. Shopify Analytics or WooCommerce Analytics answers the first, GA4 answers the second, and Hotjar's free tier answers the third for nothing.
The trap at this stage is buying an attribution tool before there is enough paid spend to attribute. Below roughly $10,000 a month in ad spend, the model error exceeds the money at stake.
Scaling stores between $100,000 and $1 million a month
At this stage, a second tool starts paying for itself. Paid media spend is now large enough that a 20% attribution error moves real money, and traffic is high enough that behavioral analysis finds fixable friction worth thousands a month.
Most stores at this stage run three things: GA4 as the baseline, a behavioral tool for the checkout, and an attribution platform if more than two paid channels are active. Adding a fourth tool here usually signals that nobody has taken ownership of the first three.
Enterprise retail above $1 million a month
At this volume the constraint moves from tooling to data engineering. Data warehouse integration, server-side tracking and a governed event taxonomy are what matter at that point, and Adobe Analytics or a warehouse-native stack starts to make financial sense.
The analyst headcount is the real decision. A $100,000 platform with nobody to run it produces less than a free tool with a dedicated owner.
Attribution after the iOS privacy changes
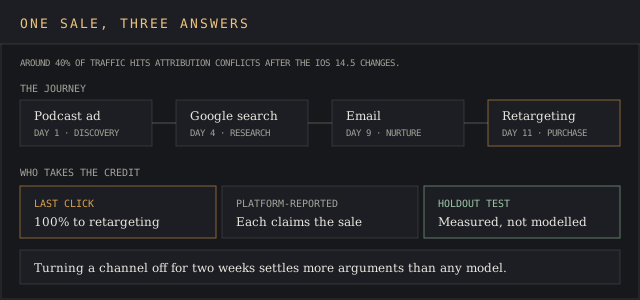
Around 40% of traffic now experiences attribution conflicts following the iOS 14.5 changes, which means platform-reported conversions and store-reported conversions disagree routinely. Meta reports one number, GA4 reports another, and the store's own order data reports a third.
Why last-click misleads
Last-click attribution credits the final touchpoint before purchase. A customer who found you through a podcast, researched on Google, and clicked a retargeting ad gets counted as a retargeting win, which quietly overvalues the cheapest channel to run.
What to do instead
Run multi-touch attribution as a directional guide and validate it with holdout tests. Turning a channel off for two weeks produces more reliable evidence than any model, and most attribution disputes end when someone runs that test.
Server-side tracking as the structural fix
Client-side tracking sends events from the shopper's browser, where ad blockers and browser privacy settings intercept a meaningful share of them. Server-side tracking sends the same events from your own server, which recovers most of the loss and survives browser changes that break the client-side approach again next year.
The cost is implementation work and, usually, a subscription to something like Littledata that handles the connection. Stores where analytics revenue trails processor revenue by more than 10% recover the fee quickly.
Data sources an ecommerce analytics platform pulls from
A dashboard is only as good as the feeds behind it, and most disagreements between two tools trace back to one of them missing a source.
Store and order data
The ecommerce platform holds the authoritative record: orders, line items, refunds, customer accounts. This is the only source that reconciles with money received, which is why it settles arguments between other tools.
Behavioral and session data
Pageviews, clicks, scroll depth and session recordings come from a tag or SDK on the storefront. This data explains behavior and never reconciles perfectly with order data, because sessions and orders count different things.
Advertising platform data
Meta, Google, TikTok and the rest each report conversions using their own attribution window and their own modeling. Pulling these in gives spend and platform-reported performance, and treating the conversion counts as ground truth is where most attribution errors begin.
Email, SMS and CRM data
Marketing platforms report sends, opens and clicks, and connect a customer identity across sessions. This is what turns anonymous session data into customer lifetime value by cohort.
Free against paid ecommerce analytics tools
Free tools cover more ground than most merchants expect. GA4, Shopify Analytics and WooCommerce Analytics between them answer traffic, conversion, product performance and basic funnel questions at no cost. Microsoft Clarity and Matomo On-Premise are two more free trackers, both listed at $0.
Paid tools earn their price in three situations: when you need to know why customers behave as they do, when attribution across paid channels decides real budget, and when data volume or accuracy exceeds what a free tier handles. A store spending nothing on ads and selling one product line rarely hits any of the three.
Customer segmentation that changes what you do
Segmentation earns its cost when a segment triggers a different action. A report splitting customers into new and returning is a fact; a report showing that returning customers who bought from a specific category churn after 90 days is a retention campaign.
Behavioral segments
Group customers by what they did: first purchase category, discount sensitivity, session count before converting, device used. The same segments feed a customer journey map. These segments predict future behavior better than demographics for most stores.
Value segments
Rank customers by lifetime value and look at the top decile's acquisition source. Stores routinely discover their most valuable customers arrive through a channel receiving a fraction of the budget.
Lifecycle segments
New, active, at-risk and lapsed customers need different messages. The threshold between active and at-risk should come from your own repurchase interval data, since a 60-day gap means something different for coffee than for furniture.
Fitting an analytics platform into an existing stack
Most stores end up running two or three tools together: a baseline platform, a behavioral layer, and an attribution tool if paid media matters. That is a reasonable outcome, and it becomes expensive when nobody owns the overlap.
Before adding a tool, write down which question it answers that the existing stack cannot. If the honest answer is that the interface is nicer, the spend belongs elsewhere.
Our retail analytics ranking covers the platforms built for physical retail and CPG, and the digital marketing intelligence ranking covers competitor traffic and paid media research.
Building a reporting routine the team uses
A dashboard nobody opens is a subscription. The stores getting value from ecommerce analytics tools share one habit: a fixed review at a fixed cadence with a named owner, and a decision expected at the end of it.
The weekly trading review
Thirty minutes, four numbers: revenue against target, conversion rate against last week, average order value, and paid spend efficiency. Anything anomalous gets one owner and a deadline. Most stores that install this routine find the tooling they already own was sufficient.
The monthly cohort review
Cohort and lifetime value data moves too slowly for weekly attention. Once a month, look at how each acquisition cohort is repurchasing, and compare acquisition cost against realized value for cohorts old enough to judge.
Let alerts do the watching
Configure alerts on the handful of metrics where a sudden move needs same-day action: conversion rate dropping below a floor, checkout errors spiking, a payment method failing. Everything else can wait for the review, and treating everything as urgent is how teams stop reading alerts.
What ecommerce analytics tools cannot tell you
Analytics reports what happened on your store. Several questions that decide strategy sit outside that boundary, and expecting a platform to answer them wastes months.
Competitor performance
No analytics tool sees a competitor's conversion rate or basket composition. Traffic estimation platforms model competitor visits from panel and clickstream data, which is a different discipline covered in our digital marketing intelligence ranking.
Why a customer chose a rival
Behavioral data shows the exit and never the reason. Post-purchase surveys, cancelled-cart outreach and customer interviews fill that gap, and the qualitative answer usually reframes the quantitative one.
Market-level demand shifts
A store's own data lags the market it sells into. Category demand moving before it reaches your traffic is a market research question.
Implementation mistakes that waste the investment
Tracking everything and analyzing nothing
A tracking plan with 400 events and no owner produces a data warehouse nobody queries. Start with the ten events tied to revenue and add more when a specific question demands them.
Trusting one number across three tools
Analytics platforms count sessions differently, attribute conversions differently and define a purchase differently. Pick one system as the reporting source of truth and treat the others as diagnostic.
Skipping the reconciliation step
Compare your analytics revenue against your payment processor monthly. A gap over 5% means the tracking is broken, and every decision made on that data inherits the error.
Consent, privacy and the data you are allowed to collect
Every tool here collects personal data, and the rules governing it decide what you can measure. Consent banners suppress tracking until a visitor agrees, which means analytics data under GDPR describes consenting visitors only.
What consent mode changes
Google's consent mode models the behavior of visitors who declined tracking, filling the gap with estimates. The estimate is better than nothing and worse than measurement, and knowing which parts of a report are modelled matters before anyone makes a budget decision on it.
Regional differences worth planning for
European stores typically see 20% to 40% of visitors decline tracking, and the share varies by country and by how the banner is worded. North American stores face lighter restrictions and a growing patchwork of state-level rules. A single global analytics setup will misreport at least one of these markets.
Server-side collection and consent
Server-side tracking recovers events lost to browser restrictions, and it does not override a visitor's refusal to be tracked. Consent still governs what you may collect, and treating the server-side move as a way around that is a compliance problem.
Ecommerce analytics tools FAQ
What are ecommerce analytics tools?
Software that collects data on store traffic, customer behavior and sales, then reports it so a merchant can see what drives revenue and what blocks it.
What is the best ecommerce analytics tool?
GA4 for a free baseline, Contentsquare for behavioral depth, Triple Whale for Shopify attribution, Adobe Analytics for enterprise retail with analysts on staff.
Is Google Analytics enough for an online store?
For many stores, yes. It reports traffic, conversion and product performance at no cost. It falls short on explaining behavior, and on attribution once paid media spend gets serious.
How much do ecommerce analytics tools cost?
Free at the bottom, with GA4, Shopify Analytics and WooCommerce Analytics costing nothing. Mid-market behavioral and attribution tools price by session or order volume. Adobe Analytics starts around $100,000 a year.
What metrics should an ecommerce store track first?
Conversion rate, average order value, customer acquisition cost and cart abandonment rate. Those four cover if people buy, how much they spend, what they cost to reach, and where they leave.
Do these tools work with Shopify and WooCommerce?
Every tool here integrates with Shopify. Most integrate with WooCommerce, though attribution tools like Triple Whale are built Shopify-first and cover WooCommerce less thoroughly.
How long before an analytics tool produces useful data?
Autocapture tools report within days. Tools needing a tracking plan take two to six weeks before the data is trustworthy, and cohort analysis needs a full purchase cycle before the numbers mean anything.
Can one tool replace all of them?
Adobe Analytics comes closest at enterprise scale, and most stores below that run two or three tools because the free baseline is good enough to keep and the specialist tools do one job better than any suite.
How often should the data be reviewed?
Daily for paid media performance, weekly for conversion and funnel metrics, monthly for cohort and lifetime value analysis. Reviewing cohort data daily produces noise that looks like signal.
Bottom line
Start with GA4 and Shopify or WooCommerce reporting, since they cost nothing and answer more than most merchants expect. Add a behavioral tool when you can name the page that loses customers and cannot explain it. Add an attribution tool when paid media spend is large enough that a 20% misallocation matters.
Reconcile every tool against your payment processor before trusting any dashboard it produces. Analytics that disagrees with the bank account is a reporting problem, and it stays one until somebody fixes the tracking.