Hotjar vs Amplitude
 By Jan Suski. I go deep on every review, checking every number against its source and digging up details other coverage misses, a habit from six years of SEO and link building for tech companies. Bylines at Surfer, Brand24, and Senuto. How the scoring works.
· Prefer this source on Google
| WHAT EACH ONE DOES | AMPLITUDE | HOTJAR |
|---|---|---|
| Core job | Measure a product | Diagnose a page |
| Data model | Typed event stream | Session recordings |
| Cohort analysis | To 2 million users | No equivalent |
| Retention analysis | Native curves | None |
| Session replay | 10,000/mo on Free | Every tier, metered |
| Heat mapping | Plus tier and up | All tiers |
| Feedback surveys | Growth and up | All tiers |
| A/B experiments | Growth and up | No feature |
| Mobile apps | iOS and Android SDKs | Web only |
| Skip it if | No engineers to spare | You ship mobile only |
| WHAT YOU GET | AMPLITUDE | HOTJAR |
|---|---|---|
| Free tier | 2m events a month | 200k sessions a month |
| Paid entry | $75/mo, 3m events | $39/mo, 7k sessions |
| Test scenario | $225 a month | $591 a month |
| Annual discount | 20% | 20% |
| Paid retention | 2 years on Plus | 13 months |
| Seats | Unlimited, all tiers | Unmetered |
| Single sign-on | Growth and up | Pro and up |
| Fastest response | 1 hour, paid add-on | Enterprise only |
| G2 rating | 4.5 from 2,765 | 4.3 from 342 |
| Owner | Nasdaq: AMPL | Contentsquare |
StrongerWeakerNo edge
Thirty-six further documented limits sit behind the button below: event ceilings, cohort caps, replay retention, API rate limits and what each plan gates. Test scenario is one product doing 200,000 monthly sessions at roughly 25 tracked events per session, which is 5 million events a month, billed annually on both sides. Prices come from each vendor's own in-page estimator, read 8 August 2026. Every figure is sourced in the section its row links to.
| Amplitude | WHAT IT DOCUMENTS |
|---|---|
| Free plan events | 2 million a month, forever, no card |
| Plus event ceiling | Scales to 70 million events a month |
| Behavioral cohorts | Plus capped at 5*, unlimited on Growth |
| Cohort size cap | 2 million users in one cohort |
| Cohort Download API | 500 requests a month, Growth and up |
| Cohort sync tiers | Real-time syncs on Growth and Enterprise |
| Replay retention | Deleted after about 30 days unless bookmarked |
| Extended replay retention | 3 to 12 months, Growth and Enterprise |
| Data retention | 2 years on Plus, custom above it |
| Ingest rate limit | 429 above 30 events a second per device |
| Project ingest ceiling | 50,000 events a second, 150,000 by SDK |
| User property throttle | 1,800 updates an hour per Amplitude ID |
| Query API rate limit | 108,000 cost an hour, 5 concurrent |
| Export API limits | 4 GB a request, 365-day maximum range |
| Instrumentation limits | 2,000 event types, 1,000 user properties |
| Chart lookback | 365 days daily, 36 months monthly |
| Behavioral sampling | Paid add-on; no sampling by default |
| Heatmaps | Plus tier on pricing*, replay add-on in docs |
| Hotjar | WHAT IT DOCUMENTS |
|---|---|
| Free plan sessions | 200,000 a month on one project |
| Growth ladder | From $49, 7,000 to 10 million sessions |
| Projects | 1 on Free, 3 on Growth, 6 on Pro |
| Replay capture rate | 5% to 10,000 on Free, 15% on Growth |
| Replay access window | 1 month Free, up to 24 on Pro† |
| Analytics data access | 1 month Free, 13 months Growth† |
| Data retention | 365 days from capture, every plan† |
| Survey responses | 100 a month Free, up to 100,000† |
| Survey widgets | 3 on Free, unlimited from Growth |
| Session definition | Ends after 30 idle minutes, 4 hour cap |
| Behaviour at the cap | Capture spread across the 24 hours |
| API rate limit | 3,000 requests a minute, 50 a second |
| API plan gate | Scale plans only, 100 items a page |
| API key expiry | One year, and it cannot be extended |
| Heatmap capture cap | 10 MB of HTML, 50,000 px screenshot |
| Pre-built integrations | 7 on Free, 9 on Growth, 115+ on Pro |
| SSO | Google OAuth Free and Growth, SAML on Pro |
| Free trial | 15 days of Growth, no card taken |
*Amplitude states these two ways. Its pricing page lists 20 behavioral cohorts on Plus; its cohort documentation says Plus organisations are limited to five. Pricing sells Heatmaps as a Plus feature while the Heatmaps doc says they need the Session Replay add-on, which pricing itself sells only from Growth.
†Hotjar states this two ways on one page. Its retention article ships an unresolved A/B test, so the same HTML holds both "365 days from capture" on "all accounts and plans" and a Basic 1 month, Plus 6 months, Business 12 months split. Both name Hotjar plans, so this is one product contradicting itself.
Contentsquare’s pricing table separately gives Product Analytics history as 6 and 12 months on its plan cards against 7 and 13 months in the table below them; and free survey responses read 100 a month there against 20 a month for Ask Basic in the help centre.
Sources, and the plan names that no longer match
Every row comes from a vendor property.
- Amplitude: amplitude.com/pricing and amplitude.com/docs, covering the analytics, cohort, session-replay, API and limits-and-quotas pages.
- Hotjar: contentsquare.com/pricing, where hotjar.com/pricing now resolves, and help.hotjar.com.
Both vendors run stale plan vocabularies in their own documentation. Amplitude's AI Visibility doc gates behaviour on a Starter plan that appears nowhere on its pricing page, and Hotjar's help centre still uses Basic, Plus, Business and Scale against the current Free, Growth, Pro and Enterprise.
Amplitude publishes no Plus session-replay quota, no seat caps and no included event volumes for Growth or Enterprise, so no row claims them. The Heatmaps tier mismatch is one entry in our report on software still sold under tiers its own docs contradict.
Amplitude counts what users do inside a product and Hotjar records the sessions users have on a website, so the Hotjar vs Amplitude decision turns on which unit your question is asked in. This page prices both platforms against one identical scenario, sets out what each tier gates & covers Crazy Egg as the third option teams shortlist alongside them.
It's for product teams and digital marketers holding a quote from one of these analytics tools and wondering if the other belongs in the tech stack too.
The units matter more than the feature lists, because both tools charge for what your users generate. A content website whose users generate 200,000 monthly sessions and light instrumentation lands inside Amplitude's free plan and on Hotjar's most expensive published tier. A heavily instrumented app with modest traffic does the reverse.
Amplitude and Hotjar share session replay and nothing else of substance. Cohort analysis, retention analysis and a queryable model of user actions are the reasons Amplitude exists, and Hotjar has none of the three. No amount of feature-list overlap closes that.
↑ COMPARISONPricing: one meters events, the other meters sessions
Pick one scenario and price both. A product doing 200,000 monthly sessions at roughly 25 tracked events per session, which is 5 million events a month, billed annually.
Amplitude Analytics costs $225 a month at 5 million events on Plus. Hotjar costs $591 a month at 200,000 sessions. Both figures come from each vendor's own in-page estimator, read on 8 August 2026, and both vendors take exactly 20% off for annual billing.
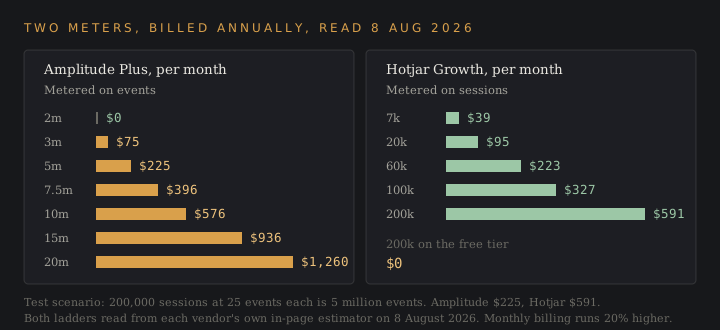
Amplitude publishes its whole ladder, which is unusual in this category. The first 2 million events each month are free on Plus, and everything above that is metered.
| Monthly events | Amplitude Plus, billed annually |
|---|---|
| 2 million | $0 |
| 3 million | $75 |
| 5 million | $225 |
| 7.5 million | $396 |
| 10 million | $576 |
| 12.5 million | $756 |
| 15 million | $936 |
| 20 million | $1,260 |
Work the arithmetic and the rate is close to flat: about $72 per million billable events per month on annual billing, from 3 million right up to 20 million. Monthly billing runs 25% higher, so the same 15 million events cost $936 annually against $1,170 monthly.
Hotjar's ladder is shorter and steeper, and it stops. Growth runs $39 a month at 7,000 sessions, $95 at 20,000, $223 at 60,000, $327 at 100,000 and $591 at 200,000. Past 240,000 sessions the estimator returns a sales conversation.
Where this gets interesting is the free plans. Hotjar's free tier covers 200,000 monthly sessions for nothing while Growth charges $591 for the same 200,000 sessions, so the paid tier sells 13-month data access, three projects and API access. Amplitude's free plan caps at 2 million events forever, with no credit card, unlimited seats & 10,000 monthly session replays included.
Amplitude also runs a Startup Scholarship: companies under $10 million in funding with fewer than 20 employees get a free year on Growth.
Vendr's tracked contract data for Amplitude at the other end reads a $64,000 median across 414 purchases, low $24,575 and high $341,871, with 16% average negotiated savings.
↑ COMPARISONWhat each tier gates, and where that bites
Amplitude gives every plan the full platform and unlimited seats, then meters volume and gates the advanced analytics behind tiers. That's a friendlier shape than seat-based pricing for a wide team, and a harsher one the moment you need a specific capability.
| Capability | Lowest Amplitude tier that includes it |
|---|---|
| Session replay, 10,000/month | Free |
| Basic product analytics | Free |
| Custom events and formulas | Plus |
| Heatmaps | Plus |
| 20 behavioral cohorts | Plus |
| 2-year data retention | Plus |
| SSO and project permissions | Growth |
| Unlimited experiments | Growth |
| HIPAA business associate agreement | Growth |
| Data access controls and RBAC | Enterprise |
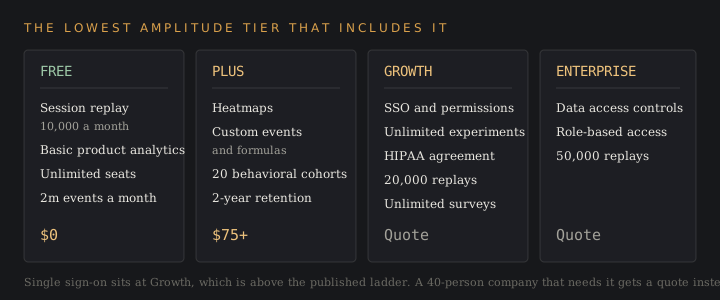
SSO at the Growth tier is the row that ends evaluations. A 40-person company that needs single sign-on can't buy it on the published Plus ladder at any event volume, so the price jumps from a number on a page to a quote.
Hotjar gates differently. SAML arrives at Pro while Free and Growth get Google OAuth, the API appears at Pro, and journey analysis and zone-based heat mapping arrive at Growth. Both hotjar and Amplitude put their identity controls above their published prices.
↑ COMPARISONSession replay on both sides, and what it costs
Amplitude launched session replay into general availability on 7 February 2024, alongside a pricing rebuild. It's metered by monthly replay volume: 10,000 on Free, 20,000 on Growth, 50,000 on Enterprise, with expanded packages priced as a percentage of the platform plan.
The Growth and Enterprise replay add-on buys three things the base allowance doesn't include: AI-generated session summaries, targeted replay capture so you only record the user sessions you care about, & extended retention of 3 to 12 months.
Hotjar's session recordings are the product. Every tier records, the meter is the same session allowance that drives the price, and retention runs 365 days from capture on all accounts.
Hotjar's own retention article prints both answers at once. An unresolved A/B test leaves the 365-day figure and a Basic 1 month, Plus 6 months, Business 12 months split in the same HTML, so a crawler reading the page without JavaScript sees both.
The difference in practice is what you do next. In Amplitude a replay hangs off an event in a funnel, so you watch the users who dropped at step four. In Hotjar a recording hangs off a page, so you watch what happened on the checkout. Both are session replay; they answer different questions.
↑ COMPARISONCohort analysis, retention analysis and the queryable event model
Amplitude's core is a typed event stream of user actions, and every piece of advanced analytics sits on top of it. Behavioral segmentation runs on cohorts of up to 2 million users, inline cohort lookback caps at a 3-year date range and returns a 404 beyond it, and data retention on Plus runs two years.
Cohort retention is the capability with no Hotjar equivalent at all, and it's where user behavior over months becomes visible. Amplitude draws retention curves for any pair of user actions, adds lifecycle segmentation on top, and lets you compare cohorts against each other, which is how product teams measure long term customer loyalty. No amount of session recordings substitutes for it.
Funnel analysis exists in both platforms but means different things. Amplitude builds funnels from arbitrary event sequences across apps; Hotjar builds them from the pages users moved through on one site. A signup flow spanning an email link, a mobile app and a web confirmation only assembles in one of them.
Amplitude's API limits are published and worth knowing before you build on them. The Dashboard REST API allows up to 108,000 query cost per hour and 5 concurrent requests; the Cohort Download API allows 60 requests per 10 minutes per app with 4 parallel; User Activity and User Search allow 10 concurrent requests and 360 queries an hour.
↑ COMPARISONHeat mapping, visitor recordings and feedback polls in Hotjar
Hotjar's answer to why users behave a certain way is visual, and it reads user behavior straight off the screen. A click map shows where users click, a scroll map shows how far down a page users read, and both make a below-the-fold call to action obvious in one screenshot.
Feedback polls & surveys add the attitudinal half, and they're how users tell you in their own words what the event data missed. Voice of Customer carries 100 responses and three feedback widgets free, then 500 responses from $79 a month with unlimited widgets and unlimited responses access. Real time feedback from users who abandoned a page is a different kind of evidence from an event count, and it turns quantitative insights into something you can act on.
Survey response data behaves oddly on retention: it's never deleted automatically and only goes when an admin removes it, so user feedback outlives the session recordings that produced it. Identified users are purged after 365 days of site inactivity and de-identified users after three months.
One structural detail catches people out. Hotjar heatmaps are generated from recording data, so deleting a recording removes it from the heat mapping too, and a privacy deletion quietly changes an aggregate.
Crazy Egg, and the claims each vendor makes about the others
Crazy Egg is the third name on most shortlists that start with these two tools, and it meters differently again: tracked pageviews, with heatmap reports capped per tier. Founded in 2006, it claims over 449,000 websites on its pricing page and over 400,000 in its blog footer.
| Crazy Egg plan | Billed annually | Pageviews/month | Heatmap reports | Recordings/month | Recording storage |
|---|---|---|---|---|---|
| Starter | $29 | 5,000 | 5 | 50 | 6 months |
| Plus | $99 | 150,000 | 75 | 1,000 | 2 years |
| Pro | $249 | 500,000 | 100 | 5,000 | 2 years |
| Enterprise | $599 | 1,000,000 | 200 | 10,000 | 2 years |
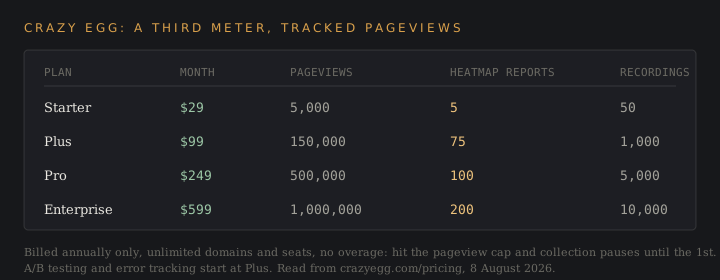
Every Crazy Egg plan is billed annually only, carries unlimited domains & unlimited seats, and charges no overage: hit the pageview cap and collection pauses until the 1st of the next month. A/B testing & error tracking start at Plus, popup surveys are unlimited on every paid tier, and the free trial runs 30 days.
Crazy Egg's five named report types are its distinguishing feature: Click Map, Scroll Map, Confetti Map (individual clicks segmentable by source, OS, UTM & 17 other metrics), Overlay Map, and List Map, which is a numerical export with no screenshot at all.
Now the part worth checking. Hotjar publishes a comparison page against Crazy Egg, and these are the claims on it.
- "Only Hotjar has a free forever plan; Crazy Egg starts at $588/year".
- Crazy Egg "collects limited user recordings (only 500/month on the $588/year plan)".
- "Hotjar offers unlimited heatmaps on all plans, whereas Crazy Egg is capped, starting at 50 on the standard plan".
That page was last updated 3 July 2024 and its own footnote dates the underlying data to November 2023.

Crazy Egg's live pricing page today shows a $29 monthly Starter plan billed annually, a separate no-card free plan, 50 recordings a month on Starter, and 5 heatmap reports. Three of Hotjar's four checkable claims no longer match the product they describe. The unlimited heatmaps claim still holds on Hotjar's side.
Crazy Egg returns fire on its own page, updated 5 November 2025, which says Hotjar "offers some deeper customization but requires more technical and design expertise" and names built-in A/B testing, real-time visitor activity, goal tracking and custom CTA testing as four things Hotjar doesn't ship. That same page credits Hotjar with dashboards and funnels in its own comparison table.
Crazy Egg also publishes an Amplitude alternatives post, dated 23 September 2025, naming itself the top pick for website-based businesses and listing its own weakness in the same breath: no native mobile app analytics.
↑ COMPARISONCorporate condition: a listed company and a subsidiary
Amplitude trades on Nasdaq as AMPL after a direct listing on 28 September 2021, so its numbers are public. Q2 2026 revenue was $100.9 million, up 21% year over year and the company's first quarter above $100 million. ARR reached $410 million, up 22%, including $17 million from Statsig.
Customers with $100,000 or more in ARR reached 824, up 30% from 634, against more than 5,200 paying customers overall, with net dollar retention at 105% on a pro forma basis. Full-year 2026 guidance was raised to $407.2 million to $411.2 million.
The share price tells a rougher story for users watching the company. After Q1 2026 the stock fell 23% on an adjusted loss of $0.02 a share despite revenue of $93.49 million beating estimates, and BofA Securities cut the rating to Neutral with an $8 target.
In early August 2026 the stock traded at $5.92, down 45.9% year to date and 55.5% below its $13.29 July 2025 high. Several analysts raised their targets after the Q2 result.
- Baird to $14.
- UBS and Piper Sandler to $13.
- Citi to $11.
- DA Davidson to $12.50.
Amplitude has bought companies steadily.
- ClearBrain, March 2020.
- Iteratively, 2021.
- Command AI, announced 15 October 2024 for north of $45 million, whose roughly 30-person team became the in-product nudges, tours, onboarding guides & surveys.
Statsig arrived differently. OpenAI acquired the Statsig team for $1.1 billion in September 2025, and in May 2026 Amplitude took over the Statsig brand and customer base in a partnership carrying around $16 million in ARR.
Headcount went the other way twice. In April 2023 Amplitude cut 99 roles, 13% of its workforce, and in February 2026 President Thomas Hansen departed effective 31 March.
Hotjar's corporate position is simpler and less visible. Contentsquare acquired it in a deal announced 1 September 2021 with no disclosed value, and Hotjar Ltd of Malta merged into the Contentsquare Group on 1 July 2025. Contentsquare itself raised a $600 million Series F in July 2022 at a $5.6 billion valuation, $1.4 billion raised in total, and acquired Heap on 7 December 2023.
↑ COMPARISONDocumented limits, reliability and customer support
Both vendors publish status pages, which is worth saying plainly: a platform that publishes uptime can be measured and one that doesn't can't.
| Measure | Amplitude | Hotjar |
|---|---|---|
| 90-day uptime, 8 Aug 2026 | Analytics 99.93%, Web App 99.95%, Data 99.99%, Session Replay 99.96% | 100.0% across all components |
| Recent incidents | Processing delays resolved 31 Jul and 1 Aug 2026, both stated no data lost | One incident 30 Jul 2026, resolved same day at 22:00 UTC |
| Longer record | 283 incidents since April 2020, typical resolution 148 minutes | 2025 Recordings database fault, two outage windows to 17:54 UTC, data not collected |
| Fastest published response | 1 hour for P0 on the Premium Success Plan Signature add-on | Priority support and SLAs at Enterprise only |
| Standard support | Support tickets routed to the office matching submission location | Ticket and chat on Free, Growth and Pro |
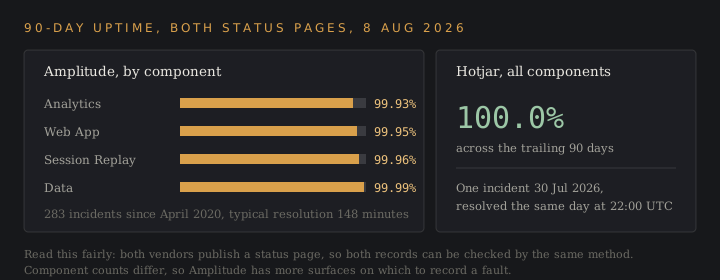
Amplitude's customer support is a paid add-on at the sharp end. The Premium Success Plan buys a 1-hour initial response on urgent P0 issues at Signature level and a 2-hour SLA at Basic and Advanced, with weekend and holiday on-call. Without it, support tickets take the standard queue.
On compliance both clear the usual bar.
- Amplitude: SOC 2 Type II, SOC 1 Type II and ISO 27001, 27017 and 27018.
- Amplitude hosting and data terms: AWS US or EU with residency fixed per organisation, around 18 subprocessors published with 10 business days' notice of changes, and a contractual bar on its AI partners training on customer data using zero-retention endpoints.
- Contentsquare: SOC 2 Type II plus ISO 27001, 27017, 27018 & 27701, end-user data on AWS eu-west-1 in Ireland, form input masked by default.
HIPAA business associate agreements are Growth and Enterprise only.
↑ COMPARISONReading the review scores and their sample sizes
Scores without counts mislead, so here are both, read on 8 August 2026.
| Platform | G2 | Capterra | TrustRadius |
|---|---|---|---|
| Amplitude Analytics | 4.5 / 5 from 2,765 reviews | 4.6 / 5 from 67 reviews | 8.6 / 10 |
| Hotjar | 4.3 / 5 from 342 reviews | 4.7 from 535, or 4.6 from 543 | 8 / 10 from 364 reviews |
| Crazy Egg | 4.2 / 5 from 128 reviews | 4.4 / 5 from 86 reviews | 8 / 10 from 130 reviews |
The G2 gap is a sample-size gap as much as a quality one. Amplitude Analytics carries 2,765 reviews against Hotjar's 342, and Amplitude's own session replay product is listed separately at 170. Comparing a product analytics platform's rating to a session-recording tool's rating compares two different categories.
Capterra's 67-review Amplitude listing is the number to treat carefully, since its subscores split sharply: Features 4.6 and Ease of Use 4.1. G2's ease-of-setup subscore lands at 7.9 to 8.0 against quality of support at 8.4 to 8.5, which points the same direction.
Surfer's own fact list for this comparison quotes Hotjar at 4.3 from 298 reviews and Amplitude at 4.5 from 2,018. Both counts have climbed since, which is why any review figure needs the date it was read.
The steep learning curve, and who ends up using each platform
The ease-of-setup subscore is the measurable end of a real difference. Amplitude asks you to define an event taxonomy before it returns anything useful, and a badly designed taxonomy produces a product analytics platform full of custom metrics nobody trusts. That's the steep learning curve people describe, and it's a data modelling problem.
Hotjar asks for one script and returns session recordings the same afternoon, so users start collecting insights on day one. The technical knowledge required is close to zero, which is why UX designers and digital marketers adopt it without an engineering ticket, and why it shows up on websites where nobody owns analytics at all. Both are powerful tools; only one of them asks users to model their data first.
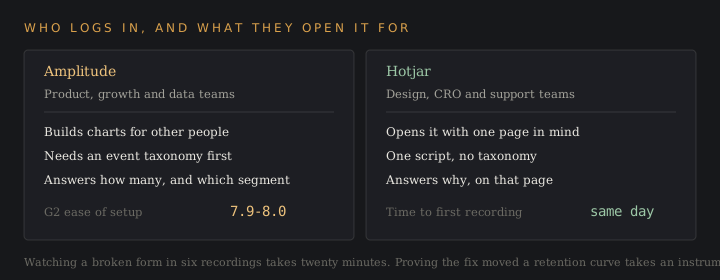
That difference in user experience decides who logs in. Amplitude Analytics belongs to product teams, growth teams and data analysts running data analysis against a shared event model, and the users in it every week are building charts for other users. Hotjar belongs to design, CRO and support teams, and those users open it with one page in mind, watch fifteen user sessions and close it again.
Fast iteration favours Hotjar for the first question and Amplitude for the second. Watching users interact with a broken form in a few session recordings takes twenty minutes; proving the fix moved a retention curve takes an instrumented event and a month of data.
Running both, and what the integration passes
The official integration is one-way. Amplitude forwards events, with user_id or device_id and user properties, into the Hotjar API so you can filter recordings by them. Nothing flows back into Amplitude, so a Hotjar segment stays inside Hotjar.
That asymmetry sets the workflow. Amplitude answers how many users hit a problem and which segments those users belong to; you push those events across and Hotjar shows you the sessions. Understanding user behavior in a product with both installed means reading a number in one platform and its cause in the other.
Many teams also keep Google Analytics for acquisition, since neither of these two tools reports traffic sources. Google Analytics attributes the visit, Amplitude measures what users did inside the product, and Hotjar shows the page where the user journey went wrong. Three tools sounds excessive until you notice none of them answers the other two's question.
Cost of the pair at the test scenario is $816 a month billed annually, $225 for Amplitude at 5 million events plus $591 for Hotjar at 200,000 sessions, with Google Analytics adding nothing on the standard tier.
What it costs to leave
Hotjar publishes its exit terms. New Growth accounts carry a 30-day money-back guarantee and a full refund; cancel after day 30 and you're billed to the end of the cycle, which on an annual contract means a year from your last payment. Cancelling drops the account to the free tier. The account isn't deleted.
Sign an annual Growth plan and change your mind on day 31 and you owe eleven more months on a platform you've stopped opening. That's the single sharpest contractual edge on either side of this comparison.
Amplitude's exit cost is instrumentation, and it lands on your engineers. The event taxonomy you built lives in your own code, so the tracking survives a move, but the cohorts, charts and saved analyses don't, and two years of Plus-tier history goes with the account unless you've been exporting it.
The practical advice is the same on both: get an export running in week one. Hotjar offers CSV and a REST API rate-limited to 3,000 requests a minute per IP; Amplitude offers warehouse export on every paid plan.
↑ COMPARISONWhich tool fits which team
Choose Amplitude Analytics when the business objectives are stated in events. Feature adoption, activation rates, retention curves, cohort analysis, experiments, anything spanning web & mobile apps, and anything a data team needs to join against revenue. It's the platform for data driven decisions about a product's shape, and a data driven team will get further with it than with any number of recordings.
Choose Hotjar when the question is about a page and the users on it. A conversion rate fell, a redesign needs evidence, a checkout leaks, a form loses people at field six. Heat mapping, visitor recordings & feedback polls answer those in an afternoon with no instrumentation work, which is how the tool can save time for teams with no analytics engineer.
Crazy Egg is the better fit when you want built-in A/B testing alongside heatmaps and your users are counted in pageviews. Its Plus plan at $99 a month covers 150,000 pageviews with unlimited A/B tests, which Hotjar has no answer to at any price.
Run both tools together on any product with real revenue and a conversion goal, where conversion rates are the number under review. Neither is a substitute for the other, and both free plans are generous enough that users can test the pairing before anyone signs anything.
Skip Amplitude if your team has no engineering capacity to instrument the events your users generate, because an unmaintained taxonomy produces worse decisions than no analytics at all. Skip Hotjar if you only ship a mobile app, since the Hotjar brand covers web.
What each platform tells you about user experience
Amplitude reports user experience and user engagement as numbers. Activation rate, time to value, feature adoption and drop-off by step are all quantitative insights, and they scale to millions of users because no analyst has to watch anything. The trade is that a chart tells you conversion rates fell across your landing pages without telling you what users saw.
Hotjar reports overall user experience as evidence. You watch individual users move through one user journey at a time, read the heatmap for the page those users abandoned, and collect user feedback from the survey that fires on exit. That's the half of understanding user behavior no dashboard supplies, and it's why so many product teams keep both tools installed.
The two kinds of analytics fail in opposite directions. Watch six users interact with a broken checkout and you'll be certain of a cause that affects 2% of traffic; read an aggregate and you'll know something moved without knowing what those users saw. Actionable insights usually need one of each.
Data driven insights from Amplitude get stronger with volume and weaker in Hotjar, because a hundred recordings is a research session and ten thousand is a backlog. The practical rule is to size the question first: aggregate user behavior for how many, session recordings for why. Data driven decisions get made on the first and defended with the second.
Fitting either tool into an existing tech stack
Hotjar installs as one script and starts collecting insights the same day. It reads Google Tag Manager containers fine for its own tracking, and its integrations only send data to other tools. Users on a small support team can run it with no engineering involvement at all.
Amplitude expects an SDK per surface, covering iOS and Android as well as the browser, for digital products that span all three. New features land behind an event you have to define, so the tech stack question comes down to who maintains the taxonomy and how quickly they can ship a change.
Neither of these tools reports acquisition, so most stacks keep Google Analytics beside them. Google Analytics attributes the session, Amplitude measures what users did next, and Hotjar shows the page where it broke. Three different tools, three units, no overlap worth cutting.
Warehouse export is where the analysis tools converge. Amplitude ships data to a warehouse on every paid plan, Hotjar offers CSV and its API, and once both land in the same place a data analysis team can join user behavior to revenue without opening either interface.
One thing to check before signing: Amplitude's Free tier gives cohort syncs one time only, so continuous syncing to other tools in your stack starts at Plus. Teams that plan to pipe cohorts into an email platform should price that in before signing.
Essential features neither tool ships
Neither Amplitude nor Hotjar reports acquisition, so if you need to know which campaign sent the users who converted, both tools are silent and Google Analytics is the answer. That's the single largest gap in a stack built from these two analytics tools alone.
Neither of these analytics tools prices per seat, which is a genuine convenience: Amplitude gives unlimited seats on every plan including Free, and Hotjar doesn't meter team members at all. Wide access to both tools costs nothing, so user engagement with the tools themselves is rarely the constraint.
Neither of the two tools ships A/B testing at the entry tier. Amplitude's experimentation arrives at Growth, Hotjar has no testing feature, and Crazy Egg includes unlimited A/B tests from its $99 Plus plan. Teams that treat testing as an essential feature end up buying a third tool or paying for a Growth quote.
Neither predicts user behavior. Both tools describe what users already did, and while Amplitude sells lifecycle segmentation and predictive cohorts on upper tiers, the day-to-day work in both tools is reading behavioral data after the event.
Common Hotjar and Amplitude questions
Is Hotjar better than Amplitude?
For diagnosing a page and the users on it, yes. For measuring a product, no. Asking if hotjar is better than a product analytics platform compares a diagnostic tool to a measurement system, and the answer depends on the question you ask.
Who are Amplitude's top competitors?
Mixpanel & PostHog on the product analytics side, both of which Amplitude charts against itself on its own pricing page, plus Heap, now owned by Contentsquare alongside Hotjar. See how Hotjar stacks up against Mixpanel directly.
Who are Hotjar's competitors?
Microsoft Clarity, Crazy Egg, FullStory, Smartlook & Lucky Orange. Clarity is free at any volume, which reshapes the shortlist for budget-led teams.
What happened to Hotjar?
Contentsquare acquired it in 2021 and Hotjar Ltd merged into the Contentsquare Group on 1 July 2025. Pricing and signup moved to contentsquare.com; the brand and the login stayed.
Is Clarity better than Hotjar?
Clarity costs nothing at any traffic volume. Hotjar adds surveys, feedback widgets & 13-month data access on paid tiers. Price the free version of each before deciding.
Do both hotjar and Amplitude have free plans?
Yes, and both are open to unlimited users. Hotjar covers 200,000 monthly sessions; Amplitude covers 2 million monthly events with 10,000 session replays and unlimited seats, and neither asks for a card.
Can Hotjar replace Amplitude?
No. Hotjar has no cohort analysis, no retention analysis and no event model, so nothing in it reproduces what Amplitude stands on.
Which one has the steeper learning curve?
Amplitude, and the gap shows in G2's ease-of-setup subscore of 7.9 to 8.0. Hotjar needs one script and no taxonomy, which is the narrow sense in which hotjar is better for a team with no analyst.
Figures worth re-checking before you sign
Every price here was read on 8 August 2026 from the vendor's own pricing page or estimator. Three move faster than the rest.
Both ladders are generated by in-page calculators, so the $225 and $591 figures at the test scenario can change with no announcement. Hotjar's 365-day retention statement contradicts the legacy tier table beside it in the same article. And Amplitude's share price and analyst targets are from early August 2026, which is the shortest shelf life of any number on this page.
Sources for Amplitude: amplitude.com/pricing and its in-page event estimator; Amplitude developer documentation for the Dashboard REST, Cohort Download, User Activity and User Search API limits; status.amplitude.com; the Q2 2026 results release and Nasdaq AMPL market data.
Sources for Hotjar and Crazy Egg: contentsquare.com/pricing and its session estimator; help.hotjar.com on data retention, exports and cancellation; hotjar.com/blog/hotjar-vs-crazy-egg; status.hotjar.com; crazyegg.com/pricing and Crazy Egg's Hotjar and Amplitude comparison posts.
Third-party sources: Vendr's Amplitude marketplace page for the tracked contract median, spread and purchase count; G2, Capterra and TrustRadius listings for Amplitude Analytics, Hotjar and Crazy Egg. Accessed 8 August 2026.