PostHog vs Amplitude: Pricing, Plan Gates and What Each Vendor Claims (2026)
 By Jan Suski. I go deep on every review, checking every number against its source and digging up details other coverage misses, a habit from six years of SEO and link building for tech companies. Bylines at Surfer, Brand24, and Senuto. How the scoring works.
| WHAT EACH ONE DOES | POSTHOG | AMPLITUDE |
|---|---|---|
| Core job | All-in-one dev toolkit | Behavioral analytics |
| Query model | HogQL SQL, raw events | Menu-built charts |
| Experiment results | Free tier | Growth, quoted |
| Live experiments | No published cap | 1 on Free and Plus |
| Free session replay | 5k web, 2.5k mobile | 10,000 a month |
| Error tracking | 100k exceptions free | Not sold |
| In-app guides | Not sold | 1 live on Free/Plus |
| Attribution | Web analytics only | Campaign reporting |
| Self-hosting | MIT hobby deploy | Cloud only |
| AI training default | Opt-in on US cloud | AI partners barred |
| Skip it if | PMs won’t touch SQL | You need SSO unquoted |
| WHAT YOU GET | POSTHOG | AMPLITUDE |
|---|---|---|
| Free events | 1M a month | 2M a month |
| Billing unit | Anon vs identified | Events, MTU cap on Plus |
| 5M identified | $560 a month | $225 a month |
| 5M anonymous | $152.90 a month | $225 a month |
| Paid data retention | 7 years | 2 years on Plus |
| Enforced SSO | $250/mo, Boost | Growth, quoted |
| HIPAA BAA | $250/mo, Boost | Growth, quoted |
| Contract minimum | None, monthly | Growth via sales |
| Vendr median | $58,173, thin sample | $64,000, 422 deals |
| Owner | Private, $1.4B val. | Nasdaq: AMPL |
| G2 rating | 4.5 from 1,055 | 4.5 from 3,006 |
StrongerWeakerNo edge
Thirty-four further documented limits sit behind the button below: ingest and API rate limits, chart ranges, add-on rates and what each support tier buys. Test scenario: one product sending 5 million events a month, priced from Amplitude’s published Plus ladder and PostHog’s billing-API tiers. Vendr medians and G2 counts were read 17 October 2026, and every other figure is sourced in the section its row links to.
| PostHog | WHAT IT DOCUMENTS |
|---|---|
| Mobile replay, free | 2,500 recordings a month, then $0.01 to 15k |
| Group analytics add-on | $0.000071 an event from 1M to 2M |
| Data pipelines, free | 10K events + 1M rows a month |
| Realtime destinations | 10,000 trigger events free, then $0.0005 |
| Warehouse rows | 1M free, then $0.000015 to 10M |
| Historical warehouse sync | 100M rows free |
| Logs | 10 GB ingested free, 14-day retention |
| Custom log retention | $0.05 per GB a month retained |
| Workflows | 10K messages per channel free |
| AI Observability | 100K events free a month |
| Onboarding call | $80 for 30 minutes |
| Support by plan | Community on Free, email paid, Slack over $2k/mo |
| Priority support target | 24 hours on Scale, 8 hours on Enterprise |
| Activity log history | 7 days* Boost, 2 months Scale, 60 months Enterprise |
| Real-time alerts | 10 on Scale, 20 on Enterprise |
| Private API rate limits | 240/min and 1,200/hr analytics; query 2,400/hr |
| Per-user ingest spike | ~5,000 events/min per distinct ID before ordering drops |
| Amplitude | WHAT IT DOCUMENTS |
|---|---|
| Property value length | 1,024 characters, longer values truncated |
| Inline cohort lookback | 3-year range, 404 past it |
| Short chart ranges | Real-time 1 day, hourly 7 days |
| Funnel group-by | 300 values; Event Segmentation 10,000 |
| Data Tables with attribution | 20 group-by values |
| CSV export | ~10,000 breakdown rows; Microscope 1M users |
| Usage alerts | At 80%, 90%, 100% and 110% of volume |
| Agent sessions | 5,000 Free/Plus, 10,000 Growth, 20,000 Enterprise |
| Agent chat retention | 14 days Free/Plus, 30 Growth+, 90 as add-on |
| AI Feedback records | 2,000 a month on every plan |
| Saved charts | 10 per org on Free, unlimited from Plus |
| Spaces | 1 on Free, 3 on Plus |
| Zoning Insights | 50 zones, 5 overlays on Free and Plus |
| Support SLA | 2 business days Growth, 1 Enterprise |
| Real-time syncs | 50 AMPL-to-third-party, Growth add-on |
| Portfolio discount | 25%+ off Growth for a year, under $25M funding |
| Tech for Black Founders | Free Growth, under $30M and 150 staff, US |
*PostHog states this one two ways on its own domain. Its platform packages page puts activity logs on Boost at 7 days, while the comparison table in its PostHog vs Amplitude post places “History and audit logs” at Scale. The platform-packages figure is used above because it’s attached to a package a buyer can purchase, Boost at $250 a month.
Two rate cards, one vendor’s chart of the other, and the post-mortems behind the incident count
Every row above comes from a vendor property, read 17 October 2026.
- PostHog prices: posthog.com/pricing, the platform packages page and the billing API at billing.posthog.com.
- Amplitude prices and plan gates: amplitude.com/pricing, including the Plus ladder embedded in its “Annual Plus Plan Comparison” chart.
- Limits: Amplitude’s limits FAQ, PostHog’s API docs and its self-hosting docs.
- Vendor claims: amplitude.com/compare/posthog and PostHog’s comparison post, dated 27 January 2026.
- AI training: PostHog’s 27 May 2026 post and Amplitude’s AI privacy and security docs.
- Incidents: PostHog’s post-mortems page.
Amplitude’s financials come from its Q2 2026 8-K exhibit on sec.gov and PostHog’s funding from its Series D (9 June 2025) and Series E (29 September 2025) posts. Contract medians are Vendr header stats and review counts are G2’s own figures.
Neither vendor publishes a per-user event average. PostHog publishes no revenue or paying-customer count, and Amplitude publishes no Growth or Enterprise price.
To cut to the chase, PostHog vs Amplitude comes down to one billing switch. Both now meter event volume, both give away a free tier, and both bundle product analytics, session replay, feature flags, experiments and surveys. PostHog charges a different rate for anonymous and identified events, while Amplitude puts experiment results, SSO and data governance behind plan tiers.
This page prices both tools at the same monthly event volume from each vendor's own rate card, sets out what every plan gates, and checks the claims each vendor publishes about the other. It's for product managers, product teams, founders and engineering leads holding a shortlist of two product analytics platforms and a budget line to fill.
The stakes are bigger than the list price suggests. Amplitude publishes a chart on its own pricing page that prices PostHog at its most expensive configuration, and PostHog's own comparison page credits Amplitude with gaps Amplitude's current pricing page no longer shows. A buyer reading either vendor's page gets half the arithmetic.
↑ COMPARISONWhat PostHog and Amplitude are, and the key features both ship
PostHog is an open source, all-in-one developer toolkit. Its code is MIT licensed, its handbook and roadmap sit in public on GitHub, and its pricing page counts 600,000+ companies on the platform. Amplitude is a closed-source, cloud-only behavioral analytics platform, listed on Nasdaq as AMPL since a direct listing on 28 September 2021.
Is PostHog similar to Amplitude? On the product list, almost identical. Both vendors document these key features on their own pricing pages:
- Event analytics with funnels, user paths, retention analysis, lifecycle and stickiness charts
- Session replay for web and mobile apps, linked to the analytics charts
- Feature flags with percentage rollouts, cohort targeting and payloads
- Experiments for A/B/n tests on product and web
- In-app surveys, plus autocapture so a team can hit the ground running without a tracking plan
- Web analytics, data warehouse connections and an MCP server for AI tools
Both are product analytics tools first. Each records user interactions as event data, then sells funnels, user paths, cohort analysis and retention analysis on top, so product teams can understand user behavior from what users do inside the product.
The differences sit at the edges. PostHog sells error tracking (100,000 free exceptions a month), logs and a built-in data warehouse that Amplitude's pricing page carries no row for. Amplitude sells product tours and in-app guides, campaign reporting for marketing attribution, and Agent Analytics for LLM traces with 5,000 free agent sessions a month.
So the honest answer to "what is PostHog and Amplitude" is two vendors selling one feature list to two different buyers. PostHog's own pages call it a developer platform and recommend it to engineering led teams. Amplitude's compare page pitches deeper behavioral analytics, autonomous AI agents and marketing attribution, aimed at the product teams asking the questions. Each sells itself as the analytics tool for that buyer's user behavior questions.
↑ COMPARISONWhat each vendor says about the other, checked against its own pages
Both vendors publish a page attacking the other, and both pages contain checkable claims. Amplitude runs amplitude.com/compare/posthog plus a pricing chart on amplitude.com/pricing. PostHog runs posthog.com/blog/posthog-vs-amplitude, dated 27 January 2026. Each claim below is one vendor's marketing, set against the rival's own published page.
| Claim, and who makes it | What the other vendor's own page shows |
|---|---|
| Amplitude: PostHog has no free session replays | PostHog's free tier includes 5,000 web recordings and 2,500 mobile recordings a month |
| Amplitude: PostHog has no in-app guides and surveys | PostHog gives 1,500 free survey responses a month; its own comparison table marks product tours as absent |
| Amplitude: PostHog launched basic A/B testing in November 2025 | PostHog's Array 1.33.0 release notes announced an end-to-end A/B testing suite on 28 February 2022 |
| Amplitude: PostHog's free AI is capped at 2,000 credits, about $20 | PostHog's pricing page lists 500 PostHog AI credits a month, worth $5 |
| Amplitude: PostHog trains AI models on your data | PostHog's 27 May 2026 post confirms it: US cloud accounts are opted in by default from 29 June 2026, EU cloud accounts are opted out |
| Amplitude: nine PostHog reliability incidents since mid-2025 | PostHog's post-mortems page lists nine, dated 29 September 2025 to 27 April 2026 |
| PostHog: Amplitude has no LLM observability | Amplitude's pricing page sells Agent Analytics on every plan, with trace analysis and custom LLM evaluators |
| PostHog: Amplitude has no error tracking | Amplitude's pricing page carries no error tracking product, so this one holds |
| PostHog: most Amplitude experiment features need a paid plan | Amplitude's pricing table marks experiment results as not included on Free and Plus |
Amplitude's page lands two hits and misses four. The AI-training claim and the incident count are accurate, and both come straight from the horse's mouth: PostHog's own blog and post-mortems page. The replay, surveys, AI-credit and A/B launch-date claims are wrong on PostHog's own pricing page and changelog.
PostHog's page has aged. It's dated 27 January 2026 and prints an AI Observability gap for Amplitude that Amplitude's current pricing page no longer shows. Talk is cheap on both comparison pages, so the next section prices both tools from their rate cards. Our report on pricing errors in software answers tested how often AI tools repeat stale vendor claims like these.
↑ COMPARISONPricing at the same monthly event volume
Amplitude's pricing page carries a chart titled "Annual Plus Plan Comparison" that prices Amplitude, Mixpanel and PostHog from 1.5 million to 20 million events a month. The PostHog line in that chart matches PostHog's identified-events rate to the dollar, which makes it a useful check on both analytics platforms. That's PostHog's most expensive configuration for product analytics, and it's a fair one for a team that needs person profiles, cohorts and user properties.
The devil's in the details of the event type. PostHog prices two kinds of event. An anonymous event carries event properties and powers trends, funnels and SQL insights. An identified event attaches to a person profile, which unlocks cohorts, person-property filters, group analytics and lifecycle charts. The posthog-js SDK defaults to identified-only person profiles, so events stay anonymous until a team calls identify().
| Events a month | Amplitude Plus, billed annually | PostHog, anonymous events | PostHog, identified events |
|---|---|---|---|
| 1.5 million | $0 | $25 | $124 |
| 2 million | $0 | $50 | $248 |
| 3 million | $75 | $84.30 | $352 |
| 5 million | $225 | $152.90 | $560 |
| 10 million | $576 | $324.40 | $1,080 |
| 20 million | $1,260 | $643.40 | $1,927.50 |
Amplitude figures are its own published Plus ladder, divided to a monthly figure. PostHog figures are worked from the per-event tiers PostHog publishes through its billing API: the first 1 million events free, then $0.00005 an event to 2 million, $0.0000343 to 15 million and $0.0000295 to 50 million. The identified add-on adds $0.000198 an event from 1 to 2 million and $0.0000697 to 15 million. All rates were read on 17 October 2026.
Read the table two ways. With identified events, Amplitude is cheaper at every volume to 20 million, by $335 a month at 5 million events. With anonymous events, PostHog is cheaper from 5 million events up and costs $643.40 against $1,260 at 20 million. Below 3 million, Amplitude's 2 million event free tier wins outright.

Several comparison blogs ranking for this query quote PostHog at $200 to $400 a month for 5 million events. Both figures miss the mark against PostHog's rate card. The real figure is $152.90 with anonymous events or $560 with identified ones, and the gap between them is the identified-events add-on.
Both bills scale with what your users generate, which makes the tracking plan a pricing decision. Every autocaptured click counts toward the bill on both analytics platforms, and data volume grows with every new screen. Tracking additional events that nobody queries costs money on PostHog from the 1,000,001st event and on Amplitude from the 2,000,001st.
↑ COMPARISONMonthly tracked users, and where Amplitude's old pricing model survives
Amplitude's pricing model used to be monthly tracked users. Most comparison pages still say so, and Vendr's Amplitude page still describes MTU pricing in its prose. Amplitude's own pricing page now sells Growth and Enterprise on "event based pricing" and its FAQ says the Free plan measures usage by event volume.
MTUs survive as a ceiling. The Plus plan caps at 700,000 monthly tracked users or 70 million events, and Amplitude defines an MTU as a unique user who triggers one or more events in a calendar month. A product with predictable user counts & heavy instrumentation per user hits the event cap first; a consumer app with millions of light users hits the MTU cap first.
↑ COMPARISONContract data past the published tiers
Past Plus, Amplitude quotes. Vendr's header stats on 17 October 2026 put the median Amplitude contract at $64,000 a year across 422 purchases, ranging from $24,750 to $379,933, with 16% average savings. Vendr's PostHog page shows a $58,173 median, a $20,000 low and a $70,000 high, with no purchase count shown, so treat the PostHog figure as a thin sample.
PostHog publishes public pricing for every product, while Amplitude's public pricing stops at Plus. PostHog markets a generous free tier on each product and transparent pricing past it: there's no annual contract, no minimum spend, and a billing limit can be set per product, so a viral week can't produce an uncapped bill. PostHog says more than 90% of companies on it pay nothing.
Most analytics tools in this category meter the same unit, so the pricing model is the comparison. Both product analytics platforms charge for events; what differs is which events cost extra and which features sit behind paid plans.
↑ COMPARISONFeature flags, experiments and SSO: what each plan gates
The free tiers look similar until you try to read an experiment result. Feature flags are where the paid plans split first: Amplitude gives unlimited feature flags on every plan, but Free and Plus allow one active feature experiment and one active web experiment, and its pricing table marks experiment results as not included on either. A/B/n testing for feature experiments starts at Growth, which is custom-priced.
PostHog counts flag requests. Feature flags and experiments share 1 million free requests a month, then $0.0001 a request to 2 million and $0.000045 to 10 million, with no cap on concurrent experiments. A team that wants to implement feature flags across a product with 5 million monthly flag calls pays PostHog $235 a month for them.
| Capability | Lowest Amplitude plan that includes it | Lowest PostHog plan that includes it |
|---|---|---|
| Experiment results | Growth, quoted | Free |
| Concurrent experiments | 1 on Free and Plus, 2 on Growth | No published cap |
| Holdouts and mutual exclusion | Growth add-on | Free |
| Behavioral cohorts | Plus, 20 per organization | Free, on identified events |
| Projects | Unlimited per portfolio on Enterprise | 1 on Free, 6 on paid usage, unlimited on Boost |
| Enforced SSO | Growth, quoted | Boost, $250 a month |
| SAML | Growth, quoted | Scale, $750 a month |
| Role-based access control | Growth add-on, included on Enterprise | Enterprise, quoted |
| HIPAA BAA | Growth | Boost, $250 a month |
SSO carries the widest price gap in the table. A 30-person company that needs single sign-on can buy it from PostHog for a published $250 a month and can't buy it from Amplitude without a sales call, so teams that need it bite the bullet on a Growth quote.
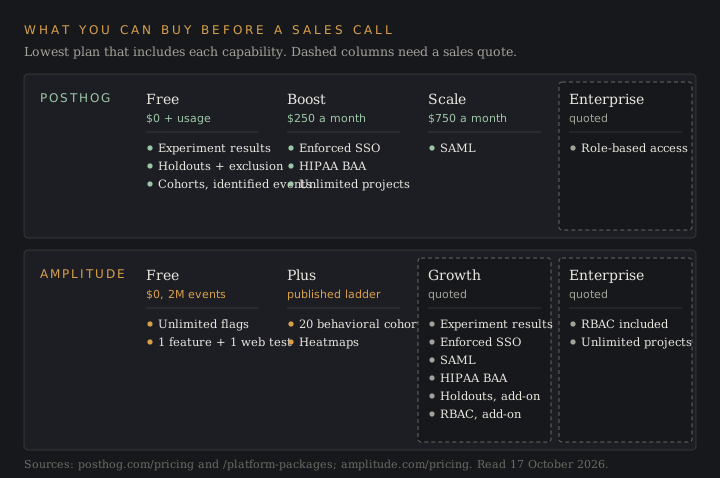
Amplitude's statistics are the trade: CUPED variance reduction, sequential testing and holdouts, multi-armed bandits as a Growth add-on, and Amplitude cites a Forrester ranking of its experimentation product as first in 2026.
↑ COMPARISONProduct analytics depth: SQL, cohorts, data warehouses and governance
PostHog's HogQL lets a technical user run SQL against raw event data. PostHog describes HogQL as a wrapper around ClickHouse SQL with simpler property access, and the SQL editor can query events, persons, sessions and groups, plus anything synced into its warehouse. That's the advanced analysis path for engineering led teams who'd otherwise export to a separate tool.
PostHog's built-in warehouse connects to external data warehouses and SaaS sources directly, so product data and billing data sit in one query. Its documented sources include Postgres, BigQuery, Redshift and HubSpot, with 1 million synced rows free and 100 million rows of historical sync free. Batch exports push PostHog data back out to S3, Snowflake and BigQuery, with 1 million exported rows free a month.
Amplitude imports from data warehouses on the other side. Its source catalog lists Snowflake, BigQuery and Databricks imports, plus Amazon S3, Google Cloud Storage and a Google Analytics 4 import, and Amplitude also sells a warehouse-native mode. PostHog's own comparison page notes the catch: an Amplitude project has to pick warehouse-native or event ingest, and mixing the two leans on Warehouse Metrics.
Data governance is where Amplitude's analytics depth shows. Protected schemas, derived properties and data mutability start at Growth, data access controls and SCIM sit on Enterprise, and every plan gets an AI Data Assistant and a taxonomy API. Amplitude's instrumentation limits are published: 2,000 event types, 2,000 event properties and 1,000 user properties per project.
Historical data reach differs too, and it decides how far back a cohort of behavioral data can look. Amplitude gives 1 year of data access on Free, 2 years on Plus and unlimited on Growth, and caps daily charts at 365 days and monthly charts at 36 months.
PostHog keeps events for 1 year on Free and 7 years on pay-as-you-go, though older historical data may move to cold storage where queries run slower. For segment-building beyond product analytics, see our customer segmentation tools ranking.
↑ COMPARISONWho each analytics tool is built for: technical users and product managers
PostHog is built for technical users. Its install path is a terminal command, npx @posthog/wizard, its support comes from the engineers who wrote the feature, and its docs assume a reader who knows the ropes of an SDK and a SQL editor. PostHog's own comparison page recommends Amplitude for marketing and growth teams wanting a UI for non technical users.
That's a rare concession from a vendor. PostHog's setup can feel complex for non-technical users because the product surface is wide: analytics, replay, flags, experiments, surveys, error tracking and logs all share one navigation, and the defaults favour the person who wrote the tracking code.
Amplitude is the product analytics tool product managers and marketers can drive without SQL. Charts build from menus, cohorts build from behavior, and Amplitude's AI agents sit on top of dashboards.
The cost sits upstream: Amplitude still needs an event taxonomy designed before it returns useful answers, so it requires more technical familiarity at setup than its UI suggests. Teams that jump the gun and instrument before naming events end up with duplicate event types against Amplitude's 2,000 cap.
The easiest way to read the split is by who owns the tracking plan. When engineers own it, PostHog fits the people instrumenting the product and asking the questions.
When a product team owns it and engineers hand over clean behavioral data once, Amplitude's interface gives product teams self serve analysis on top of it. Product managers then read feature adoption, feature usage and user journeys without filing a ticket, and watch how users interact with a new flow the week it ships.
That split shows up in who the vendors sell to. Amplitude's G2 quote on its own compare page praises a user-friendly interface, and PostHog's comparison page sends non-technical users to Amplitude. A product team where every engineer writes SQL gets more from PostHog's HogQL, and product teams run by product managers get more from Amplitude's chart builder.
↑ COMPARISONSession replay, surveys, error tracking and the rest of the bundle
Session replay is metered differently on each side. Amplitude includes 10,000 monthly sessions on Free and Plus, 20,000 on Growth and 50,000 on Enterprise, with 1 month of replay retention on every plan and extended retention of 3 to 12 months as a Growth add-on. Amplitude launched Session Replay into general availability on 7 February 2024.
PostHog gives 5,000 web recordings and 2,500 mobile recordings free, then charges $0.005 a recording to 15,000 and $0.0035 to 50,000. Retention runs 1 month on Free, 90 days on the paid usage plan, 12 months on Boost and Scale, and 60 months on Enterprise. At 20,000 monthly recordings PostHog costs $67.50 a month; on Amplitude that volume needs the Growth plan.
On both, session replay shares the event stream with product analytics, so a replay opens from the chart point that flagged it. Product teams use that link to check feature adoption on a new screen, which kills two birds with one stone: the number and the reason sit one click apart.
Both replays let you watch actual user sessions next to the chart that flagged them, so you can see real user sessions where users drop out of a funnel. PostHog's session replay adds a DOM explorer, network and performance panels, and recording controls tied to feature flags, which serve developer debugging and show how users interact with a feature before and after a flag flips.
Amplitude's session replay adds heatmaps on Plus and AI-generated session summaries as a Growth add-on.
Surveys add qualitative data to the event stream. User surveys capture the reason behind a drop-off, which gives qualitative insights a funnel can't, and both vendors target them at user segments built from behavior. The rest of the bundle splits by buyer:
- Surveys: PostHog includes 1,500 responses a month free, then $0.10 a response to 2,000 and $0.035 to 10,000; Amplitude allows one live guide or survey on Free and Plus
- Error tracking: PostHog includes 100,000 exceptions a month free; Amplitude sells none
- In-app messaging: Amplitude sells guides, tours and a resource center for feature adoption campaigns, built on its 2024 Command AI acquisition; PostHog's own table marks product tours as absent
- Marketing analytics: Amplitude includes campaign reporting with two channel views on Free and Plus; PostHog runs web analytics and a revenue analytics beta
On attribution the two vendors agree. Amplitude's compare page says most PostHog teams also run Google Analytics for attribution, and PostHog's own page recommends Amplitude for campaign attribution. Survey-heavy teams can price both against dedicated tools in our survey software pricing report.
Reliability incidents at both analytics platforms, and who publishes them
PostHog publishes a public post-mortem for any incident that loses customer data, breaks customer sites or keeps PostHog down for hours. Its page lists nine since September 2025: three feature-flag incidents, two SDK bugs in surveys and replay, the Shai-Hulud supply chain attack, a persons database migration, a workflows failure and a logs data loss. That's the record Amplitude's compare page quotes back at it.
Two of those incidents deserve detail. On 19 February 2026 a ClickHouse zero-copy replication bug deleted Logs data older than 3 days in PostHog's US region over about 8.5 hours, and PostHog's own post-mortem calls the older data most likely unrecoverable. PostHog states every other product's data was intact.
On 24 November 2025, malicious versions of posthog-js, posthog-node and posthog-react-native were published to npm as part of the Shai-Hulud 2.0 worm, after a stolen GitHub token exfiltrated PostHog's npm publishing secret. PostHog deleted the packages and revoked the tokens 5 hours and 19 minutes later. It now publishes through npm's trusted publisher model and pnpm 10, which blocks install scripts by default.
The fairness note matters here. PostHog's count looks bad partly because PostHog writes its incidents up in public with root causes. Amplitude's status page logs its own: our Hotjar vs Amplitude comparison counted 283 Amplitude incidents since April 2020 when it read the page in August 2026. PostHog runs its status page at posthogstatus.com with separate US and EU environments, so uptime can be checked on both sides by the same method.
↑ COMPARISONOwnership: a listed company and a $1.4 billion private one
Amplitude's finances are public. Its Q2 2026 results, filed with the SEC on 5 August 2026, show revenue of $100.9 million, up 21% year over year, and ARR of $410 million, up 22%. Customers paying $100,000 or more reached 824, against more than 5,200 paying customers overall, and full-year 2026 revenue guidance runs $407.2 million to $411.2 million.
The same filing shows a GAAP net loss of $34.6 million for the quarter and $23.7 million of free cash flow. Amplitude's ARR included $17 million from integrating Statsig, the experimentation vendor OpenAI acquired in September 2025. Amplitude cut 99 roles, 13% of its workforce, in April 2023.
PostHog's numbers are what it chooses to publish. It raised a $70 million Series D led by Stripe at a $920 million valuation on 9 June 2025, then a $75 million Series E led by Peak XV Partners at $1.4 billion on 29 September 2025. It publishes no revenue figure, so a buyer can check Amplitude's going-concern position from SEC filings and PostHog's only from its funding posts.
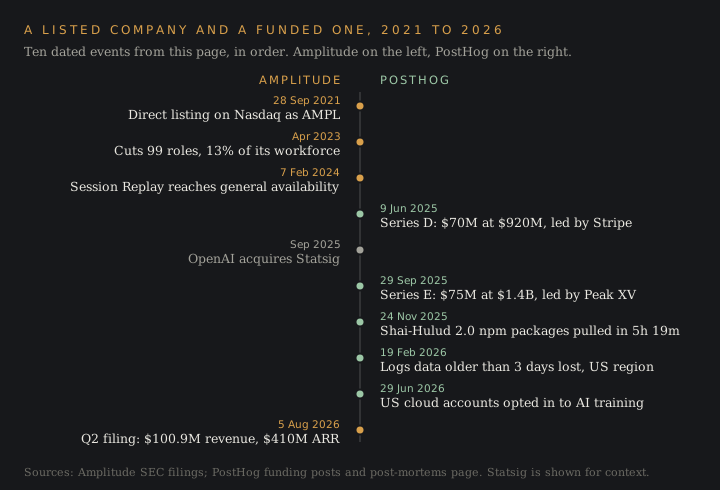
Is Amplitude a good company to work for? Employer reviews sit on third-party sites, so this page rates neither vendor as an employer. The checkable record is Amplitude's 2023 layoff and its quarterly SEC disclosure, while PostHog keeps its culture and strategy in a public handbook.
↑ COMPARISONData control: self-hosting, AI training and where data lives
PostHog suits teams needing control over data and customization. Its hobby deploy runs the open source product under MIT licence on a single Linux VM of roughly 4 vCPU, 16 GB RAM and 30 GB of storage. The catch is written into the docs: no customer support for self-hosted instances, all paid-plan features are Cloud-only, and new Kubernetes deployments of the paid self-hosted product are no longer supported.
Amplitude sells cloud only, on AWS in the US or EU, with residency fixed per organization and an EU data center option on every plan. PostHog offers US and EU cloud too. Both list SOC 2 Type II and GDPR readiness on PostHog's comparison table, and Amplitude adds ISO 27001.
The AI-training row is a real difference in October 2026. PostHog's 27 May 2026 post says US cloud accounts are opted in to model training on their PostHog data from 29 June 2026, with an admin opt-out in organization settings, and accounts under a BAA or MSA that forbids it are excluded. EU cloud accounts are opted out by default. Amplitude's contracts with its LLM providers bar them from training on customer data.
A team on PostHog's US cloud that hasn't checked that setting has its data eligible for training, anonymized first by PostHog's account. Keep an eye on the toggle after any admin change.
↑ COMPARISONWhat it costs to leave either one
Leaving PostHog is cheap by design. There's no annual contract to wait out, batch exports send raw data to S3, Snowflake or BigQuery at $0.000015 a row past the first million, and the open source code means the event schema is public. The cost is the instrumentation: flags, experiments, surveys and replays all run through one SDK, so a team that put all its eggs in one basket goes back to square one on four or five products at once.
Amplitude's exit runs through its Export API, which caps each request at 4 GB and a 365-day range, so a five-year history comes out in at least five pulls. Growth and Enterprise customers leave on contract terms they negotiated, and Vendr reports its $64,000 median as an annual contract value.
Free accounts carry their own exit clause. Amplitude's limits page says a non-paying account that exceeds its monthly event limit three times gets blocked, and a blocked account that doesn't upgrade is deleted six months after the first block. PostHog's free plan stops collecting at the free limits and resets the next month. Amplitude's clause is a red flag for any team parked on Free with a traffic spike coming.
Mixpanel, Statsig and Google Analytics: the Amplitude alternatives teams shortlist
Who are Amplitude competitors? Amplitude's own footer lists compare pages for Fullstory, Heap, LaunchDarkly, Mixpanel, Optimizely, Pendo and PostHog, and Amplitude's own pricing chart adds Mixpanel as the third line to its PostHog vs Amplitude math.
Mixpanel's free tier covers 1 million events a month. Its funnels and user journeys reports cover the same user interactions as the two tools here. Comparison sites ranking for this query rate Mixpanel more intuitive for non-technical users than Amplitude, and say non technical teams can analyze data there without SQL; our Hotjar vs Mixpanel comparison covers its pricing in full.
Amplitude's own pricing chart prices Mixpanel at $5,250 a year for 5 million monthly events against Amplitude's $2,700. That's one vendor's marketing about a third, and Mixpanel's Growth plan prices by monthly tracked users in its calculator, so check the quote before trusting either chart.
Statsig changed the experimentation shortlist. OpenAI bought it in September 2025 and Amplitude took on the Statsig platform and customers in 2026, which is why "Amplitude Statsig" now shows up in searches for this pair.
Google Analytics covers acquisition reporting in these stacks. Amplitude's compare page says most PostHog teams end up running Google Analytics alongside it for multi-touch attribution, and PostHog's own FAQ carries a question on replacing Google Analytics. The common setup runs Google Analytics for traffic and one of these two for product questions, the split our Google Analytics vs Hotjar comparison draws for session tools.
↑ COMPARISONAmplitude Analytics and PostHog review scores, with sample sizes
G2 lists Amplitude Analytics at 4.5 out of 5 from 3,006 reviews and PostHog at 4.5 out of 5 from 1,055 reviews, both read on 17 October 2026. The stars put them on a level playing field, and Amplitude's sample is nearly three times larger. Amplitude's compare page claims G2's number-one rating for 24 quarters running, a claim about G2's category grid with no review count attached.
The paying bases differ as much as the review counts. Amplitude reports more than 5,200 paying customers in its SEC filing. PostHog publishes no paying-customer count and says more than 90% of companies on it use the free tier.
Which is the best product analytics tool for which team
Read as Amplitude vs PostHog or the other way round, the best product analytics tool depends on who writes the queries, and both vendors' own pages concede the same split. The figures above sort most teams in one pass.
Buy PostHog if engineers drive product decisions, if you want error tracking and replay debugging in the same SDK as your feature flags, or if you can run on anonymous events past 5 million a month, where PostHog costs $152.90 against Amplitude's $225. Its transparent pricing lets you model the bill for every product before you sign, and SSO costs a published $250 a month. Check the US cloud AI-training toggle on day one.
Buy Amplitude if product managers and marketers own the analysis and need behavioral data on user behavior without SQL, if you need cohorts on identified users, where Amplitude Plus undercuts PostHog at every published tier to 20 million events, or if experiment statistics and marketing attribution decide the purchase. Budget for Growth the moment you need experiment results or SSO, because both sit behind a quote that lands at a $64,000 median on Vendr.
Teams still on the fence, early stage companies in particular, should price both startup programs first. Amplitude gives a free year of Growth, including its advanced analytics and experimentation, to companies under $10 million in funding with fewer than 20 employees, and PostHog gives $50,000 in credit to companies that qualify for its startup program.
For the wider field, our customer analytics tools ranking scores PostHog, Amplitude, Mixpanel and seven other analytics tools on free-tier caps, retention windows and contract medians. The web analytics pricing report sets both rate cards against 15 other tools, and every head-to-head on the site sits in the comparisons hub.
PostHog vs Amplitude questions
Is PostHog cheaper than Amplitude?
It depends on the event type. With anonymous events PostHog is cheaper from 5 million monthly events up; with identified events Amplitude Plus is cheaper at every volume Amplitude publishes, up to 20 million.
Does PostHog have a free plan?
Yes. PostHog's free plan includes 1 million analytics events, 5,000 recordings, 1 million feature flag requests, 1,500 survey responses and 100,000 exceptions a month, with unlimited team members and no card. Amplitude's generous free tier includes 2 million events, 10,000 replays and unlimited feature flags.
How many events will my product send?
Count them on a free tier first. Both platforms show live event counts, and both bills follow how many events your users generate once autocapture is on.
Can PostHog replace Amplitude?
For analytics, flags, experiments, replay and surveys, yes. For in-app guides and campaign attribution, PostHog's own comparison page recommends Amplitude.
Which is the best product analytics tool for a startup?
On core analytics, either one runs free at low volume: Amplitude to 2 million events, PostHog to 1 million plus replay, flags and surveys. Pick the analytics tool whose paid plans you can afford at ten times today's traffic, and make data driven decisions about customer behavior from the free tier before signing anything.
Which tool has better data retention?
PostHog keeps events 7 years on pay-as-you-go against Amplitude's 2 years on Plus. Amplitude's Growth and Enterprise plans carry unlimited data access, on a quoted contract.
Do PostHog and Amplitude integrate with other data tools?
Both connect to Segment, Slack and Microsoft Teams and export product analytics data to data warehouses such as Snowflake and BigQuery, per PostHog's integrations table. Teams that want one data layer feeding both can compare the options in our customer data platform pricing report.
Sources: posthog.com/pricing, posthog.com/platform-packages and PostHog’s billing API; posthog.com/blog/posthog-vs-amplitude (27 January 2026); posthog.com/handbook/company/post-mortems; amplitude.com/pricing; amplitude.com/compare/posthog; amplitude.com/docs/faq/limits; Amplitude’s Q2 2026 8-K on sec.gov; vendr.com/marketplace/amplitude and /posthog; G2 listings for both products. Accessed 17 October 2026.