Customer analytics tools: the 10 worth paying for in 2026
 By Jan Suski. I go deep on every review, checking every number against its source and digging up details other coverage misses, a habit from six years of SEO and link building for tech companies. Bylines at Surfer, Brand24, and Senuto. How the scoring works.
Quick comparison of customer analytics tools
Ten tools ranked on five testable criteria: published starting price, free-tier volume cap, data retention window, native session replay or heatmaps, and Vendr median annual contract where no price is published. Every figure below traces to the vendor's own pricing page or docs, or to Vendr's anonymized buyer data, pulled in October 2026.
| # | Provider | Coverage figure | Entry price | Best fit |
|---|---|---|---|---|
| 1 | PostHog | 1,000,000 events/mo free + 5,000 replays | Free; usage-based from $0 | One tool for analytics, replay and feature flags |
| 2 | Amplitude | 2,000,000 events/mo free | Free; Plus self-serve | Deep behavioral analytics at scale |
| 3 | Mixpanel | 1,000,000 events/mo free | Free; Growth from ~$120/mo | Fast setup for product and growth teams |
| 4 | Hotjar | 200,000 sessions/mo free | Free; Growth $40/mo | Heatmaps and replay with no data team |
| 5 | Google Analytics | No published event ceiling | Free | Baseline traffic analytics for any site |
| 6 | Heap | 10,000 sessions/mo free | Quoted; $41,220/yr median* | Autocapture, no manual event tagging |
| 7 | FullStory | 30,000 sessions/mo free | Quoted; $28,240/yr median* | Highest-fidelity session replay |
| 8 | Contentsquare | No published free tier | Quoted; $48,500/yr median* | Enterprise digital experience teams |
| 9 | Adobe Analytics | No published free tier | Quoted; $63,796/yr median* | Enterprises already on Adobe Experience Cloud |
| 10 | Pendo | 500 monthly active users free | Free; paid tiers quoted | In-app guides over raw analytics depth |
Medians marked * are anonymized buyer-reported contract values published by Vendr. Everything else is the price the vendor publishes itself.
Where these figures come from
Free-tier caps and self-serve prices are each vendor's own published pricing page, read in October 2026. Medians marked * are Vendr's anonymized buyer-reported contract values from Heap, FullStory, Contentsquare and Adobe Analytics' Vendr pages.
Pendo publishes no self-serve price past its free tier, and this research pass found no Vendr contract data for it either. Its row carries no number past "quoted," a gap this page names plainly, with no invented figure standing in for it.
A customer analytics tool turns raw clicks, page views and app events into something a product or growth team can act on: a funnel that shows where users drop, a cohort that shows who's about to churn, a replay that shows exactly where a signup form broke.
This page ranks the behavioral and digital-experience platforms that do that job. Customer data platforms that only warehouse the data, and customer intelligence tools built for account scoring on the sales side, sit outside its scope.
Ten tools made the cut: Amplitude, Mixpanel, PostHog, Hotjar, Google Analytics, Heap, FullStory, Contentsquare, Adobe Analytics and Pendo. Each one gets ranked against five testable criteria, scored against a published number every time, and every price and limit below traces to the vendor's own pricing page or docs, pulled in October 2026.
Customer analytics as a category splits into three buying motions. Product teams want event-level behavioral customer analytics (Amplitude, Mixpanel, PostHog, Heap). Marketing and UX teams want to watch sessions and heatmaps (Hotjar, FullStory, Contentsquare). Everyone else just needs free traffic numbers, which is what keeps Google Analytics running on nearly every site despite its shallow behavioral depth.
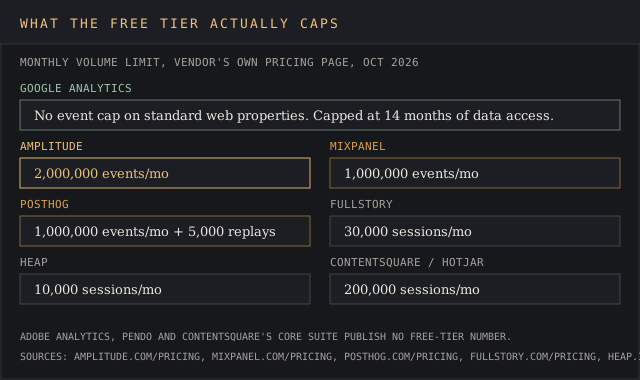
Evaluation criteria for customer analytics tools
Five criteria decide the shortlist, and the ranking below applies them in this order.

Published starting price
A tool passes this test only when its own pricing page states a dollar figure a buyer can act on without a sales call. Amplitude, Mixpanel, PostHog and Hotjar all clear it. Heap, FullStory, Contentsquare, Adobe Analytics and Pendo's paid tiers don't, and get scored against their Vendr median instead.
Free-tier volume cap
Every free plan caps something: events, sessions or monthly active users. The number on each vendor's pricing page is the one used here, no exceptions for marketing copy that says "unlimited."
Data retention window
How many days of raw data a buyer can query on the entry paid tier, stated in the vendor's own docs or pricing page. A platform that quietly drops event history after 30 days fails a cohort analysis before the contract is even signed.
Native session replay or heatmaps
Built into the core product from day one, never bolted on from an acquired company and sold as a separate line item. Google Analytics and Mixpanel fail this one outright; the rest ship it natively, even if it's gated to a paid tier.
Vendr median annual contract
For the five tools here that quote enterprise pricing only on request, Vendr's anonymized buyer data is the only public figure that exists. It's a median built from real purchases, a different figure from a list price, and it's the tiebreaker for every tool this ranking can't otherwise price.
Looking for the sales-side equivalent of these five criteria, scored against account scoring and CRM write-back, a different axis from event volume. See the customer intelligence platforms ranking. For the qualitative, survey-and-ticket side of the same buying motion, see customer feedback analysis tools.
The 10 best customer analytics tools, ranked
PostHog
Best fit
Teams that want analytics, session replay and feature flags under a single bill covering all three.
PostHog's free plan covers 1,000,000 events a month plus 5,000 session recordings, reset monthly, with no credit card required and unlimited team members on one project (posthog.com/pricing). It's open source end to end, so a team that wants to self-host its own customer analytics instance can inspect and run the whole stack directly.
Past the free tier, PostHog switches to pay-as-you-go pricing with no plan tiers to negotiate, and its data retention jumps to 2,555 days (seven years) on that tier against 365 days on the free plan. Session recordings get 90 days of retention on pay-as-you-go, up from 30 on free.
Key features
- Product analytics with SQL-backed insights (HogQL) and no row sampling.
- Session replay, 5,000 recordings free monthly, 90-day retention on paid usage.
- Feature flags and A/B testing built into the same billing.
- Surveys with a 1,500 free response allowance a month.
- Self-hosted deployment option, since the full product is open source.
Pricing
Free up to the monthly caps above, then usage-based with no minimum spend. Slack-based support only kicks in above $2,000 a month, and SSO, audit logs and custom roles sit behind a separate platform package quoted on request (posthog.com/pricing).
Pros
- Open source end to end, which makes self-hosting a real, runnable option.
- One contract covers analytics, replay and flags together, replacing three separate vendor bills.
- Seven-year retention on the pay-as-you-go tier beats everything else here.
Cons
- The combined toolset has a steeper learning curve than a single-purpose tool.
- SSO and enterprise governance features cost extra and aren't published.
- Usage-based billing can swing month to month in a way flat tiers don't.
"PostHog feels like a genuinely 'all-in-one' product: analytics, session replay, and feature flag management."
Verified User, small business, G2 review
Why it's ranked #1. PostHog's pay-as-you-go tier retains raw data for 2,555 days against Amplitude's 730 on the Plus plan, the gap that keeps PostHog first even though Amplitude's single-month free cap runs higher.
Amplitude
Best fit
Product teams running cohort and funnel analysis at a scale that outgrows a lighter tool.
Amplitude's free plan covers 2,000,000 events a month, the largest published free-tier cap in this ranking, with 365 days of data access (amplitude.com/pricing). The Plus tier scales to 700,000 monthly tracked users or 70,000,000 events a month and stretches retention to 730 days.
Growth and Enterprise tiers are quoted, and Vendr's buyer data puts the median Amplitude contract at $64,000 a year across 421 recorded purchases, ranging from $24,750 to $382,219 (vendr.com).
Key features
- Behavioral cohorts and multi-step funnel analysis.
- Amplitude Experiment for A/B and multivariate testing.
- Session replay, capped at 30 days of retention on every tier.
- Data governance and taxonomy tooling for event naming consistency.
- Warehouse-native ingestion for teams already on Snowflake or BigQuery.
Pricing
Free to 2,000,000 events; Plus runs self-serve on a pay-as-you-go basis; Growth and Enterprise are quoted, landing at a $64,000 median annual contract per Vendr's 421-purchase sample.
Pros
- 2,000,000 free monthly events, roughly double Mixpanel and PostHog's free caps.
- 730-day retention on Plus, double the free tier's 365 days.
- Cohort and behavioral tooling built specifically for product teams' workflows.
Cons
- G2 reviewers flag "high price" and that it gets expensive at scale.
- Session replay stays capped at 30 days regardless of plan.
- Feature access is gated hard by plan tier past the free level.
"Intuitive dashboards and deep insights drive smarter decisions," but it "gets expensive at scale."
Krishna J., small business, G2 review
Why it's ranked #2. Amplitude's free tier allows 2,000,000 events a month against Mixpanel's 1,000,000, enough to edge past it at #3, but PostHog's 2,555-day retention on its pay-as-you-go tier still beats Amplitude's 730 days.
Mixpanel
Best fit
Growth and product teams that want a working dashboard the same day, without hiring a dedicated analytics engineer.
Mixpanel's free plan covers 1,000,000 events a month with 30 days of session-replay retention (mixpanel.com/pricing). The Growth tier starts near $120 a month billed yearly, or $140 billed monthly, at an example volume of 18,000,000 events a year, scaling up to 20,000,000 events a month before Enterprise pricing kicks in.
Enterprise customers can negotiate custom data retention from 7 to 365 days, and early-stage startups under five years old with $8,000,000 or less in total funding get a free first year on the Growth plan.
Key features
- Funnel and retention reports built around user-level event data.
- Group analytics that roll user-level events up to account-level metrics.
- Mixpanel Boards for sharing dashboards without a seat for every viewer.
- Warehouse connectors for Snowflake and BigQuery.
- Startup program: a free first year under the funding and age limits above.
Pricing
Free to 1,000,000 events; Growth from roughly $120 to $140 a month at the 18M-events-a-year tier; Enterprise custom, with negotiable retention.
Pros
- Described as "super easy to use" to set up and get dashboards running.
- Published self-serve pricing all the way to the 20,000,000-event tier.
- A free first year for qualifying startups.
Cons
- Reviewers note it can be complex to set up, especially for custom events.
- Session replay is an add-on here, absent from the core product.
- Enterprise retention and pricing both require a sales negotiation; neither has a public page.
"Super easy to use. Easy to implement and set up dashboards. Really helps us keeping track of our data."
David S., small business, G2 review
Why it's ranked #3. Mixpanel's free plan covers 1,000,000 events a month, five times Hotjar's 200,000-session cap, which holds it at #3 even as Amplitude's 2,000,000-event free tier keeps the two spots above out of reach.
Hotjar
Best fit
Marketing and UX teams that want heatmaps and session replay running the same afternoon, with no data warehouse involved.
Hotjar now prices through its parent company's own page: Contentsquare acquired Hotjar, and hotjar.com/pricing now redirects straight to contentsquare.com/pricing. Hotjar's free plan covers 200,000 sessions a month with one month of data access (contentsquare.com/pricing).
The Growth tier runs $40 a month, discounted from $49, scaling across session tiers from 7,000 to 240,000-plus monthly sessions, and extends data access to 13 months with 3 projects included. Every new Growth account gets a 15-day trial with no card required and a 30-day money-back guarantee.
Key features
- Heatmaps across click, scroll and move data.
- Session recordings with filtering by device, country or custom event.
- Funnels and form analysis for drop-off diagnosis.
- On-page feedback widgets and surveys for tracking customer satisfaction.
- Highlight reels for sharing specific session clips with a team.
Pricing
Free to 200,000 sessions a month; Growth at $40 a month with a 15-day trial; Pro and Enterprise stay quoted through sales, with no published figure.
Pros
- Heatmaps give "a clear overview of user interaction," per reviewers.
- 200,000 free monthly sessions, the largest free cap of any heatmap-first tool here.
- No card required for the 15-day Growth trial, and a 30-day money-back window after.
Cons
- Session recording limits "can be restrictive" once the quota's hit, per one reviewer.
- Data access on the free tier drops to one month.
- Pro and Enterprise pricing isn't published anywhere on the site.
"Hotjar gives me a clear overview of user interaction through heatmaps, whether people are browsing on mobile or desktop."
Verified User, enterprise, G2 review
Why it's ranked #4. Hotjar ships heatmaps and session replay natively, a capability Google Analytics doesn't offer at any tier, which keeps it ahead of GA4 at #5, though its 200,000-session free cap trails Mixpanel's 1,000,000 events at #3. See the full Hotjar vs Mixpanel comparison for how session replay closes part of that gap.
Google Analytics
Best fit
Any site or app that needs free, baseline traffic and conversion numbers before paying for anything deeper.
GA4's standard web properties carry no published event-volume ceiling, a figure that still beats every paid tier in this ranking on raw headroom. Data retention tops out at 14 months, selectable at either 2 or 14 months, and large or XL properties get capped back down to 2 months regardless of the setting (support.google.com).
Underneath that headline number sit real limits: BigQuery's daily export caps at 1,000,000 events (streaming export is unlimited), Explorations sampling caps a single query at 10,000,000 events, and each event is capped at 25 parameters. GA4 360, the enterprise tier, is quoted through Google sales with no public price.
Key features
- Real-time reporting, alongside standard and custom reports.
- Audience segmentation and ad-hoc Explorations.
- BigQuery export, daily batch or unlimited streaming.
- Data-driven attribution modeling, set as the GA4 default.
- Predictive metrics built from customer behavior data, including purchase and churn probability, on eligible properties.
Pricing
Free for standard GA4; GA4 360 is quoted only through Google sales, with no number published anywhere in this research.
Pros
- No published event ceiling on standard properties, ahead of any paid competitor's cap.
- Deep integration with Google Ads for attribution.
- Zero cost, which is why it still sits on most of the web.
Cons
- The free version "does not show all data," since it's sampled, per one reviewer.
- The GA4 migration itself "discouraged many people" from using the tool, per another.
- No native session replay or heatmaps at any tier.
"This change in Google Analytics 4 has discouraged many people in my organization from using the tool."
Verified User, project manager, TrustRadius review, March 2025
Why it's ranked #5. Standard GA4 properties carry no published event ceiling, well past Heap's 10,000 free sessions a month, which keeps Google Analytics at #5, but it still ships no native session replay the way Hotjar does one spot up.
Heap
Best fit
Teams that want every click, tap and form submission captured automatically, with no engineer tagging events by hand.
Heap's free plan covers 10,000 sessions a month with roughly six months of data retention; a session on web ends after 30 minutes of inactivity, or five minutes on mobile (heap.io/pricing). Exceeding the monthly cap doesn't drop data; it locks the ability to view it until the account upgrades.
Heap's Pro tier holds a year of retention by default, with an add-on that stretches it to three years (1,095 days). Vendr's buyer data puts the median Heap contract at $41,220 a year across 191 purchases, from $13,000 to $154,798 (vendr.com).
Key features
- Autocapture: every customer interaction tracked from install, no manual event definitions.
- Session Replay, included on Pro and Premier tiers.
- Heap Illuminate for pre-built conversion and adoption insights.
- Journeys and funnel analysis built on captured interaction data.
- Data warehouse sync for teams piping events into their own stack.
Pricing
Free to 10,000 sessions a month; Growth, Pro and Premier are session-priced and quoted on request, landing at a $41,220 median annual contract per Vendr.
Pros
- Autocapture is called "its strongest feature," with nothing to manually instrument.
- Hitting the free cap doesn't delete data, only locks the view until upgrade.
- Three-year retention add-on on Pro, longer than most tools here offer by default.
Cons
- "The sessions feature is very buggy at the moment," per one enterprise reviewer.
- Free tier caps at 10,000 sessions, the second-tightest in this ranking.
- No published self-serve price past the free plan.
"The sessions feature is very buggy at the moment it seems and can be quite slow."
Milos D., enterprise, G2 review
Why it's ranked #6. Heap's Pro add-on stretches retention to 1,095 days, three times FullStory's 365-day free window, which earns it the #6 spot, though GA4's uncapped event volume at #5 still beats Heap's 10,000-session free cap.
FullStory
Best fit
Teams whose top priority is watching exactly what a frustrated user did, frame by frame, well past a simple event count.
FullStory's free plan is permanent, not a time-limited trial: 30,000 sessions a month, up to 10 users, no credit card, with 12 months of analytics retention (fullstory.com/pricing). That free cap is three times Heap's and more than six times Google Analytics' explorations-sampling ceiling per query.
Paid tiers are quoted only through sales. Vendr's buyer data puts the median FullStory contract at $28,240 a year across 455 purchases, from $10,000 to $115,936, the cheapest Vendr median of any "contact sales" tool in this ranking (vendr.com).
Key features
- DOM-accurate session replay, pixel-for-pixel playback of a real user session.
- Heatmaps and click maps layered on top of replay data.
- Funnels for drop-off diagnosis across a defined flow.
- Frustration signals: rage clicks, error clicks and dead clicks flagged automatically.
- Slack and Jira alerting tied to specific session events, plus a Data Export API.
Pricing
Free to 30,000 sessions a month, permanently, for up to 10 users; paid tiers quoted, landing at a $28,240 median annual contract per Vendr.
Pros
- Praised for "powerful session replays and Slack alerts" for faster UX-issue response.
- 30,000 free monthly sessions, the largest free cap of the three "contact sales" tools here.
- Cheapest Vendr median of Heap, Contentsquare and Adobe Analytics.
Cons
- One reviewer "can't go back further in time to review older metrics."
- No published self-serve price past the free tier.
- 12-month retention trails Heap's three-year add-on and PostHog's seven-year tier.
"I can't go back further in time to review older metrics, which makes it harder to check historical performance."
Verified User, mid-market, G2 review
Why it's ranked #7. FullStory's Vendr median of $28,240 a year runs well under Contentsquare's $48,500, the gap that holds its #7 spot, but its 365-day free retention still trails the 1,095 days Heap's Pro add-on reaches one spot up.
Contentsquare
Best fit
Enterprise digital-experience teams running customer experience research across a large site, with budget for a dedicated analytics program.
Contentsquare's core platform publishes no free tier and no self-serve price; every plan is quoted through sales (contentsquare.com/pricing, which covers the Hotjar product it also owns, but not the enterprise Contentsquare suite itself). Vendr's buyer data puts the median contract at $48,500 a year across 586 purchases, from $18,525 to $150,983 (vendr.com).
That 586-purchase sample is the second-largest in this ranking after Adobe Analytics, which says something about how many enterprise contracts Vendr has tracked for a platform that publishes no list price at all.
Key features
- Zone-based heatmaps that aggregate interaction by page component, a coarser unit than raw pixel data.
- Session replay across web and mobile.
- Merchandising and conversion analysis built for ecommerce catalogs.
- Experience Analytics, which scores frustration and struggle signals automatically.
- Journey analysis across multi-session paths, plus Voice of Customer surveys.
Pricing
No published tier; quoted only, landing at a $48,500 median annual contract per Vendr's 586-purchase sample.
Pros
- Zone-based heatmaps called "invaluable" for aggregating metrics by component.
- Second-largest Vendr purchase sample in this ranking, at 586 recorded contracts.
- Owns both Hotjar and Heap, giving a self-serve on-ramp into the same company.
Cons
- Called "quite a pricey option" by a senior product manager who lost budget approval over it.
- No free tier or published starting price for the core enterprise suite.
- $48,500 median sits above both FullStory and Heap's Vendr medians.
"Contentsquare is quite a pricey option, which affected our ability to get budget approval in a previous role."
Tony H., senior product manager, enterprise, G2 review, March 2026
Why it's ranked #8. Contentsquare's Vendr median of $48,500 a year still undercuts Adobe Analytics' $63,796, enough to hold #8, though it can't match FullStory's cheaper $28,240 median one spot up at #7.
Adobe Analytics
Best fit
Large enterprises already standardized on Adobe Experience Cloud that need custom-schema reporting across channels.
Adobe Analytics publishes no pricing and no free tier anywhere on its site; every quote runs through Adobe sales (business.adobe.com). Vendr's buyer data is the only public figure that exists: a $63,796 median annual contract across 725 recorded purchases, the largest purchase sample of any tool in this ranking, ranging from $8,412 to $232,591 (vendr.com).
That 725-purchase sample, nearly 25% larger than Contentsquare's and almost double FullStory's, points to how many enterprise contracts run through Adobe without a single published number to anchor negotiation.
Key features
- Analysis Workspace for custom-schema, drag-and-drop reporting.
- Attribution IQ for multi-touch, cross-channel attribution modeling.
- Automated anomaly detection on key metrics.
- Data Feeds for raw-row export into a warehouse or clean room.
- Customer Journey Analytics, plus native integration with Adobe Experience Platform.
Pricing
Quoted only, with no free tier; Vendr's 725-purchase sample puts the median at $63,796 a year, the highest in this ranking.
Pros
- The largest Vendr-tracked purchase sample of any tool here, at 725 contracts.
- Custom-schema reporting that larger enterprises outgrow lighter tools looking for.
- Deep native ties to the rest of Adobe's enterprise marketing stack.
Cons
- "The learning curve is a wall," not something learned in a weekend, per one reviewer.
- Setup "requires tedious creation of event types, dimensions, metrics, and segments," per another.
- Highest Vendr median of any tool in this ranking, at $63,796 a year.
"The learning curve is a wall. It is not something that you can learn in a weekend."
Sasha T., junior digital marketing manager, enterprise, G2 review, January 2026
Why it's ranked #9. Adobe Analytics' Vendr-tracked contracts start as low as $8,412 a year, undercutting what many teams pay once they outgrow Pendo's 500-monthly-active-user free ceiling at #10, even though Adobe's own $63,796 median trails Contentsquare's $48,500 one spot up.
Pendo
Best fit
Product teams that want in-app guides and adoption tracking, and will treat behavioral analytics depth as a secondary concern.
Pendo's free plan supports up to 500 monthly active users; past that ceiling, the account can't create new guides, NPS surveys or segments until it upgrades (pendo.io/pricing). That 500-MAU cap is the tightest free-tier limit of any tool in this ranking.
Base, Core and Ultimate tiers are all quoted only through Pendo sales, with no published number at any level. This research pass found no Vendr contract data for Pendo either, a gap named here plainly, with no invented figure standing in for it. Novus, Pendo's newer AI-powered analytics tier, is free during its current beta with no stated MAU limit.
Key features
- In-app guides and walkthroughs for feature adoption and customer engagement.
- NPS surveys measuring customer satisfaction, tied to the same usage data.
- Feature usage analytics measured by monthly active users.
- Pendo Predict, an add-on priced by prediction volume.
- Retroactive Analytics, giving access to a product's full data history from install.
Pricing
Free to 500 MAU; Base, Core and Ultimate are all quoted on request, with no published number; Novus is free during its beta.
Pros
- The in-app experience is called "excellent" for customizing a user's experience.
- Retroactive Analytics backfills usage data all the way from the install date, ahead of the signup-date baseline most tools use.
- A free, uncapped beta tier on Novus while it's new.
Cons
- "Some reports can feel a bit complex to set up," per one reviewer.
- 500 monthly active users is the tightest free cap of any tool in this ranking.
- No published price at any paid tier, and no Vendr sample to benchmark against.
"Excellent in app experience! I love the being able to customize our user's experience on our platform."
Verified User, small business, G2 review
Why it's ranked #10. Pendo's free plan throttles at 500 monthly active users, the tightest ceiling in this ranking, and its paid tiers publish no price at all, both reasons it sits behind Adobe Analytics' Vendr-tracked $63,796 median at #9.
What these tools measure, and where they stop
Amplitude, Mixpanel, PostHog and Heap are built as product analytics software first. Customer analytics comes along as the output of that core work. They track discrete events, a signup, a button click, a completed checkout, and answer "what did this cohort do" through funnels and retention curves built from that same data.
Hotjar, FullStory and Contentsquare are user behavior tools built around session replay and heatmaps, the raw material for any customer experience audit. A heatmap aggregates thousands of sessions into one pattern; a replay shows one of those sessions in full. Neither reports revenue per cohort the way Amplitude's customer analytics does.
Google Analytics and Adobe Analytics sit at opposite ends of the same data analytics spectrum: GA4 is free and shallow by design, built for traffic and conversion counting at a level well short of deep behavioral segmentation. Adobe Analytics is the opposite bet, a custom-schema platform for teams with a dedicated analytics function and a contract in the tens of thousands.
Pendo is the odd one out. It measures usage to power in-app guides and NPS surveys first; analytics rides along as a byproduct, which is exactly why it ranks last on raw analytical depth even with a working free tier.
None of the ten tools above do the job of a customer data platform, which unifies data across sources into one profile with little analysis layer of its own, or a customer intelligence platform built around account scoring for sales teams. A customer analytics platform analyzes one product's event stream; those two adjacent categories do something structurally different.
How customer analytics breaks down
Customer analytics splits into four types, and most of the ten tools above only do two of them well. Descriptive analytics counts what already happened in the raw data: how many sessions, how many signups, how many checkouts finished last week. Diagnostic analytics asks why that number moved, usually by segmenting the same data by cohort, device or acquisition channel until the slice that dropped separates from the one that didn't.
Predictive analytics is the one every vendor's homepage leads with: modeling that forecasts future customer behavior from historical event data, flags accounts likely to churn before they cancel, and scores leads by the same signal a churn model uses in reverse. Amplitude and Mixpanel both ship cohort-based retention curves that do this without a separate predictive add-on.
Prescriptive analytics, the fourth type, is rarer in this category: it means the tool outputs a recommended action, a different kind of output than a number, and only Pendo's guide-triggering and PostHog's feature-flag targeting come close to it natively.
Customer feedback and survey data
Customer feedback is the qualitative half of customer analytics, and it comes from a narrower set of sources than event data: on-page surveys, NPS prompts and support tickets fed back into the same platform. Hotjar and Pendo both build survey responses and feedback collection into the core product; Amplitude, Mixpanel, Heap and PostHog treat it as a secondary feature or skip it outright.
PostHog's free plan caps survey responses at 1,500 a month, the only numeric limit any of these ten vendors publishes on this specific feature. A support ticket or an open-text survey answer explains the why behind a number descriptive analytics only shows as a drop.
Customer insights from segmentation and journey mapping
Customer insights worth acting on usually come from two techniques: segmentation, which groups users by shared traits or behavior, and journey analytics, which plots the touchpoints a user crosses before they convert or churn.
Mixpanel's Group analytics and Amplitude's cohort builder both run segmentation natively inside their platforms; FullStory and Contentsquare lean on path analysis instead, tracing user actions across sessions, a different method from bucketing them into a static segment.
A deeper look at how that segmentation discipline compares across a wider tool set sits on the site's market and customer segmentation tools ranking.
Retention, churn and customer lifetime value
Retention and loyalty both get measured off the same underlying data: repeat sessions, repeat purchases, and the gap between them. Customer lifetime value estimates the total revenue a customer generates across that relationship, and every cohort-based platform in this ranking (Amplitude, Mixpanel, Heap, PostHog) can build that number from raw event history.
Customer success teams use the same retention analytics to flag an account before it churns, the argument for buying analytics software with a 2,000,000-event free tier before the data backs up past the free cap.
Ecommerce teams run the same event-tracking logic against a narrower goal, covered separately in the ecommerce analytics tools ranking, and brick-and-mortar retailers run a parallel version of it with retail analytics software.
Data quality is the one factor every number on this page depends on. A platform fed sloppy event names, duplicated users or inconsistent data collection across web and mobile will misreport every number downstream, including the ones in this ranking's own comparison table above. Dashboards turn that raw data into something a non-analyst can read in a minute, without pulling a report from whoever owns the warehouse.
Pricing across the category
Four of these ten tools publish a real self-serve price: Amplitude, Mixpanel, PostHog and Hotjar. The other six, Heap, FullStory, Contentsquare, Adobe Analytics and Pendo, quote everything past their free tier through a sales call, which is exactly the gap Vendr's anonymized buyer data exists to close.
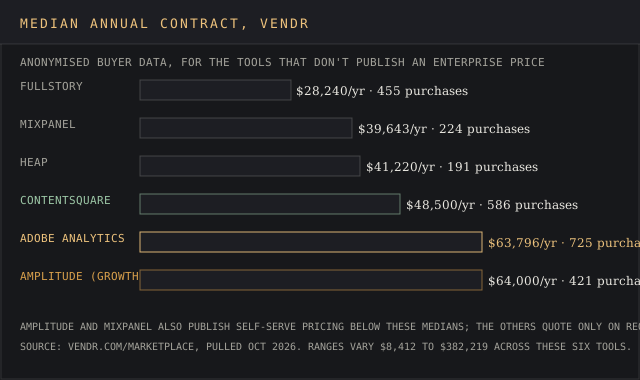
Amplitude and Mixpanel both publish self-serve pricing below their Vendr medians, which means a buyer willing to self-serve, skipping the enterprise-terms negotiation, can often land well under the median figures shown above.
Documented limits and how long your data sticks around
Retention is the limit buyers miss until they need a cohort from eight months back and find it's already gone. PostHog's pay-as-you-go tier holds data for 2,555 days; Amplitude's free tier drops to 365; Heap's free plan sits around 180 days before the Pro add-on stretches it to 1,095.

Days of session-replay retention Amplitude allows on every plan it sells, free or Enterprise, regardless of the 730-day window its event data gets on Plus.
Google Analytics versus the paid alternatives
Google Analytics' free, uncapped standard tier is the reason most sites never evaluate anything else, and a detailed breakdown of where that free tier runs out against Hotjar's paid features sits on the site's Google Analytics vs Hotjar comparison. The short version: GA4 answers "how much traffic, from where, converting at what rate," and stops there; it has no native replay or heatmap at any tier, free or 360.
Hotjar and Amplitude get compared directly, too, on the site's Hotjar vs Amplitude page, since teams often start with one and bolt on the other once they need both qualitative replay and quantitative cohort analysis. The site's own web analytics pricing report breaks down the same vendor cost structures from a pure pricing angle, and customer data platform pricing covers the adjacent category this ranking deliberately excludes.
Common mistakes buyers make evaluating this category
The most common mistake is picking software for its event cap and never checking retention separately; a 2,000,000-event free tier is worthless for a cohort analysis if the data behind it is already gone at day 366. Check both numbers before signing anything; the headline figure on the pricing page is only half the evaluation.
A close second: assuming "unlimited" on a marketing page means no limit exists anywhere in the product. GA4's standard properties carry no event ceiling but still cap BigQuery's daily export at 1,000,000 events and sampling at 10,000,000 per query, limits that show up only in the docs, a level of detail the pricing page skips entirely.
The third mistake cuts against buying up: five of these ten tools publish no self-serve price at all, and a sales call quoting against list price, a different number from the Vendr medians above, makes for a bad surprise after the contract's signed. Ask for the figure before the call, before the pitch has a chance to anchor it, and weigh it against what the tool enables a team to measure day to day, a different question from what the deck promises.
Customer intelligence framework best practices walks through the same evaluation discipline for the account-scoring side of the stack, and what customer intelligence means draws the category line this ranking relies on more fully. See our methodology for how every ranking on the site, this one included, gets scored.
Customer analytics tools FAQ
What is a customer analytics tool
Software built to analyze customer data. It turns events, sessions or page views into funnels, cohorts, heatmaps or replays a team can act on, distinct from a customer data platform, which mainly stores and unifies that data without an analysis layer of its own.
Is Google Analytics a customer analytics tool
Yes, in the narrow sense that it tracks events so a team can understand customer behavior through standard reports. Its standard tier has no native session replay or heatmap, and is built for traffic and conversion counting at a level well short of deep behavioral segmentation.
How much do customer analytics tools cost
Four of the ten ranked here, Amplitude, Mixpanel, PostHog and Hotjar, publish self-serve pricing starting free. The other six quote through sales, with Vendr-tracked medians running from $28,240 a year at FullStory to $63,796 at Adobe Analytics.
Can a free customer analytics tool handle a real product
For a while. PostHog's free tier covers 1,000,000 events and 5,000 replays a month, and Amplitude's covers 2,000,000 events, enough for most early-stage products; the ceiling shows up once a team needs retention past a year or volume past the millions-of-events range.
What's the best customer analytics software for a small team
Among the tools ranked here, Mixpanel and PostHog both set up fastest for a small team: both publish self-serve pricing, both have a free plan at or above 1,000,000 events a month, and neither requires a sales call to get past the free tier.
What's the difference between a customer analytics tool and a customer data platform
A customer analytics tool answers "what did users do," with funnels, cohorts and replays built on top of the data. A customer data platform's job is unifying that data across sources into one profile, usually with little or no analysis layer of its own; the best choice for a given team depends on how many sources need unifying, a different buying question than the one this ranking answers.
Bottom line
PostHog wins this ranking on the numbers that matter most for a growing product team: a 1,000,000-event free tier, native replay built into the core product, and retention that runs seven years past the free plan's one. Amplitude is the right call once cohort analysis at real scale outweighs the convenience of one bill over three.
For teams that just need heatmaps and replay without touching a warehouse, Hotjar's $40-a-month Growth tier undercuts every enterprise-quoted alternative here. And for anyone still deciding if paid analytics are worth it yet, Google Analytics costs nothing to keep running while that question gets answered.