Retail analytics software: rankings and buying guide for 2026
 By Jan Suski. I go deep on every review, checking every number against its source and digging up details other coverage misses, a habit from six years of SEO and link building for tech companies. Bylines at Surfer, Brand24, and Senuto. How the scoring works.
· Prefer this source on Google
Quick comparison of retail analytics software
None of the eight publishes a rate card. The monthly band above is the category norm, so treat every quote as a starting position.
| # | Platform | Primary job | Pricing model | Best fit |
|---|---|---|---|---|
| 1 | Oracle Retail Analytics | Enterprise merchandising and inventory analytics | Quoted, module-based | Multi-banner retailers already on Oracle Retail |
| 2 | Circana | POS and panel measurement | Quoted, by category and market | Brands tracking share in measured categories |
| 3 | NielsenIQ | Consumer panel and retail measurement | Quoted, by market and coverage | CPG brands needing syndicated retail data |
| 4 | ThoughtSpot | Search-led BI over a retail data model | Quoted, consumption-based | Teams with a warehouse and a report backlog |
| 5 | EDITED | Assortment and markdown intelligence | Quoted, by category coverage | Apparel and fashion merchandising |
| 6 | Competera | Price optimization and elasticity modelling | Quoted, by SKU volume | Retailers with pricing governance in place |
| 7 | Placer.ai | Foot traffic and location analytics | Quoted, by venue count | Physical chains planning sites |
| 8 | Wiser Solutions | Marketplace pricing and retail execution | Quoted, by SKU and store count | Brands policing MAP and shelf compliance |
Retail analytics software turns POS receipts, inventory data and customer traffic into decisions about what to stock, what to charge and where to open next.
The category splits in two. Measurement vendors sell you data you cannot otherwise get. Platform vendors sell you a dashboard over data you already own. Confuse the two while shortlisting and you're barking up the wrong tree before the first demo even starts.
Most platforms charge $1,000 to $5,000 a month at mid-market scale, and implementation runs from days to six months depending on how many systems have to be wired in.
How to choose the right retail analytics software
Match the platform to your analytics maturity before you match it to your feature list. Buying a predictive platform while the business still argues about last month's numbers wastes the licence and the year.
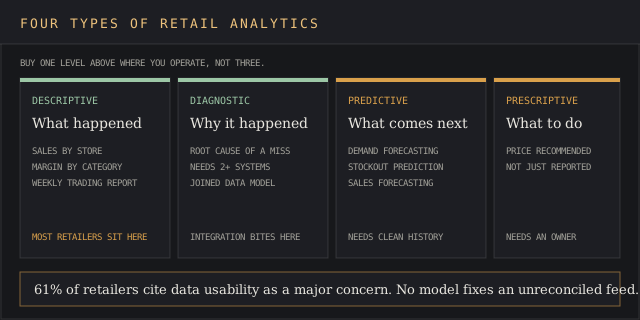
Analytical maturity. If nobody agrees on what happened last quarter, you need descriptive reporting. Predictive capabilities earn their cost only once the descriptive layer holds up.
61% of retailers cite data usability as a major concern, and 48% struggle with data integration. Those two figures explain more failed implementations than any gap in vendor capability, and no model fixes an inventory feed nobody reconciles.
Compatibility with existing tools. Integration is the most common reason a retail analytics platform stalls after month three. Ask which connectors ship supported.
Who runs it. Business users abandon anything that needs SQL. Analysts abandon anything that hides the model. Pick for the group who will open it weekly.
Total cost against revenue. Retailers under $5 million in revenue can run effectively on free tools. Below that line, a platform licence buys sophistication the business cannot yet act on, biting off more than it can chew before the basics are in place.
Implementation runs two to six months for enterprise platforms and days for a self-serve dashboard on one POS feed. Most of that time goes on integration, so budget the internal hours alongside the subscription.
Top retail analytics tools, ranked
Ranked on data coverage, integration reach, analytical depth and cost against delivered scope.
Oracle Retail Analytics
Best fit: multi-banner retailers already running Oracle Retail merchandising, where the analytics layer sits on the transactional system.
Oracle sells retail analytics as modules over its merchandising, planning and inventory management systems. The retail-specific data model ships built, so buyers hit the ground running without building one from raw tables themselves.
Features
- Prebuilt retail data model covering sales, inventory and margin.
- Science-driven demand forecasting tuned for retail seasonality.
- Assortment and space planning analytics.
- Integration with Oracle merchandising and inventory management software.
- Embedded AI and machine learning for forecast generation.
Pricing
Quoted per module and per banner. Enterprise-only in practice, with implementation at the long end of the two-to-six-month range because the integration surface is wide.
Pros
- The retail data model ships ready, which removes the most common failure pattern.
- Forecasting is built for retail.
- One vendor across transactions and analysis.
Cons
- Weak value if you're not already on Oracle.
- Cost and implementation length rule it out below enterprise scale.
- Slower to change than a warehouse-native tool.
Why it's ranked #1. Nothing else here combines a retail-specific data model with the transactional system underneath it. It ranks first for the buyer it fits and would rank last for a single-banner retailer on Shopify.
Circana
Best fit: brands that need their share of a measured category, on top of their own sales performance.
Circana sells measured market data: POS records, consumer panel data and category share across the retailers it covers, real numbers straight from the horse's mouth that your own feed can only estimate. Brands that model price and promotion on that data can compare Circana's and NIQ's optimizers on our RGM software ranking.
Features
- POS data across covered retailers.
- Consumer panel tracking purchase behavior over time.
- Category and share reporting.
- New product performance tracking.
- Promotion and price analysis against category baselines.
Pricing
Quoted by category, market and retailer coverage. Cost scales with how many categories you subscribe to.
Pros
- Answers the one question your own data can't: how you performed against the category.
- Panel data reveals consumer behavior across every retailer in the category.
- Long time series supports genuine sales forecasting.
Cons
- Coverage varies by market and category, so verify yours before signing.
- Reports lag real time.
- No operational layer for inventory planning.
Why it's ranked #2. Measured share data has no substitute, and Circana's category depth beats a general analytics platform on that question. It sits below Oracle because it informs decisions.
NielsenIQ
Best fit: CPG brands operating across several countries who need one syndicated read on retail performance.
NielsenIQ covers the same measurement job with broader international reach, combining retail measurement with consumer panel data across more markets.
Features
- Retail measurement across a wide retailer footprint.
- Consumer panel and shopper behavior data.
- Omnichannel view spanning store and ecommerce.
- Category benchmarking against competitors.
- New product tracking from launch.
Pricing
Quoted by market, category and channel coverage. Multi-market subscriptions escalate quickly and can cost an arm and a leg at full international scale, and the second country costs more than the first saved you.
Pros
- Broadest international coverage of the measurement vendors.
- Omnichannel reporting spans physical and online.
- Established methodology buyers already trust internally.
Cons
- Expensive at multi-market scale.
- Same reporting lag as any panel-based source.
- Coverage gaps in smaller markets and independent channels.
Why it's ranked #3. It edges Circana on geography and loses to it on depth within US measured categories, which is why the choice between them is decided by where you sell.
The two measurement vendors and the six platforms are not substitutes, and shortlists that mix them are usually two projects wearing one budget line. Circana and NielsenIQ tell you about the market. Everything below tells you about you.
ThoughtSpot
Best fit: retail teams with a working data warehouse and a report backlog they want to stop growing.
ThoughtSpot lets business users ask questions in natural language against the warehouse, so the analytics team stops writing one-off reports, gets the ball rolling on self-serve analysis, and starts maintaining the model. The ThoughtSpot review covers what that model takes to build.
Features
- Natural-language search over governed retail data.
- Agentic analysis that proposes follow-up questions.
- Live query against cloud warehouses without extraction.
- Embedded analytics for supplier or franchise portals.
- Alerting on metric movement.
Pricing
Quoted and consumption-based, so cost tracks query volume. That helps wide distribution and punishes uncontrolled dashboards.
Pros
- Removes the analyst bottleneck for routine questions.
- Consumption pricing makes store-manager access affordable.
- Works over the warehouse you already have.
Cons
- Needs a clean, modelled warehouse; it amplifies data quality problems.
- No retail data model out of the box.
- Consumption cost is hard to forecast in year one.
Why it's ranked #4. Strongest option for turning existing retail data into answers business users can get themselves. It ranks below the measurement vendors because it adds no external data at all.
EDITED
Best fit: apparel and fashion merchandising teams deciding what to range, when to mark down and where a rival has a gap.
EDITED tracks assortment, pricing and markdown activity across competitor ranges, which is the merchandising question apparel retailers ask weekly.
Features
- Competitor assortment tracking by category and price band.
- Markdown timing and depth monitoring.
- Sell-out rate signals across tracked ranges.
- New-arrival tracking as competitors drop stock.
- Price architecture comparison against a defined competitor set.
Pricing
Quoted by category and competitor coverage. Narrower scope than a full platform, priced accordingly.
Pros
- Deepest assortment data in apparel.
- Markdown timing signals act directly on inventory planning.
- Competitor price architecture is hard to assemble any other way.
Cons
- Apparel-centric; thin in grocery, hardware and most non-fashion categories.
- No internal sales data.
- Nothing for store operations.
Why it's ranked #5. Inside apparel it beats everything below it on the question that matters. It's no jack of all trades, and outside apparel it does not compete, which is what keeps it out of the top four.
Competera
Best fit: retailers with clean product data and an owner for pricing decisions, ready to act on a recommendation engine.
Competera models price elasticity and recommends prices. That is a different product from a pricing dashboard, and a different internal conversation. Our price optimization tools ranking puts Competera fourth of ten among those recommendation engines.
Features
- Competitor price monitoring across tracked SKUs.
- Demand-based elasticity modelling.
- Price recommendation engine with margin and volume targets.
- Promotion impact simulation before commitment.
- Portfolio management across price families.
Pricing
Quoted by SKU volume and matching complexity. Product matching quality drives both the cost and the results, and it needs maintenance.
Pros
- Moves from reporting prices to setting them.
- Elasticity modelling grounds pricing in demand.
- Simulation lets you test before committing.
Cons
- Needs pricing governance first; recommendations nobody is authorised to accept produce nothing.
- Product matching needs ongoing maintenance.
- Not a general retail analytics platform.
Why it's ranked #6. The prescriptive layer here is more advanced than anything above it, but it applies to one decision, putting most of its eggs in one basket: pricing. Depth on one question ranks below breadth across several. See the pricing intelligence rankings for the wider category.
Placer.ai
Best fit: physical chains choosing sites, sizing catchments or benchmarking store traffic against competitors.
Placer.ai measures foot traffic, dwell time and trade-area composition from mobile location data, covering the part of retail performance that never reaches a POS system.
Features
- Visit estimates by location and time period.
- Trade area and demographic profiles per venue.
- Competitor venue benchmarking.
- Cross-shopping between chains.
- Geospatial analytics for site selection and market expansion.
Pricing
Quoted by venue count and data depth. Cost scales with how many locations you track, yours and your competitors'.
Pros
- Only source here for competitor store traffic.
- Trade-area data makes site decisions arguable.
- Applies to closures as readily as to openings.
Cons
- Panel-derived estimates; validate against known door counts before trusting them.
- No product, price or inventory data.
- Weak for pure ecommerce.
Why it's ranked #7. It answers a question nothing else on this list touches and would rank higher for a chain in expansion, staying ahead of the curve on site selection. For a retailer not opening stores, the data doesn't drive day-to-day decisions.
Wiser Solutions
Best fit: brands policing minimum advertised price across marketplaces while verifying planogram compliance in stores.
Wiser Solutions combines online price monitoring with in-store execution checks, covering shelf compliance alongside marketplace pricing.
Features
- Marketplace and competitor price tracking.
- MAP violation detection and alerting.
- Digital shelf content compliance monitoring.
- In-store audits via crowdsourced field data.
- Assortment gap identification against competitor listings.
Pricing
Quoted by SKU count, marketplace coverage and store audit volume. The field-audit component prices separately from the monitoring.
Pros
- Covers online and physical execution in one contract.
- MAP enforcement has a directly measurable return.
- Digital shelf monitoring catches content errors that suppress conversion.
Cons
- Store audit coverage depends on field-agent density in your markets.
- Narrower analytical depth than a full platform.
- Overlaps with Competera on price monitoring, without the elasticity modelling.
Why it's ranked #8. Broad but shallow relative to the seven above. It earns a place because execution monitoring is the gap most analytics stacks leave open, and nothing else here checks that the plan reached the shelf, proof that actions speak louder than words in this category.
The four types of retail analytics
Retail analytics splits into four types, and vendors sell across them without saying which one they lead with.
Descriptive analytics
Descriptive analytics answers questions about past performance. What sold, where, at what margin. Most retail organizations live here, and the operational metrics and sales trends on a weekly trading report come from this layer.
Diagnostic analytics
Diagnostic analytics identifies root causes of performance issues. Why did that category miss. Diagnostic work needs you to analyze data from more than one system, which is where integration quality starts to bite.
Predictive analytics
Predictive analytics forecasts future trends from historical data. Demand forecasting, sales forecasting and stockout prediction all sit here, and all depend on clean historical sales data.
Prescriptive analytics
Prescriptive analytics recommends actions based on predicted outcomes. Competera's price recommendations are prescriptive; a report showing competitor prices is descriptive. The gap between the two is the gap between reporting and actionable insights.
Buy at the level above where you operate. Three levels above is spend you cannot use yet. A predictive platform bought at descriptive maturity is the single most expensive mistake in this category, and the licence renews regardless of anyone using the forecast.
What retail data analytics does with customer data
Retail data analytics converts raw data into dashboards and reports a merchant can act on without writing a query. The value sits in what happens after the dashboard.
Customer analytics builds segments from purchase history, then tests marketing campaigns against those segments to see if they outperform a broad send. Customer segmentation grounded in transaction data beats segmentation built from assumptions about who shops with you.
Loyalty programs supply the identity layer that makes this work. Without a way to connect a basket to a person, customer trends stay anonymous and customer loyalty stays unmeasured.
Improvement in sales conversions attributed to retail analytics, alongside profitability gains of 20% to 55%, in figures published by rebiz. Both are vendor-reported, so read them as the upper end of what a well-run implementation produced.
Customer feedback and review data close the loop. Reading between the lines of what shoppers complained about explains a conversion drop that sales data alone only measures, and it feeds the marketing strategies built on top.
Data sources a retail analytics platform pulls from
Common data sources for retail analytics include POS systems and CRM software. Most implementations stall on how many others have to join them.
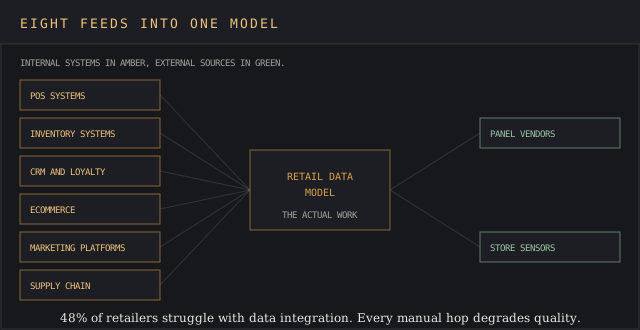
The usual set spans internal and external feeds:
- POS systems, for transaction-level sales data
- Inventory management systems, for stock position and movement
- CRM and loyalty platforms, for customer identity
- Ecommerce platforms, for online basket and browsing behavior
- Marketing platforms, for campaign spend and attribution
- Supply chain systems, for lead times and fill rates
- In store analytics from computer vision or door counters, for traffic data
- External data from panel vendors and retail intelligence providers
Joining multiple data sources
Pulling multiple data sources into one model is the work. Manual data entry between systems is where data quality degrades, and every unautomated hop adds a reconciliation argument to someone's Monday.
Computer vision has moved this along in physical stores. Camera-based systems now keep an eye on customer traffic, measure dwell by zone and check store layouts against planogram without anyone walking the floor with a clipboard.
Using customer behavior data to drive sales
Customer behavior data changes three decisions: what to stock, what to charge and what to say. Everything else is reporting.
Demand signals from combined sales and traffic data let you forecast demand store by store, which is what turns inventory analytics into fewer stockouts and less markdown.
Dynamic pricing follows the same path. Analytics that read consumer behavior and competitor position let pricing strategies move within the week.
Targeted marketing is the third. Campaigns aimed at segments defined by real purchase behavior improve customer engagement and customer satisfaction measurably against a control, which is the only way to know the analytics investment paid.
Fitting a platform to your existing tools
Compatibility with existing tools decides more implementations than analytical capability does. A platform that reads your POS and your ERP on day one beats a better platform that needs six months of pipeline work.
Retail analytics takes longer to pay back than the sales cycle suggests, so the integration answer matters more than the demo.
Three questions before signing, so you leave no stone unturned before the contract locks you in. Which connectors are supported. Who maintains them when an upstream API changes. What happens to your dashboards when it breaks.
Internal data collection you already run may cover more of this than expected. If business intelligence tools already read your warehouse, the gap is a retail data model, and that is a far cheaper problem to solve.
Retail analytics software FAQ
What is retail analytics software?
Software that collects sales, inventory, customer and traffic data from retail systems, then analyses it to support decisions on assortment, pricing, stock and marketing. It spans free dashboards over a single POS feed through enterprise platforms with prebuilt retail data models.
What are the 4 types of analytics?
Descriptive, diagnostic, predictive and prescriptive. Descriptive reports what happened, diagnostic explains why, predictive forecasts what comes next, and prescriptive recommends the action to take. Retail analytics solutions usually lead with one and claim all four.
How much does retail analytics software cost?
Most platforms charge $1,000 to $5,000 a month at mid-market scale. Retailers under $5 million in revenue can use free tools effectively, and enterprise deployments with multiple modules run well above that band before implementation costs.
How long does implementation take?
Implementation time ranges from days to six months. A self-serve dashboard on one data source starts in days; enterprise platforms typically require two to six months, most of it spent on integration.
What data do retail analytics tools need?
At minimum, transaction data from POS systems. Useful analysis adds inventory data, customer data from CRM or loyalty programs, and external data on category performance or store traffic. 48% of retailers struggle with data integration issues, so audit what connects before choosing.
Bottom line
Match the platform to the decision. Oracle for enterprise merchandising, Circana or NielsenIQ for measured category share, ThoughtSpot to unblock a warehouse, EDITED for apparel assortment.
Competera for pricing, Placer.ai for store traffic and site selection, Wiser for marketplace and shelf execution.
The retail business that gets value from analytics is the one where somebody owns the number, calls the shots, and can change what happens next week because of it, regardless of which platform they run.