Google Analytics vs Hotjar
 By Jan Suski. I go deep on every review, checking every number against its source and digging up details other coverage misses, a habit from six years of SEO and link building for tech companies. Bylines at Surfer, Brand24, and Senuto. How the scoring works.
· Prefer this source on Google
| WHAT EACH ONE DOES | GOOGLE ANALYTICS 4 | HOTJAR |
|---|---|---|
| Core job | Count what happened | Show how it happened |
| Measurement unit | Events | Sessions |
| Acquisition | Full attribution | No feature |
| Session recordings | No feature | Yes, all plans |
| Heat mapping | No feature | Yes, all plans |
| On-page surveys | No feature | Yes, all plans |
| Form analytics | Start and submit | Field level |
| Mobile apps | Firebase SDK | Web only |
| Raw export | BigQuery | CSV and API |
| Skip it if | Nothing; it's free | Under 200k sessions |
| WHAT YOU GET | GOOGLE ANALYTICS 4 | HOTJAR |
|---|---|---|
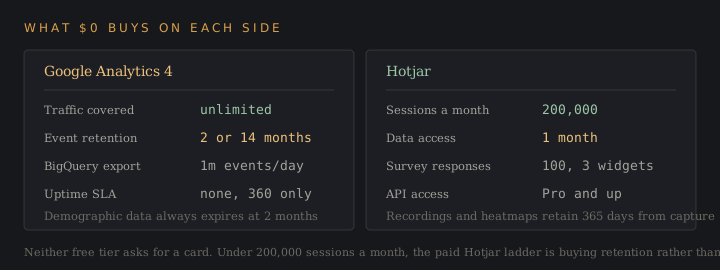
| Free tier | $0, unlimited traffic | $0, 200k sessions |
| Free retention | 2 or 14 months | 1 month |
| Paid entry price | Quote only | $39/mo annually |
| At 200k sessions | $0 | $591/mo annually |
| Annual discount | None published | 20% |
| Paid retention | Up to 50 months | 13 months |
| Seats | Unlimited | Unmetered |
| Uptime SLA | 360 only, 99.9% | Enterprise only |
| EU data residency | Four rulings against | AWS eu-west-1 |
| Owner | Contentsquare |
StrongerWeakerNo edge
Thirty-six further documented limits sit behind the button below: quota ceilings, sampling thresholds, API rate limits and what each plan gates. Test scenario is one website doing 200,000 monthly sessions, one property, billed annually. Google Analytics prices are the published standard tier; the Hotjar figure comes from Contentsquare's own estimator, read 8 August 2026. Every figure is sourced in the section its row links to.
| Google Analytics 4 | WHAT IT DOCUMENTS |
|---|---|
| Event parameters | 25 per event, 100 on Analytics 360 |
| User properties | 25 per property, 100 on 360 |
| Events per user daily | 100,000 collected, the rest dropped |
| Sessions per user daily | 2,000 distinct sessions |
| Event name length | 40 characters; longer names not logged |
| Audiences | 100 per property, 400 on 360 |
| Key events | 30 on standard, 50 on 360 |
| Custom dimensions | 50 event-scoped, 125 on 360 |
| Calculated metrics | 5 per property, 50 on 360 |
| Exploration sampling | 10 million events a query, 1 billion on 360 |
| Unsampled explorations | 360 only, 20,000 daily tokens |
| Data API tokens | 200,000 a day and 40,000 an hour |
| Data API concurrency | 10 requests, 50 on 360 |
| Admin API rate limit | 1,200 requests a minute, 600 writes |
| BigQuery daily export | 1 million events a day, 20 billion on 360 |
| BigQuery streaming | No volume cap, $0.05 a gigabyte ingested |
| Report export | 100,000 rows a download |
| Data freshness | 2 to 6 hours, about 1 hour on 360 |
| Hotjar | WHAT IT DOCUMENTS |
|---|---|
| Projects | 1 on Free, 3 on Growth, 6 on Pro |
| Replay capture rate | 5% to 10,000 on Free, 15% on Growth |
| Replay access window | 1 month Free, up to 24 on Pro* |
| Analytics data access | 1 month Free, 13 months Growth* |
| Data retention | 365 days from capture, every plan* |
| Survey responses | 100 a month Free, up to 100,000* |
| Survey widgets | 3 on Free, unlimited from Growth |
| Session definition | Ends after 30 idle minutes, 4 hour cap |
| Behaviour at the cap | Capture spread across the 24 hours |
| API rate limit | 3,000 requests a minute, 50 a second |
| API plan gate | Scale plans only, 100 items a page |
| API key expiry | One year, and it cannot be extended |
| Heatmap capture cap | 10 MB of HTML, 50,000 px screenshot |
| MCP tool calls | 300 a month Free, 36,000 a year Growth |
| Pre-built integrations | 7 on Free, 9 on Growth, 115+ on Pro |
| SSO | Google OAuth Free and Growth, SAML on Pro |
| Free trial | 15 days of Growth, no card taken |
| Deletion turnaround | Hard delete completes inside 30 days |
*A marked figure is one Hotjar states two ways in one place. Its retention article carries an unresolved A/B test, so both answers ship in the same HTML: one variant keeps recordings and heatmaps "365 days from capture" and says "This applies to all accounts and plans", the other prints Basic 1 month, Plus 6 months and Business 12 months in the same table.
Both name Hotjar plans, so this is Hotjar's own figures disagreeing with themselves.
Contentsquare’s pricing table gives Product Analytics history as 6 and 12 months on its plan cards and 7 and 13 months in the comparison table below them. Free-tier survey responses read 100 a month on pricing and 20 a month for Ask Basic in the help centre, which still runs the retired Basic, Plus, Business and Scale names alongside the current ones.
Sources, and where the two vocabularies collide
Every row comes from a vendor property.
- Google Analytics: the property-limit and retention articles on support.google.com/analytics, plus the Data API and Admin API quota pages on developers.google.com.
- Hotjar: contentsquare.com/pricing, which is where hotjar.com/pricing now resolves, and help.hotjar.com.
Hotjar carries two live plan vocabularies at once: Free, Growth, Pro and Enterprise on the pricing page, against Basic, Plus, Business and Scale in help-centre articles that gate the API to Scale.
Neither vendor publishes a Hotjar funnel step limit, a heatmap count per site, or a GA4 dimension cardinality threshold, so no row claims one.
Google Analytics counts what happened on your website and Hotjar records how it happened, so most teams that seriously weigh Hotjar vs Google Analytics end up running both. This page prices both analytics tools against one identical scenario, 200,000 monthly sessions, lists the documented limit each one hits first, and sets out which questions each can answer.
It's written for the person who already has Google Analytics installed on their website and is deciding if a second tool earns its line item.
The decision matters because Google Analytics and Hotjar meter differently. Google Analytics bills nothing at any level of website traffic on its standard tier, while Hotjar charges by session and stops collecting new heat mapping data the moment you pass your allowance. Get the unit wrong and the budget is wrong by an order of magnitude. Read the Hotjar vs Google Analytics question as two meters.
The overlap between them is one capability wide. Google Analytics is an event pipeline and session replay is a video product, so four of the capabilities Hotjar sells have no Google equivalent at all, and Google has announced no plan to build one.
↑ COMPARISONWhat each analytics platform costs at 200,000 monthly sessions
Pick one scenario and price both tools against it, one site, one meter each. A website doing 200,000 sessions a month across all its pages, one property, one team of users, billed annually.
Google Analytics 4 costs nothing at that volume. Google Analytics free covers any level of website traffic on the standard tier, and Google publishes no rate card for Analytics 360; the 360 model charges a fixed base fee covering the first 25 million monthly events plus a declining per-event fee above it.
Cardinal Path's analysis of that tier structure puts the current 360 entry near $50,000 a year, against the flat $150,000 a year that Universal Analytics 360 carried before Google moved off it.
Hotjar costs $591 a month at 200,000 sessions billed annually, or $739 billed monthly. Contentsquare's own estimator returns that figure for Experience Analytics Growth with 30,000 replays included. Here's the published ladder, read from contentsquare.com/pricing on 8 August 2026.
| Monthly sessions | Replays included | Billed annually | Billed monthly |
|---|---|---|---|
| Up to 200,000 (Free) | Free-tier allowance | $0 | $0 |
| 7,000 | 7,000 | $39 | $49 |
| 20,000 | 20,000 | $95 | $119 |
| 60,000 | 20,000 | $223 | $279 |
| 100,000 | 20,000 | $327 | $409 |
| 200,000 | 30,000 | $591 | $739 |
| 240,000+ | 36,000+ | Quote | Quote |
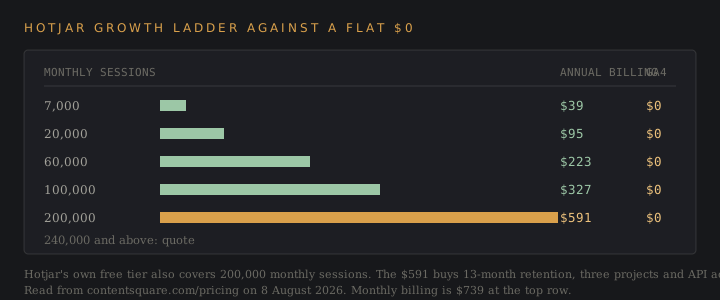
Read the first two rows together. Hotjar's free tier covers 200,000 monthly sessions & the paid ladder charges $591 a month for the same 200,000 sessions.
What the money buys is retention. The free plan gives one month of data access, one project and no API; Growth gives 13 months, three projects, zone-based heatmaps, journey analysis & a replay allowance. Annual billing takes exactly 20% off every tier, and European customers including the UK are billed in euros while everyone else pays US dollars. There are no hidden fees on the published tiers, and no overage: collection stops instead.
↑ COMPARISONHotjar's prices left hotjar.com
Hotjar Ltd of Malta merged into the Contentsquare Group on 1 July 2025, four years after Contentsquare acquired the company in a deal announced 1 September 2021 with no disclosed value. Existing tracking installs kept working and no code reinstall was required.
What changed is where the numbers live. hotjar.com/pricing now redirects to contentsquare.com/pricing, and the old Observe and Ask tier names, Basic, Plus, Business and Scale, have been replaced by Free, Growth, Pro and Enterprise sold across three product lines. Contentsquare's help centre still carries articles using the legacy names, so both vocabularies are live at once.
That redirect is why so much of the web still quotes stale figures, and it catches people out in both directions.
Vendr's Contentsquare page, last updated February 2026, says Contentsquare has no free tier and that paid plans start "at ~$400/month". Contentsquare's pricing page today shows a free tier at 200,000 monthly sessions and a $39 paid entry, so both of those are wrong.
The same Vendr page puts Hotjar's free plan at "up to 35 daily sessions", and that one is right. Hotjar's own help centre gives Hotjar Free 35 sessions a day against Contentsquare Free's 200,000 a month, "190x more data" in its words.
Two free plans, two products, one company, and the figure that looks stale is the accurate one.
Vendr's tracked contract data for Contentsquare reads $20,000 median, $14,600 low and $95,168 high. Body copy on the same page describes mid-market deals at $80,000 to $200,000 and enterprise deals at $200,000 to $500,000, above its own tracked ceiling. Use the stat block and ignore the prose bands.
↑ COMPARISONThe limits each analytics tool hits first
Both products degrade at a documented threshold. Neither fails outright, and the thresholds are nothing alike.
Four documented limits shape what Google Analytics returns.
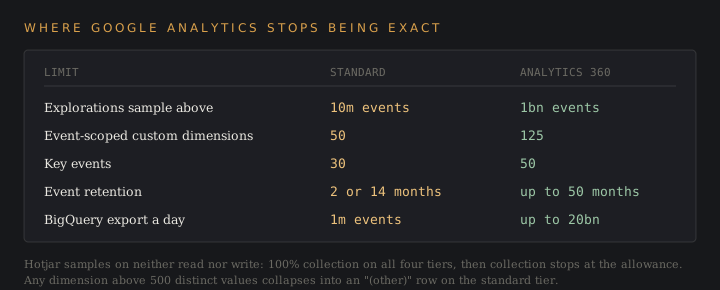
- Explorations start sampling above 10 million events on the standard tier, against 1 billion on 360.
- Any dimension carrying more than 500 distinct values gets condensed into an "(other)" row.
- Standard properties export a maximum of 1 million events a day to BigQuery where 360 properties export up to 20 billion, and once GA4 data lands in BigQuery it can't be exported again.
- Event-level retention on the free tier is 2 or 14 months, and properties Google classifies as Large or XL are forced down to 2 months regardless of the setting chosen.
Hotjar's failure mode is blunter. Reach the session allowance on Free or Growth and no new heatmap or funnel data is collected until the reset date; reach the Voice of Customer response cap and the survey widget stops appearing on the website. Recordings and heatmaps retain 365 days from capture.
Hotjar's own retention article prints both answers at once. An unresolved A/B test leaves one variant saying 365 days on every plan and the other saying Basic 1 month, Plus 6 months, Business 12 months. Both sit in the page's HTML, so anything reading it without JavaScript sees the contradiction.
| Limit | Google Analytics standard | Google Analytics 360 | Hotjar |
|---|---|---|---|
| Sampling threshold | 10 million events | 1 billion events | None; 100% collection rate |
| Custom dimensions, event-scoped | 50 | 125 | Not applicable |
| Key events | 30 | 50 | Not applicable |
| Event retention | 2 or 14 months | Up to 50 months | 365 days for recordings |
| BigQuery export | 1 million events/day | Up to 20 billion/day | No BigQuery export |
| Data API tokens | 200,000/day | 2,000,000/day | 3,000 requests/minute per IP |
| Behaviour at the cap | Reports sample | Reports sample at 1bn | Collection stops until reset |
↑ COMPARISONWhat Hotjar shows that Google Analytics has no feature for
Google Analytics tells you that 68% of users left a page. It can't tell you those users left because the submit button sat below a sticky banner on a 13-inch screen. To understand user behavior at that level you need to watch it happen.
Session recordings close that gap by replaying the visit. You watch recordings of real users scrolling, hesitating, clicking a non-clickable element, abandoning. Filters surface the sessions worth watching on a busy website, so you're not sitting through a thousand bounces to identify usability issues across four broken user flows. Watching twenty users interact with one form beats a week of dashboards.
Heatmaps aggregate the same visual data into one image per page. A click map shows where users click, a scroll map shows how far down the pages users get and how much content never reaches users heads at all, and both make it obvious when a call to action sits below the fold on your highest-traffic landing pages.
Surveys and feedback widgets add the one thing no volume of behavioral data supplies, which is the account real users give of what they wanted. Hotjar's free tier carries 100 monthly responses and three widgets; Voice of Customer Growth raises that to 500 responses from $79 a month with unlimited widgets and unlimited responses access.
Customer feedback is how you find out that your product pages confused users. Qualitative data of that kind never shows up in an event stream.
Form analytics closes the last gap, and it's where direct feedback from the interface itself beats any survey. Google Analytics fires form_start and form_submit and nothing between them, so a form with nine fields produces two data points. Hotjar reports which field users abandoned, and its funnels show which pages those users skipped.
↑ COMPARISONWhat Google Analytics measures that Hotjar never will
Attribution is the whole answer, and it's the clearest case for Hotjar vs Google Analytics landing on Google. Google Analytics traces every session back to one of your traffic sources, a campaign and a medium, and it links natively to Google Ads so paid spend reconciles against on-site conversion rates without a manual join.
Scale is the second answer. Use Google Analytics and you can track 100% of high traffic volumes on a site of any size without a budget conversation, since the standard tier is free. Hotjar's meter starts running at 200,001 sessions, so a site past that number is either on the paid ladder or losing data.
Historical data is the third. Analytics 360 retains event-level data up to 50 months, so year-over-year comparisons across four full cycles are a single query. Hotjar tops out at 13 months of analytics data access on any published tier.
Then there's everything downstream of BigQuery. Once GA4 events stream into a warehouse, marketing efforts get modelled alongside CRM and billing data, and page views join revenue in the same query. Streaming export carries no volume limit on either tier and costs $0.05 per gigabyte ingested, with roughly 600,000 GA4 events to the gigabyte.
Running Google Analytics and Hotjar together
The integration is two-way, which is why most teams stop treating this as a choice. Hotjar pushes its User ID into a Google Analytics custom dimension, and Google Analytics events flow back into Hotjar as recording filters, so a segment of users defined in one of the two tools becomes a set of session recordings in the other.
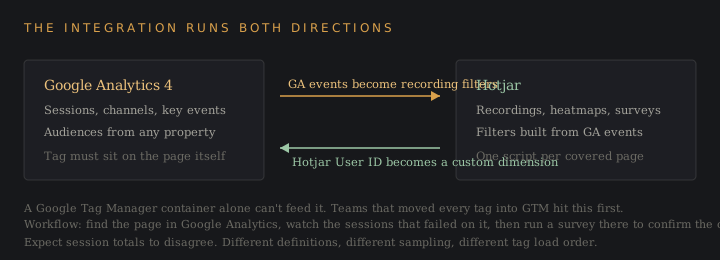
One configuration detail breaks it. The integration needs the Google Analytics tag installed directly on the website; a Google Tag Manager container alone can't supply the data the integration reads. Teams that moved every tag into Google Tag Manager years ago hit this first.
Used together, Hotjar and Google Analytics run one workflow in one direction. Use Google Analytics to find the page where conversion rates dropped, watch recordings of the sessions that failed on it, then run a survey there to confirm the cause. Google Analytics narrows the search and Hotjar helps explain the result, which is how Hotjar and Google Analytics produce insights neither one reaches alone.
Expect the metrics to disagree. The two tools count sessions on different definitions and sample differently, so page views in one won't reconcile to the other. Treat Google Analytics as the system of record for volume & Hotjar as the evidence for user behavior.
↑ COMPARISONConsent, data residency and the European rulings
Four European regulators have found Google Analytics use unlawful. Austria's Datenschutzbehörde ruled on 13 January 2022 that a website's use of Google Analytics breached GDPR Chapter V. France's CNIL followed on 10 February 2022, Italy's Garante on 23 June 2022, and Denmark's Datatilsynet published guidance on 21 September 2022 saying the platform can't be used without added transfer safeguards.
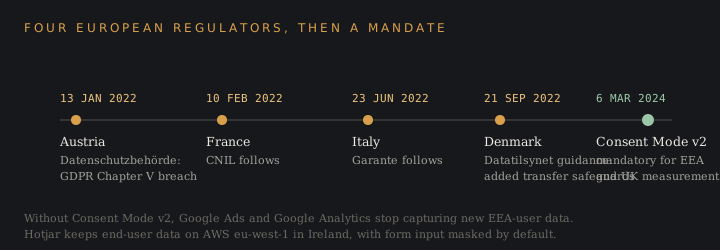
Google Consent Mode v2 became mandatory on 6 March 2024 for websites serving ads to or measuring EEA and UK users under the Digital Markets Act, and both Google Ads and Google Analytics stop capturing new EEA-user data without it.
Hotjar's posture differs in one measurable way: end-user data sits on AWS eu-west-1 in Ireland. Keyboard and form input is suppressed by default and rendered as asterisks, and fields have to be explicitly whitelisted with a data-hj-allow attribute before anything is recorded. Numeric sequences resembling card or phone numbers are suppressed even with numeric text suppression switched off.
Contentsquare holds SOC 2 Type II, ISO 27001, ISO 27017, ISO 27018 and ISO 27701, publishes a subprocessor list, and offers a DPA as part of its terms. On the Google side, standard GA4 carries no SLA at all; the 99.9% collection SLA and its 25% fee credit apply only under an active 360 contract.
What it costs to leave either platform
Hotjar's exit terms are published and worth reading before you sign. New Growth accounts get a 30-day money-back guarantee with a full refund. Cancel after day 30 and you're charged to the end of the current billing cycle, which on an annual contract means a year from your last payment. You never have to delete the account, since cancelling drops you back to the free tier.
That combination has a sharp edge. Sign an annual Growth plan, decide on day 31 that it isn't working, and you owe eleven more months at a tier you've stopped using. Free trials elsewhere in this category run 14 or 30 days; here the trial and the commitment start on the same date.
Leaving Google Analytics costs nothing in fees and a lot in history. Universal Analytics stopped processing data on 1 July 2023 for standard properties and 1 July 2024 for 360, and the interface plus all historical data for both were removed the week of 1 July 2024. Users who hadn't exported by then lost the record for good.
The lesson generalises to any analytics platform. Get the BigQuery export running on day one, because it's the only route to raw event data you keep, and note that events exported into BigQuery can't be exported out of it again.
Google Analytics alternative shortlists, and the other analytics tools people compare
Searches for a Google Analytics alternative usually mean one of two different things. Some people want a Google Analytics replacement that does the same job with a different privacy posture, which points at Plausible, Fathom, Matomo or Vemetric. Others want the behavioural layer, which points at Hotjar, Microsoft Clarity, Crazy Egg or FullStory. These tools give you session recordings and heatmaps for individual pages. They don't report website-wide metrics.
Microsoft Clarity is the one that changes the maths, because it supplies session recordings and heatmaps free at any volume. A team choosing between several tools on budget alone should price Clarity before Hotjar, then decide if surveys, feedback widgets & 13-month retention are worth $591 a month on one website. Both tools give users the same two artefacts; the difference is what surrounds them.
Crazy Egg sits alongside both powerful tools and meters differently again, charging by tracked pageview with heatmap reports capped per tier. Its Starter plan runs $29 a month billed annually for 5,000 pageviews, 5 heatmap reports and 50 recordings, and every plan carries unlimited domains and unlimited seats with no overage charges.
↑ COMPARISONWhich analytics tool answers which question
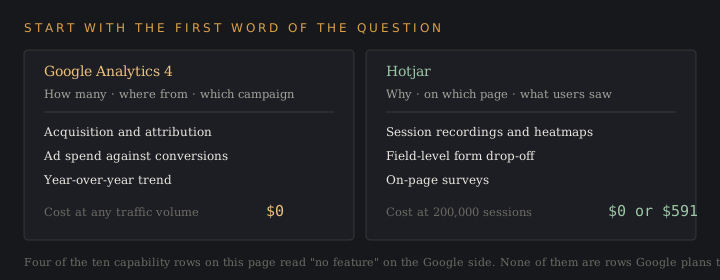
Use Google Analytics when the question starts with how many, where from, or which campaign. Acquisition, attribution, traffic sources, ad spend reconciliation, year-over-year trend & anything that has to reconcile with a warehouse belongs here, and it's free at any scale. It's the right tool for reporting on website traffic across thousands of pages, and it gives a clear picture of your website's performance in aggregate.
Reach for Hotjar when the question starts with why. A conversion rate fell and nobody knows what changed, a redesign shipped and the team wants evidence it helped, a checkout leaks and the leak isn't in the event data. Watch recordings, read the heatmap, ask your users what stopped them. Qualitative data is what turns a metric into a cause, and it's the half of user behavior no dashboard holds.
Running Google Analytics and Hotjar together suits any website with paid traffic and a conversion goal, which describes most commercial sites. Google Analytics narrows a problem to a page and Hotjar tells you what's on it, so the full picture needs both tools.
Skip Hotjar if your website traffic is under 200,000 sessions a month and one month of history is enough, because the free tier already covers those pages and those users. Skip it entirely if you only ship mobile apps, since the Hotjar brand covers web.
What each tool needs installed before you start collecting insights
Google Analytics ships with enhanced measurement switched on, so a single gtag or Google Tag Manager container starts to track page views, scrolls, outbound clicks, site search, file downloads, video plays and the form_start and form_submit pair with no extra code. That covers most websites on day one, and custom events cover the rest.
Hotjar needs one script on every page you want covered. Recordings, heatmaps & surveys all read from that same tracking code, so there's no second install when you add a product, and one snippet is all you track with. The Google Analytics integration is the exception: it wants the Google Analytics tag on the website directly, and a container alone won't feed it.
Then you wait, and the insights land on a schedule you can't shorten. Google Analytics intraday data lands in 2 to 6 hours on the standard tier and about an hour on 360, and daily data is ready in reports by 3:30pm property time the next day. Users who reach for Google Analytics to make same-day decisions run into this constraint before any of the sampling limits.
Hotjar has no equivalent processing delay on recordings, which is part of why the two tools sit together well. One gives you next-day metrics across every page on the site; the other gives you what users did twenty minutes ago on one of them. Both sets of insights matter to different users, on different clocks.
Review scores for both these tools, with sample sizes
Ratings only mean something beside their sample size, so here are the counts as well as the scores for both these tools, read on 8 August 2026.
| Platform | G2 | Capterra | TrustRadius |
|---|---|---|---|
| Hotjar | 4.3 / 5 from 342 reviews | 4.7 from 535, or 4.6 from 543 | 8 / 10 from 364 reviews |
| Crazy Egg | 4.2 / 5 from 128 reviews | 4.4 / 5 from 86 reviews | 8 / 10 from 130 reviews |
The Capterra row carries two readings because two aggregators report Hotjar's listing differently on the same day. Neither is far from the other, and the honest version of that figure is a range.
Read the review counts before the stars. Hotjar's 342 G2 reviews sit in the Session Replay category, so users rating it are rating recordings and heat mapping. Comparing that score against a general analytics platform measures two different products and tells users little about which is the right analytics tool for their website.
Surfer's own fact list for this comparison quotes 298 Hotjar reviews at 4.3. G2 showed 342 on the date above. Review counts climb, which is exactly why a score without a date is worth nothing.
Where the insights in each platform come from
The insights each platform reports rest on different collection rules. Google Analytics samples on read, never on write. Every event your tag sends is stored; the sampling limit applies when an exploration queries more than 10 million of them, so the underlying data survives even when a report approximates. Raise the property to 360 and the same query runs unsampled to 1 billion events.
Hotjar samples on neither. Contentsquare's own feature table lists a 100% analytics collection rate on all four tiers, Free included, so what you get is every session up to your allowance and nothing after it. That's a cleaner promise than a sampled report, with a harder edge when the meter runs out.
Heatmaps in Hotjar are generated from recording data, which has a consequence most users never notice until it bites: delete a recording and it leaves the heatmap too. Purging one user's sessions for a privacy request quietly changes the aggregate picture of those pages.
Retention runs on three different clocks. Recordings and heatmaps hold 365 days from capture. Identified users are purged after 365 days of website inactivity and de-identified users after three months. Survey responses are never deleted automatically at all, so user feedback outlives the session recordings that produced the same insights.
Google Analytics runs two clocks of its own. Event data follows the retention setting, while age, gender and interest data always expire at two months and Google-signals data caps at 26 months whatever else you choose. Teams that use Google Analytics for demographic reporting hit that two-month wall first.
The practical result is that neither set of tools is a long-term archive by default. Google Analytics needs BigQuery for that and Hotjar needs an export, and both decisions cost users less in week one than in year two.
Reading landing pages and user journeys in both tools
Landing pages are where these two tools answer different halves of one question. Google Analytics ranks them by sessions, bounce, and conversion rates, so you know which pages lose users. Hotjar shows the scroll depth and the click map for those same pages, so you know where on them users stop.
User journeys work the same way at a different scale. GA tells you the path across your website, page to page, aggregated over thousands of users. Hotjar's journey analysis, from the Growth tier up, shows the sequence for the sessions you filtered, and every step links back to the recordings behind it.
Website visitors who convert are rarely the interesting ones. Filter to users who reached a product page and left, watch what those users did, then analyze the pattern across twenty sessions.
Advanced features on both sides reward this pairing. Google Analytics audiences can be built from any event property and exported to Google Ads; Hotjar segments can be built from the events Google Analytics sends in. The same cohort of users exists in both tools under two different names, and the qualitative data attached to it only lives on one side.
↑ COMPARISONWho uses each analytics tool day to day
Marketing owns Google Analytics on most websites, and it's where the acquisition insights live. The people in it every week are running acquisition reports, checking which pages convert, reconciling ad spend & exporting audiences, and they need numbers that cover all users on all pages.
Design and CRO own Hotjar. Those users open it with specific pages in mind, watch fifteen sessions, and close it again. Product managers dip in before a redesign and after it, and support teams use it to see what a single user hit when a ticket says the checkout broke.
Engineering usually cares about neither until something is wrong, at which point Google Analytics answers how many users are affected across the website and Hotjar answers what those users saw. Both tools get consulted in that order.
The split shows up in the meters. Google Analytics is priced for coverage of every session on every page, and Hotjar is priced for depth on the pages that matter. A team that tries to run Hotjar across a large website at full coverage is buying the wrong shape of tool, and a team that tries to answer why from Google Analytics alone is reading user behavior off an event count.
Data teams sit outside both. They want the BigQuery export and the raw event stream, and they analyze it in the warehouse where user feedback, revenue & support tickets already live. Neither interface is where those insights get built.
Common Google Analytics and Hotjar questions
Is Hotjar better than Google Analytics?
They measure different things. Google Analytics reports what users did in aggregate; Hotjar shows how individual users behave on the page. Neither replaces the other, and the free tiers mean most teams run both.
What happened to Hotjar?
Contentsquare acquired it in 2021 and Hotjar Ltd merged into the Contentsquare Group on 1 July 2025. The brand and login remain; pricing, signup and billing moved to contentsquare.com.
How much does Hotjar cost per month?
$0 for up to 200,000 monthly sessions. Growth starts at $39 a month billed annually for 7,000 sessions and reaches $591 at 200,000 sessions. Above 240,000 sessions it's a quote.
What is replacing Google Analytics?
GA4 replaced Universal Analytics, which stopped processing data on 1 July 2023 for standard properties. Privacy-focused analytics tools picked up some European users after the 2022 regulator decisions.
Is Hotjar an analytics tool?
Yes, for user behavior and user feedback data. It doesn't do acquisition reporting, so it works beside a web analytics platform.
Can I use both these tools on the same website?
Yes. The official integration passes data both directions, and it needs the Google Analytics tag on-page. A Google Tag Manager-only setup doesn't satisfy that.
Why do the numbers differ between them?
Different session definitions, different sampling & a different tag load order. GA tells you one session total and Hotjar another, so analyze the direction of travel. Compare metrics across weeks; day-level counts drift too much between the two tools to trust.
Does either tool track video plays?
Google Analytics enhanced measurement tracks video engagement for embedded YouTube players. Hotjar shows video plays only as they appear inside a recording.
Can Hotjar predict user behavior?
No. Both these tools are descriptive; neither ships a predictive model of what users will do next.
Figures worth re-checking before you buy
Every price on this page was read on 8 August 2026 from the vendor's own site. Three are worth re-checking, because they move.
Contentsquare's session ladder is generated by an in-page estimator, so the $591 figure at 200,000 sessions can change with no announcement. Hotjar's 365-day retention statement contradicts the legacy tier table beside it in the same help article. And the Analytics 360 entry figure is Cardinal Path's reading of Google's event-tier model, since Google publishes no rate card for it.
Sources, vendor pages: contentsquare.com/pricing and its session estimator; help.hotjar.com on data retention, exports, masking and cancellation; hotjar.com/pricing redirect behaviour; crazyegg.com/pricing.
Google sources: Google Analytics Help on property limits, data retention, sampling, BigQuery export and enhanced measurement; Google Analytics 360 service level commitments; Google's Consent Mode v2 announcement.
Regulator decisions and third-party sources: published decisions of the Austrian Datenschutzbehörde (13 January 2022), CNIL (10 February 2022), Garante (23 June 2022) and Datatilsynet (21 September 2022); Cardinal Path's analysis of the Analytics 360 event-tier pricing model; Vendr's Contentsquare marketplace page; G2, Capterra and TrustRadius listings for Hotjar and Crazy Egg. Accessed 8 August 2026.