Best Product Analytics Tools in 2026: 10 Platforms Ranked on Price, Free Tier and Session Replay
 By Jan Suski. I go deep on every review, checking every number against its source and digging up details other coverage misses, a habit from six years of SEO and link building for tech companies. Bylines at Surfer, Brand24, and Senuto. How the scoring works.
· Prefer this source on Google
Quick comparison of the best product analytics tools
Ten product analytics tools in ranked order, with each one’s free monthly allowance, its entry price and the buyer it fits.
| # | Provider | Free monthly allowance | Entry price | Best fit |
|---|---|---|---|---|
| 1 | PostHog | 1M events, 5K replays | $152.90/mo at 5M events | Engineering-led product teams |
| 2 | Mixpanel | 1M events, 10K replays | $185/mo at 2M events (yearly) | Product managers who build their own reports |
| 3 | Amplitude | 2M events, 10K replays | $64,000 median* | Enterprise product and marketing teams |
| 4 | Statsig | 2M events, 50K replays | $150/mo for 5M events | Teams that ship behind feature flags |
| 5 | FullStory | 30K sessions | $28,240 median* | Support and UX teams debugging sessions |
| 6 | Heap | 10K sessions | $41,220 median* | Teams with no engineer for event tracking |
| 7 | LogRocket | 14-day trial | $176/mo, billed yearly | Front-end engineers chasing errors |
| 8 | Pendo | 500 MAU | $48,500 median* | B2B SaaS teams running in-app guides |
| 9 | Google Analytics 4 | $0, 14-month retention | $0 | Marketing teams measuring web traffic |
| 10 | Userpilot | None | $299/mo for 2,000 MAU | Customer success teams owning onboarding |
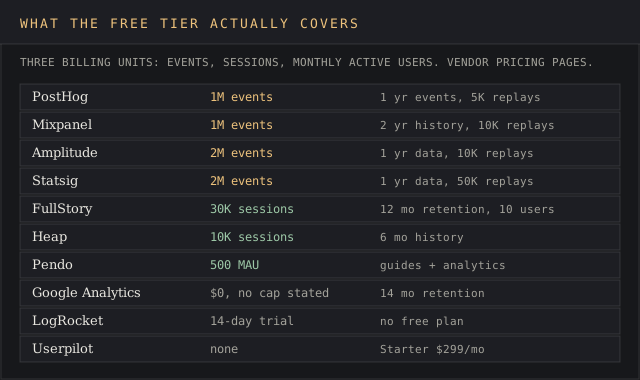
Free allowances use three billing units, counting events, sessions or monthly active users (MAU). The criteria below explain why that difference decides more than the headline price. Medians marked * are anonymized buyer-reported contract values published by Vendr. Checked 17 October 2026.
Where these figures come from
Free allowances and entry prices are each vendor’s own published figure, read in October 2026. The four medians marked * are Vendr’s anonymized buyer-reported contract values for Amplitude, FullStory, Heap and Pendo. Amplitude, FullStory, Heap and Pendo print no paid price on their own pricing pages, and Userpilot publishes no rate for Growth past its starting figure.
Six of these ten tools also appear in the customer analytics tools ranking, which scores them on the wider customer view. Traffic-side tools sit in the visitor intelligence software ranking, and store analytics in the ecommerce analytics ranking.
Product analytics tools record what people do inside a web or mobile app: the screens they open, the buttons they press, the step where they quit. Product teams use that behavioral data to study user behavior through three questions. Which features get used, where do new users drop, and who comes back after week one?
This ranking of the best product analytics tools covers ten product analytics platforms, from $0 tiers to an Amplitude contract with a $64,000 median on Vendr. Every price below links to the vendor's own pricing page or to Vendr's anonymised buyer data, and every user quote links to the review it came from.
It's written for product managers, growth leads and engineers choosing a first product analytics solution, or replacing one whose bill grew faster than the user count. If you need the wider customer view (surveys, CRM data, lifetime value), our customer analytics tools ranking covers that ground.
The timing matters for one reason. Ownership in this category moved twice in eight months: Statsig signed to join OpenAI on 2 September 2025, then became part of Amplitude on 5 May 2026, per Statsig's own announcement page. A contract you sign this year can outlive the roadmap you bought it for, so a multi-year deal with one vendor puts all your eggs in one basket.
Evaluation criteria for the best product analytics tools
Six criteria decide the shortlist, and the first two carry the most weight in the order below. Each one is a test a buyer can run against a vendor's public pages and get a number or a yes or no.
Published price above the free tier
The first test is a printed price for the next million events. PostHog and Statsig print per-event rates, Mixpanel prints monthly totals by volume, and four of the ten send you to sales. The test is the monthly cost at 5 million events, our normalized scenario throughout this page.
Free monthly allowance
This measures how much actual event volume fits before the first invoice. Count it in the vendor's own billing unit, then convert. A 1M-event free plan and a 10,000-session free plan cover different apps, and the devil's in the details, since one session in a busy app can fire dozens of events.
Autocapture on web and mobile
This checks that the SDK records clicks, pageviews and form interactions with no manual tagging. The test is the vendor's own SDK documentation. Automatic capture shortens setup, though a team still needs a naming plan for the events it cares about.
Session replay included
Count the recorded user sessions that come with the analytics plan, with no separate tool to buy. Session replay puts qualitative insights next to quantitative data, and the included count ranges from zero to 50,000 a month across this list.
Raw data out to a data warehouse
The test here is syncing events to Snowflake, BigQuery or Redshift on a self-serve plan. Data warehouse integration lets a data team run SQL against the same product analytics data the dashboards show. The test is yes on a self-serve plan, yes on enterprise only, or no.
Ownership changes in the past 24 months
Count the acquisitions, and keep an eye on the acquirer's own announcements. Two changes of owner inside a contract term mean two roadmaps you didn't evaluate. The test is a press release on the vendor's or acquirer's domain.
The 10 best product analytics tools, ranked
Each entry below follows one shape, so the product analytics platforms can be compared line by line: who it fits, what it costs, what users say, and the number that sets its rank.
PostHog
Best fit
Product teams with at least one engineer who wants analytics, session replay, feature flags and a data warehouse on one bill.
PostHog bundles product analytics, session replay, feature flags, surveys and a data warehouse under one free plan. That plan covers 1 million analytics events, 5,000 recordings, 1 million flag requests and 1,500 survey responses a month, per PostHog's pricing page. The same page claims "600k+ companies" use it and that 97% pay nothing.
The free tier keeps events for one year and recordings for one month. Pay-as-you-go stretches that to seven years and 90 days, and lifts the project limit from one to six. Head-to-head detail sits on our PostHog vs Amplitude and PostHog vs Mixpanel pages.
Key features
- Autocapture on the JavaScript SDK records $pageview, $pageleave and clicks on a, button, form, input, select, textarea and label tags (autocapture docs)
- Rage-click detection fires a $rageclick event after three clicks close together
- Data warehouse sync from Stripe, Postgres, Snowflake, BigQuery and Redshift, free for the first 1M rows a month (data warehouse page)
- Feature flags and experiments billed on the same flag-request meter
- SQL access to event data
Pricing
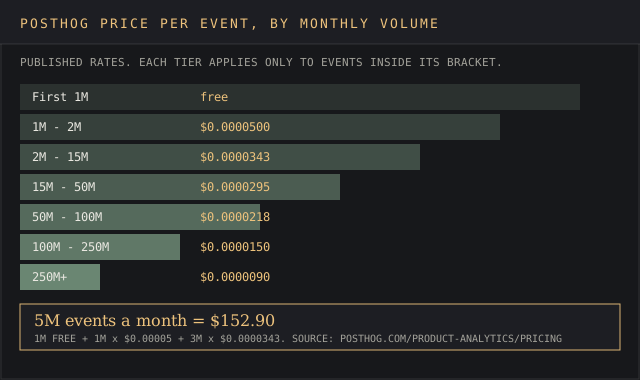
After the free million, PostHog's product analytics pricing charges $0.00005 an event up to 2M, then $0.0000343 up to 15M, falling to $0.000009 past 250M. At 5 million events a month that's $152.90, the bill our PostHog pricing report breaks down tier by tier. Replay, flags and surveys meter separately.
Pros
- Per-event rates are published for every volume bracket
- Warehouse sync on the free plan, 1M rows a month
- Seven-year event retention on pay-as-you-go
- Product analytics tools, replay, flags, surveys and warehouse sit on one bill
Cons
- 5,000 free recordings, half of Mixpanel's and Amplitude's 10,000
- Free recordings expire after one month
- SQL-first workflows suit engineers better than non technical users
That last con hits the nail on the head for some reviewers. A research and development engineer at a 1-10 person company wrote on TrustRadius on 8 September 2026 that "Using SQL to query the data is quite confusing." A software developer at Backpack Pay gave the flags the opposite verdict five days earlier:
"PostHog Feature Flags helps with this, as we can define feature flags, designate what % it will go out to"
TrustRadius review, software developer, Backpack Pay, 3 September 2026
Why it’s ranked #1. PostHog syncs warehouse data on its free plan, 1M rows a month, where Mixpanel adds warehouse connectors only on paid event-based plans. It publishes a $152.90 price at 5M events, which no tool below it except Statsig matches.
Mixpanel
Best fit
Product managers who want to build funnels and cohorts themselves, on a price they can read before talking to sales.
Mixpanel's product analytics bills on events and prints the monthly total for each volume step. Mixpanel's pricing page shows $100 a month for 1.5M events on yearly billing ($140 on monthly), $185 for 2M and $1,635 for 20M. The free plan covers 1 million events, 10,000 session replays and unlimited seats, with two years of history on every plan.
Funnels, retention charts and cohort analysis sit at the center of Mixpanel's product analytics, built for event based tracking. More detail sits on our Mixpanel review and the Hotjar vs Mixpanel comparison.
Key features
- Autocapture on all plans, web plus Android v8.10.0+, iOS v6.6.0+, React Native v3.7.0+ and Flutter v2.15.0+ (autocapture docs)
- Dead-click and rage-click events labelled "[Auto] Dead Click" and "[Auto] Rage Click"
- Warehouse Connectors for Snowflake, BigQuery, Databricks, Redshift and Postgres (docs)
- Growth plan replays from 20,000 up to 500,000 a month
- Enterprise ceiling of 1 trillion events a month
Pricing
The published ladder runs from $0 to $1,635 a month at 20M events. Past that, Vendr reports a $40,307 median annual contract across 225 purchases, ranging from $13,200 to $120,782, from anonymised buyer data.
Pros
- Monthly totals printed for each event step up to 20M
- Two years of history at $0
- Autocapture covers four mobile SDKs
- Unlimited seats on every plan
Cons
- Warehouse Connectors arrive only as an add-on on paid event-based plans
- Replay retention is 30 days on Free and Growth
- The jump from $185 at 2M to $1,635 at 20M can cost an arm and a leg on a growing app
A former Mixpanel employee, now a customer, called a spade a spade on Hacker News on 22 May 2024: "I wish Mixpanel wasn't this expensive for a few 1000 users." An engineer at a 10,001+ employee finance firm summed up the setup on TrustRadius in March 2022 in four words: "Very steep learning curve."
Why it’s ranked #2. Mixpanel publishes $185 at 2M events, where Amplitude prints no rate past its free 2M. It loses to PostHog on warehouse sync, which Mixpanel limits to paid plans against PostHog's free 1M rows.
Amplitude
Best fit
Enterprise product and marketing teams that want behavioral analytics, experimentation and replay from one vendor and will negotiate the contract.
Amplitude's free tier is the largest event allowance on this list next to Statsig's: 2 million events a month, 10,000 session replays, one year of data and unlimited team members, per Amplitude's pricing page. It bills on events, and the Plus plan caps at 700,000 MTUs or 70 million events.
Amplitude also owns Statsig since 5 May 2026. See our Amplitude review and the Hotjar vs Amplitude page for the qualitative side.
Key features
- Autocapture records sessions, page views, clicks, form interactions and file downloads on the Browser SDK, plus installs and screen views on iOS Swift and Android-Kotlin (autocapture docs)
- Free tier includes one Feature Experimentation and one Web Experimentation test, with unlimited feature flags
- Plus plan carries 20 behavioral cohorts and heatmaps
- Enterprise replays rise to 50,000 a month with a one-business-day support SLA
Pricing
Plus "starts at $0" with the first 2M events free and a card on file. Growth and Enterprise are custom. Vendr's buyer data puts the median contract at $64,000 a year over 422 purchases, ranging from $24,750 to $379,933, the highest median on this list.
Pros
- 2M free events a month, double PostHog's and Mixpanel's
- Experiments and unlimited flags on the free tier
- Autocapture on web, iOS and Android
Cons
- No per-event rate printed past the free tier
- $64,000 median contract, $23,693 above Mixpanel's
- Free-plan replays kept for one month
- Roadmap now absorbs Statsig, acquired 5 May 2026
The data portability con comes from users. A team lead at a 51-200 employee IT company wrote on TrustRadius in July 2022: "It's really difficult to move data in and out of Amplitude." A marketing manager at an 11-50 person firm liked the entry point, writing that "The free tier is perfect for a startup looking to try it and get insight before scaling to a bigger plan" (TrustRadius, July 2022).
Why it’s ranked #3. Amplitude gives 2M free events, double Mixpanel's, but publishes no rate past them, so it ranks below Mixpanel's printed $185 at 2M. It beats Statsig on ownership, with zero changes against Statsig's two since September 2025.
Statsig
Best fit
Engineering teams that ship every feature behind a flag and want analytics attached to each experiment.
Statsig is an experimentation platform with product analytics and replay built in, so user behavior and test results share one dataset. Statsig's pricing page gives the free Developer tier 2 million events and 50,000 session replays a month, the largest free replay count on this list. Pro costs $150 a month with 5 million events included and $0.05 per 1,000 events above that.
On ownership the jury's still out, because Statsig announced a definitive agreement to join OpenAI on 2 September 2025, and the same page now carries a note that Amplitude acquired it on 5 May 2026.
Key features
- Developer tier: 2M events, 50,000 replays, one year of analytics data
- Pro: 5M events, 100,000 replays, unlimited analytics retention
- Warehouse-native deployment on Snowflake, Databricks, BigQuery, Redshift, Athena and Fabric (Enterprise)
- Overages billed the month after they occur
Pricing
$0 on Developer, $150 a month on Pro for one project, custom on Enterprise with volume discounts. At our 5M-event scenario Statsig is the cheapest published price in the ranking, $2.90 under PostHog.
Pros
- $150 a month covers 5M events and 100,000 replays
- Published overage rate of $0.05 per 1,000 events
- Unlimited analytics retention on Pro
Cons
- Two ownership changes announced in eight months
- Warehouse-native deployment sits on Enterprise only
- Each Pro subscription covers one project
- Past 2M events on Developer, Metric Lift computations stop
Users who switched describe consolidation. A product management professional at a 1001-5000 employee company wrote on TrustRadius in June 2025 that "it has effectively replaced two other products in the process - Mixpanel and Launch Darkly."
Why it’s ranked #4. Statsig's $150 for 5M events undercuts every published price here, yet two ownership changes since September 2025 drop it below Amplitude. It beats FullStory on price, $150 published against a $28,240 Vendr median.
FullStory
Best fit
Support and UX teams that start from a recording of the user session and work back to the metric.
FullStory bills on sessions and leads with session replay. FullStory's pricing page describes FullstoryFree as a permanent plan with 30,000 sessions a month, 12 months of data retention and up to 10 users, with signup open without a card. Business, Advanced and Enterprise are all "Request pricing & demo." Our FullStory review covers the plan split.
Key features
- Session replay, basic analytics and debugging tools on the free tier
- Funnels listed in the plan comparison table
- Anywhere: Warehouse product syncs behavioral data to a warehouse or cloud storage
- Separate Workforce product for internal-tool analytics
Pricing
No published paid prices. Vendr reports a $28,240 median annual contract over 455 purchases, from $10,000 to $115,936, based on anonymised buyer data.
Pros
- 30,000 free sessions a month, the largest session allowance here
- 12 months of retention on the free tier
- Lowest Vendr median among the four quote-only vendors
Cons
- Dashboards need a paid upgrade
- No paid price published
- Free tier stops at 10 users
"It's a great solution, but their pricing options need improvement, especially when free options exist."
TrustRadius review, C-level executive, 11-50 employees, 20 April 2023
A customer service analyst at a 501-1000 employee company named the reason teams keep paying: "The most helpful feature we utilize is the session replay" (TrustRadius, June 2024).
Why it’s ranked #5. FullStory's 30,000 free sessions triple Heap's 10,000, and its $28,240 Vendr median sits $12,980 under Heap's. It ranks below Statsig because it publishes no paid price at all.
Heap
Best fit
Teams without engineering time for manual event setup, who want every click recorded from day one and labelled later.
Heap records interactions automatically and lets teams label events after the data arrives, through Visual Event Labeling, so nobody writes a tracking plan from scratch on day one. Contentsquare completed its acquisition of Heap on 7 December 2023. Heap's pricing page lists four plans: Free, Growth, Pro and Premier.
Key features
- Autocapture, Visual Event Labeling and Custom Event Properties on all four plans
- Free tier: 10,000 sessions a month, 6 months of historical data, SSO
- Heatmaps, session replay and error analysis as add-ons on Pro and Premier
- A web session ends after 30 minutes of inactivity, a mobile session after 5
Pricing
Growth gives an estimate after you install the snippet, Pro and Premier are custom. Vendr's data puts the median at $41,220 a year over 191 purchases, from $13,000 to $154,798.
Pros
- Every interaction recorded from the first page load
- Events can be defined after the data arrives
- SSO on the free tier
Cons
- Over the monthly limit, you must upgrade before viewing your data again
- Session replay is an add-on, on Pro and Premier only
- Free history stops at 6 months
A senior project manager at a 201-500 employee firm described the payoff on TrustRadius in May 2025:
"Heap solves this issue drastically by providing auto capturing of events which significantly reduces manual intervention."
TrustRadius review, senior project manager, E2E Telelink, 27 May 2025
Why it’s ranked #6. Heap's 10,000 free sessions beat LogRocket, which offers a 14-day trial and no free tier. It trails FullStory's 30,000 sessions and pays for replay as an add-on.
LogRocket
Best fit
Front-end engineers who need replay, error monitoring and logs on the same screen.
LogRocket prices on sessions captured and publishes a starting price. LogRocket's pricing page starts at $176 a month on an annual plan, with a Conditional Recording option near $860 a month that captures about 40% of sessions. Analytics events, errors and logs are unlimited on every plan, which kills two birds with one stone for teams that would otherwise buy replay and error monitoring separately.
Key features
- Product analytics with clickmaps, heatmaps, rage-click maps, path analysis and conversion funnels on Core
- Session replay and error monitoring on every plan
- Pro adds AI session summaries and funnel insights, and is required past 100,000 sessions a month
- Streaming Export add-on for event-level exports
Pricing
$176 a month to start, priced by sessions, seats, retention and add-ons. The calculator defaults to 25,000 sessions. Vendr reports a $26,250 median contract across 78 purchases, from $8,076 to $132,375.
Pros
- Published $176 starting price
- Unlimited analytics events on every plan
- Lowest Vendr median in this ranking
Cons
- A 14-day trial is the only free option
- Pro becomes mandatory at 100,000 sessions
- Retention length changes the price, with no figures published
A customer service analyst at a 51-200 employee company wrote on TrustRadius in November 2023 that LogRocket was "Mainly utilised to debug issues for users before having to escalate to engineering." The same reviewer added: "It's a shame recordings are capped to the previous month."
Why it’s ranked #7. LogRocket publishes a $176 starting price where Pendo publishes none, which puts it above Pendo. It falls below Heap because it has no free tier, only a 14-day trial.
Pendo
Best fit
B2B SaaS product teams that want analytics and in app guidance from one snippet.
Pendo pairs product analytics and user behavior data with in-app guides, NPS surveys and roadmaps. Pendo's pricing page lists a Free tier for up to 500 monthly active users with analytics, guides and Pendo-branded NPS. Base, Core and Ultimate are "Request pricing," and Core adds session replay.
Key features
- In-app guides with walkthroughs, pop-ups and helper text on web and mobile applications
- Session replay on Core and Ultimate
- Ultimate adds Sentiment, Orchestrate, Listen and Data Sync
- Pendo Novus, a free beta with auto-instrumentation via GitHub
Pricing
Billed on MAU, defined as a unique visitor active in the last 30 days. Price per MAU falls as volume rises, a blessing in disguise for apps that grow into a larger contract. Vendr puts the median at $48,500 a year over 587 purchases, from $18,550 to $150,832.
Pros
- Guides, surveys and analytics share one install
- Number of apps or sessions doesn't change the price
- 587 Vendr purchases, the largest sample on this list
Cons
- 500 MAU free cap
- Over the cap, no new guides, NPS surveys or segments until you upgrade
- $48,500 median, second only to Amplitude
A product management strategist at a 1001-5000 employee company called it "Great for in-app content of any kind, including pop-ups, walkthroughs, and helper text" (TrustRadius, July 2025). An IT manager at a company of the same size wanted fewer interruptions:
"I also wish there were some sort of happy compromise between a static guide that interrupts the user upon login"
TrustRadius review, IT manager, 1001-5000 employees, 2 July 2025
Why it’s ranked #8. Pendo includes session replay on Core, which Google Analytics 4 lacks on any tier. It loses to LogRocket on price disclosure, $176 published against a $48,500 Vendr median.
Google Analytics 4
Best fit
Marketing teams that need traffic and acquisition data for $0, with product questions as a second job.
Google describes Analytics as giving you "the tools, free of charge" on its Marketing Platform page. The standard property keeps data for 2 or 14 months, against up to 50 months on Analytics 360, per Google's 360 comparison. Explorations sample above 10 million events per query on standard, and 1 billion on 360.
GA4 measures traffic and conversions well, and its user behavior reports stop at the page and event level. It records no session replay and stops at 50 event-scoped custom dimensions per property. Our Google Analytics vs Hotjar page covers the replay gap, and the web analytics pricing report covers GA4's paid tier.
Key features
- Free daily BigQuery export of up to 1 million events
- 50 event-scoped custom dimensions and 50 custom metrics per property
- Direct link to Google Ads for marketing analytics
- Explorations for funnels and path analysis
Pricing
$0 on the standard property. Analytics 360 is a contract, with no price on Google's support page.
Pros
- $0 with BigQuery export included
- Native Google Ads attribution
- 14 months of retention at no cost
Cons
- No session replay
- Sampling above 10M events per exploration
- 50 event-scoped custom dimensions per property, against 125 on 360
A marketing executive at a 201-500 employee company listed the sampling limit as a con on TrustRadius in March 2025: "Free version does not show all data (sampled)." A dashboarding consultant at Dataligent Services Analytiques wrote that GA4 is "available at almost zero cost of businesses" (TrustRadius, March 2025).
Why it’s ranked #9. GA4 costs $0 with a 1M-event daily BigQuery export, which beats Userpilot's $299 entry price with no free tier. It ranks below Pendo for its zero session replays.
Userpilot
Best fit
Customer success teams that own onboarding flows and want feature adoption numbers next to the in-app guides they build.
Userpilot sells in-app onboarding, with product analytics on its upper plans. Userpilot's pricing page starts Starter at $299 a month for up to 2,000 MAU, with usage trends only. Growth starts at $849 a month and adds advanced product analytics plus 5,000 free session replays a month.
Key features
- In-app engagement flows, checklists and tooltips on Starter
- Resource Center and advanced in-app surveys on Growth
- Advanced product analytics on Growth and Enterprise
- 5,000 free replays a month on Growth
Pricing
$299 a month on Starter, from $849 on Growth, custom on Enterprise. The page doesn't say how Growth scales with MAU.
Pros
- Published prices on two of three plans
- Guides and feature adoption analytics in one tool
- Replays bundled on Growth
Cons
- No free tier
- Starter limits analytics to usage trends
- 2,000 MAU on a $299 plan
The one review on TrustRadius, from a customer success engineer at PingPlotter, named the admin side: "The Web App used to manage the content and subscription is pretty slow" (TrustRadius, December 2022).
Why it’s ranked #10. Userpilot charges $299 a month for 2,000 MAU with no free tier, while GA4 costs $0. Its published $299 and $849 prices still beat the quote-only onboarding tools left off this list.
What product analytics tools do
Product analytics software turns event data from user sessions into answers about user behavior. Most product analytics tools share five reports, and the vendor differences sit in volume, price and how the data arrives.
- Funnel analysis maps a multi-step path, such as signup to first project, and shows where users drop
- Cohort analysis groups users by a shared trait or start date to track retention and churn
- Retention analysis measures how often users return in week 1, week 4 and week 12
- User segmentation splits users into specific user segments by plan, country or feature usage
- Session replay and heatmaps visualize user interactions to diagnose usability issues
Retention analysis and cohort analysis together show which habits keep users coming back, and funnel reports show where users drop on the way there. Behavioral data from these reports also feeds user engagement charts, so user interactions with each feature show up as a trend line.
Experimentation is the sixth job. Statsig, Amplitude and PostHog run A/B tests against the same events, so a product change gets measured on the metric it was meant to move.
The payoff is measurable when the setup is right. G2's product analytics write-up dated 8 June 2026 states that "the average user adoption rate is just 57%" and that "the payback period averages just 10 months," citing G2 Data. Those figures describe G2's reviewer base, which our G2 pricing report explains.
All of it depends on data capture. Analyzing user behavior on a screen the SDK never loaded on returns nothing, so the first week of any product analytics software rollout goes to checking that every page and screen fires events, including mobile analytics on iOS and Android builds.
The best metrics to track depend on the product's business model. A seat-based B2B app watches weekly active accounts and feature adoption. A consumer app with ads watches daily active users and session length. Pick key performance indicators before picking tools, or the dashboard will measure whatever autocapture recorded first.
How product teams use product analytics data
Product analytics data answers one question per report, and teams that get value from the best product analytics tools write the question first. A product manager asking why trial users stall pulls a funnel. A customer success team asking which accounts will churn pulls feature usage per account, which is feature usage tracking at the account level.
Analyzing user behavior starts with event tracking. Every user action, from a button press to an export, lands as an event with properties, and product analytics platforms group those user actions into sessions, users and accounts. That lets a team track user actions across web and mobile apps in one report.
Mobile analytics works the same way on mobile apps, with screen views in place of pageviews. Amplitude, Mixpanel and Pendo document SDKs for mobile applications, so users interact with one event schema on every device.
Quantitative data from product analytics platforms shows where users interact and quit, and qualitative insights show why. Session replay supplies the second half through actual user sessions, and in-app surveys add user feedback and customer feedback in the user's own words. Together, quantitative and qualitative insights point at the same screen, so a team can identify friction points from both sides.
Engagement metrics close the loop on user behavior and user engagement in product analytics tools. Daily active users, week-4 retention and customer retention by cohort show if a fix moved user engagement, and customer satisfaction scores from NPS surveys, which Pendo includes on its free tier, sit next to them.
Data driven decision making needs one more step, turning product analytics software output into actionable insights that analytics tools alone can't ship.
A funnel showing the step where people quit is a finding, and a ticket to rebuild that step with the drop rate as its success metric turns it into one of the actionable insights a roadmap can use. Product analytics turns user behavior into that ticket. Product teams comparing the best product analytics tools should test that path in a trial, from chart to ticket.
How to choose a product analytics solution for technical and non technical users
Start with who will build the reports, and read the room before buying. Non technical users need point-and-click charts, autocapture and in app guidance from the vendor. Engineering-led product teams can work with SQL, a data warehouse and a separate tool for each job.
- Teams with a data warehouse and SQL skills fit PostHog or Statsig
- Product managers who build reports themselves fit Mixpanel or Amplitude
- Teams with no engineer for data capture fit Heap's autocapture
- Support teams that start from a replay fit FullStory or LogRocket
- Onboarding owners fit Pendo or Userpilot, the two tools built around app guidance
Advanced analytics features follow the same split. LogRocket's Pro plan adds AI powered session summaries and funnel insights, and that AI powered layer reads the same user behavior data the charts do. Advanced analysis such as SQL over raw events stays with PostHog, Statsig and any tool that syncs to a warehouse.
A digital analytics platform like GA4 covers traffic for marketing teams, and pairing it with one of the product analytics software options above covers user analytics inside the app. Before signing, confirm the vendor can track user interactions on both web and mobile, and name the 10 events that define success for your product.
Event-based, session-based and MAU-based pricing
Three billing units run through this list, and they reverse the price order depending on how your app behaves: events count actions, sessions count visits and MAU counts people.
Take our normalized scenario for product analytics tools, 5 million events a month. PostHog charges $152.90 and Statsig $150. Mixpanel's published ladder sits between $185 at 2M and $1,635 at 20M. A session-billed tool like FullStory charges the same for a session that fires 3 events as for one that fires 300, which favors event-heavy apps. An MAU-billed tool like Pendo charges the same however active each user is.

Quote-only pricing hides the real spread. Vendr's medians run from LogRocket's $26,250 to Amplitude's $64,000, and the top of Amplitude's range is $379,933. Our web analytics pricing report tracks the same pattern for traffic tools.
Google Analytics adds a fourth pricing pattern, $0 with exploration sampling above 10M events, and Google Analytics 360 as the paid contract above it.
Ask any vendor for actual event volume from a two-week trial before you sign. Read between the lines of any sales rep's estimate, because an annual contract priced on a guess bills the overage the month after. That's how a $185 Mixpanel bill becomes a four-figure one in a quarter.
Autocapture and manual event tracking
Autocapture records every click, pageview and form interaction without manual tagging. Heap includes it on all four plans, and PostHog, Mixpanel and Amplitude now document it in their SDKs. Manual event tracking means an engineer writes a track() call for each event a product manager names.
Automatic capture is faster to set up and keeps historical data, because events defined next month can still be analyzed against last month's clicks. Manual tagging gives clearer events. A custom event called "Invoice Sent" carries properties autocapture can't infer, such as invoice value.
Most teams end up with both. Heap's Visual Event Labeling turns an autocaptured click into a named event with no code change, so a team can track feature usage on launch day without waiting for an engineer.
Combining them is common across product analytics platforms, because behavioral data from autocapture and named events lands in the same tables. Autocapture covers exploration and the long tail, while a short tracking plan of named events covers the metrics the business reports on. Write that plan before installing anything, because a stitch in time saves nine.
Product analytics compared with Google Analytics and web analytics
Google Analytics reports where visitors came from and which pages converted, while product analytics tools follow signed-in users through features. GA4 is a traffic tool with event tracking added, and Mixpanel and Amplitude start from the user and the event. For marketing teams GA4 is a jack of all trades, covering acquisition, conversions and Google Ads in one free property.
The question of what is replacing Google Analytics has two answers. Marketing teams replacing GA usually move to a privacy-focused web analytics tool. Product teams replacing GA move to a product analytics platform, because they need user-level funnels and cohorts. The Google Analytics vs Hotjar page shows how teams pair GA4 with a qualitative tool, and our Hotjar review covers that half.
GA4 standard is free, and Google still calls it "free of charge." The paid tier is Analytics 360, which lifts retention to 50 months and the exploration sample to 1 billion events.
Free product analytics tools and what the free tiers leave out
Eight of the ten product analytics tools have a free tier, each capped in its own billing unit. Here's what each one drops.
- PostHog: 1M events, 5,000 recordings kept one month, one project
- Mixpanel: 1M events, 10,000 replays kept 30 days
- Amplitude: 2M events, one experiment of each type
- Statsig: 2M events, Metric Lift stops past 2M
- FullStory: 30,000 sessions, 10 users, no dashboards
- Heap: 10,000 sessions, 6 months of history
- Pendo: 500 MAU
- Google Analytics 4 samples explorations above 10M events
Pendo's 500 MAU cap is the smallest here, so an app with 3,000 users outgrows it on the first day. The event-based plans stretch furthest for apps with many users and few actions each. For a large consumer app, every free tier on this list is a drop in the bucket.
How to run a product analytics trial
Run two product analytics tools in parallel for 14 days on the same traffic, so both track user actions and user interactions from the same users. That's LogRocket's whole free trial window and fits inside every free tier above.
- Write the five questions you need answered, such as week-4 retention for users who invited a teammate
- Install both SDKs with autocapture on, plus 10 manually named events
- Build the same funnel and the same retention chart in each
- Export one day of raw data to your data warehouse, or try to
- Read the actual event volume each tool counted, then price it at 12 times that
Step 4 catches the data portability con early. Step 5 nips billing-unit surprises in the bud, before a contract does. Give the trial to the person who'll use it daily, product managers or customer success, and keep the engineers on setup.
Ownership changes in product analytics, 2023 to 2026
Three deals reshaped this list. Contentsquare completed its purchase of Heap on 7 December 2023. Statsig signed to join OpenAI on 2 September 2025. Statsig's page now notes Amplitude acquired it on 5 May 2026.
Each deal leaves a product running under a new owner's roadmap. Heap's pricing page now sits inside Contentsquare's product line, and Statsig's pricing page still lists its own Developer, Pro and Enterprise tiers. Buyers signing multi-year contracts should get a written commitment on pricing and data export through the term, straight from the horse's mouth. Our product intelligence guide covers the wider category these tools feed.
Product analytics tools FAQ
What are product analytics tools?
Product analytics tools are software that records user actions inside a web or mobile app and reports them as funnels, cohorts, retention charts and replays. PostHog, Mixpanel and Amplitude are the three most-compared examples.
Which product analytics tool is the best?
The best product analytics tool on this list is PostHog, which ranks first on a published $152.90 price at 5M events and free warehouse sync. Mixpanel suits product managers who want published monthly totals and two years of history on the free tier.
Is GA4 free or paid?
GA4's standard property is free. Analytics 360 is the paid version, with 50 months of retention against 14 on standard.
What are some good free data analytics tools?
For product data: PostHog (1M events), Amplitude (2M events), Statsig (2M events) and FullStory (30,000 sessions). For data analysis beyond product usage data, our data analysis tools ranking covers spreadsheet and statistics tools, and the data dashboard tools ranking covers BI.
What are examples of analytics platforms?
Product analytics platforms include PostHog, Mixpanel, Amplitude and Heap. Web traffic platforms include Google Analytics, and session replay platforms include FullStory and LogRocket. Our ecommerce analytics ranking covers store-focused analytics tools.
What are the four types of analytics?
Descriptive (what happened), diagnostic (why), predictive (what will happen) and prescriptive (what to do). Product analytics tools mostly cover the first two, with replay of user sessions doing the diagnostic work as users interact with each screen.
Are product analysts in demand?
Every tool on this list needs someone to write the tracking plan and read the funnels. Our SaaS statistics report tracks the software market those analysts work in.
Bottom line
Among the best product analytics tools here, PostHog is the pick for engineering-led product teams: $152.90 a month at 5M events, published, with warehouse sync free up to 1M rows. Mixpanel fits product managers who build their own reports and want two years of history on a plan with printed prices. Amplitude fits enterprises that will negotiate toward its $64,000 median for experimentation and replay from one vendor.
For the best product analytics on a budget, Statsig has the cheapest published price, but two ownership changes in eight months argue for a short contract. FullStory and LogRocket suit teams that start from the recording, and Heap suits teams with no engineer for tagging. Pendo and Userpilot belong to B2B teams whose real job is onboarding, and GA4 stays the free baseline for marketing teams.