Data Dashboard Tools: 10 Platforms Ranked by Price, Sources and Refresh (2026)
 By Jan Suski. I go deep on every review, checking every number against its source and digging up details other coverage misses, a habit from six years of SEO and link building for tech companies. Bylines at Surfer, Brand24, and Senuto. How the scoring works.
· Prefer this source on Google
Quick comparison of the best dashboard tools
The table follows the ranked order below. The third column carries the one documented limit that decides fit for each product; key features sit in each entry.
| # | Tool | Documented limit that matters | Entry price | Free tier or trial | Best fit |
|---|---|---|---|---|---|
| 1 | Microsoft Power BI | 8 refreshes a day, 1 GB model on Pro | $14/user/month, billed yearly | Free account, Desktop only, no sharing | Microsoft 365 companies with a data team |
| 2 | Domo | 1,000+ pre-built connectors | Credit-based; Vendr median $50,000/year* | 30-day trial, unlimited users | Enterprises consolidating many SaaS sources |
| 3 | Looker Studio (Data Studio) | 1,400+ data sources | $0; Pro $9/user/project/month | No charge for creators and viewers | Google Analytics and Google Ads reporting |
| 4 | Grafana Cloud | 10k metric series, 14-day retention free | $19/month platform fee plus usage | Free forever, 3 active users | Server and app monitoring |
| 5 | Sigma | Vendr range $15,585 to $145,339 | Quote only; Vendr median $64,941/year* | Free trial, length unpublished | Snowflake and Databricks shops |
| 6 | Zoho Analytics | 0.5 million rows on Basic | €24/month for 2 users (EU price) | 2 users, 10K rows | Zoho CRM and small finance teams |
| 7 | Databox | 5 sources, hourly sync on Analyst | $71/month, billed yearly | 3 sources, daily sync | Small marketing teams tracking KPIs |
| 8 | Geckoboard | 2 dashboards on Essentials | $79/month, billed yearly | 14-day trial | Office TV screens with live numbers |
| 9 | AgencyAnalytics | 85+ marketing integrations | $20/client/month, billed yearly | 14-day trial | Agencies reporting to multiple clients |
| 10 | Whatagraph | 1 credit per connected source | €999/month, billed yearly | Demo only | Large agencies with blended ad data |
Medians marked * are anonymized buyer-reported contract values published by Vendr. Everything else is the price the vendor publishes itself.
Where these figures come from
Prices, connector counts, refresh caps and free-tier limits are each vendor's own published figures, read off its pricing or documentation page in October 2026. Zoho Analytics shows euro prices to an EU visitor and Whatagraph lists its Max plan in euros, so both rows stay in euros. The two medians marked * are Vendr's anonymised buyer-reported contract values for Domo and Sigma.
User quotes come from TrustRadius and link to the review they're taken from. Domo publishes no credit rate, Sigma publishes no plan price and no trial length, and Whatagraph's Prime plan is custom, so no row claims a figure for any of them.
Power BI and Looker Studio also rank on the data analysis tools ranking, scored there as analysis software. Power BI ranks again on the location intelligence platforms ranking, and Grafana Labs ranks on the operational intelligence platforms ranking. This page ranks ten tools on price, sources, refresh and free-tier caps.
Dashboard tools turn rows in a warehouse, a CRM or an ad account into charts that refresh on a schedule, so a sales lead or an operations engineer reads the number without asking an analyst for it. Prices in the category run from Looker Studio's no-charge tier to a Vendr median of $64,941 a year for Sigma.
This page ranks 10 dashboard software products and data visualization tools against five tests a buyer can run in an afternoon: published entry price, documented data sources, scheduled refresh cadence, free-tier caps and contract size. Every figure links to the vendor's own pricing or documentation page, checked in October 2026.
It's written for three buyers: a data team picking one platform for internal analytics, marketing teams reporting to multiple clients, and engineers who need live infrastructure metrics on a wall screen. Each group lands on a different tool, and the ranking says which.
Why now. Microsoft prices Power BI Pro at $14 per user per month, Google's own product page lists the Pro edition of its free dashboard at $9 per user per project per month, and Domo has moved to credit-based billing with unlimited users. Three of the best-known dashboard tools changed how they bill in the same cycle, so a price comparison from 2025 misses the mark.
If you're after a wider analysis stack (Tableau, Qlik, KNIME and Alteryx sit there), the data analysis tools ranking covers it. This page sticks to tools people use to build dashboards and reports that someone else reads.
Evaluation criteria for dashboard tools
Five criteria decide the shortlist, and the ranking below applies them in this order. Each one gives a yes, a no or a number when you check the vendor's page; data visualization polish is left to the trial.
1. Published entry price per seat or per month
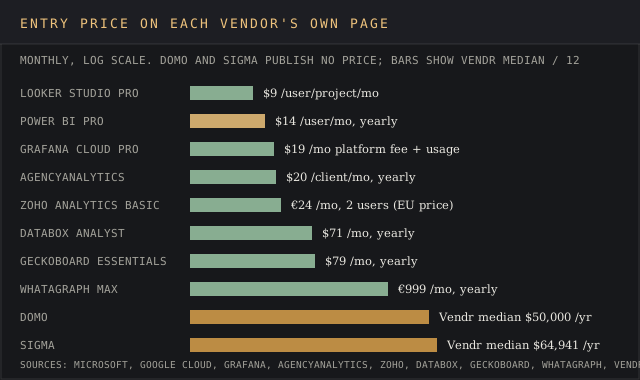
A buyer can read a dollar figure off the pricing page or can't. Power BI, Looker Studio, Grafana, Databox, Geckoboard and AgencyAnalytics publish one; Domo and Sigma send you to sales. Where the vendor publishes nothing, the ranking uses Vendr's anonymised buyer medians and says so.
2. Documented data sources and connectors
Count the connectors the vendor itself claims: 1,000+ for Domo, 1,400+ for Looker Studio, 130+ for Databox, 90+ for Geckoboard. Then check that your three most-used systems are on the list as native connectors. Data connectivity is the first thing a trial with your own raw data exposes.
A bridge through automation tools like Zapier is a red flag: it breaks on the first schema change.
3. Scheduled refresh cadence on the entry paid tier
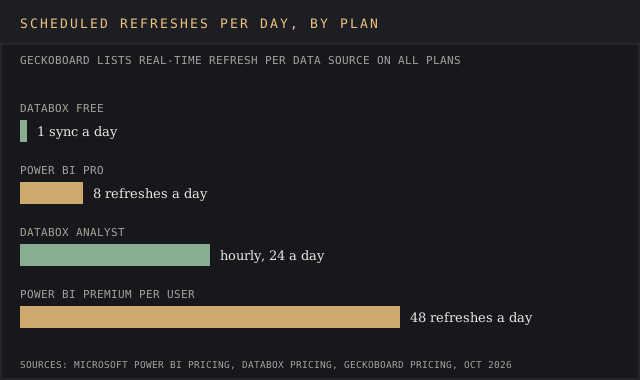
Power BI Pro refreshes a model 8 times a day; Premium Per User raises that to 48. Databox syncs daily on its free plan and hourly on paid plans. Geckoboard lists real-time refresh per data source on every plan, which is why it shows up on office TVs.
4. Free-tier caps
Free dashboard software differs on what it withholds: sharing on Power BI, users and rows on Zoho Analytics, retention on Grafana, data sources on Databox. The test is a number per plan, and every plan below has one.
5. Contract size
Annual contract value separates a $168 seat from a $50,000 platform. Vendr's median, purchase count and range are the reference where they exist, and Grafana publishes its own Enterprise floor at $25,000 a year in committed spend.
The 10 best dashboard software platforms, ranked
Microsoft Power BI
Best fit
Companies already paying for Microsoft 365 that have at least one analyst who can write data analysis expressions.
Microsoft Power BI ranks first on price transparency, and the pricing page shows why. Pro costs $14 per user per month on a yearly plan with a 1 GB model limit, 8 scheduled refreshes a day and 10 GB of storage per license. Premium Per User costs $24 and lifts the model ceiling to 100 GB and refreshes to 48 a day.
The free account builds reports in Power BI Desktop without a credit card, but you can't share them until you buy Pro. Microsoft's Power Query connector index marks nearly every listed connector as available in Power BI semantic models, from SQL databases to cloud services.
Key features
- Data analysis expressions (DAX) for measures and data modeling inside the semantic model
- Power Query connectors shared with Excel, listed in one Microsoft index
- 8 refreshes a day on Pro, 48 on Premium Per User
- Power BI Embedded for embedded analytics inside your own app, priced through sales
- Copilot assistant for natural language queries
Pricing
Free account for Desktop authoring; Pro at $14 per user per month and Premium Per User at $24, both billed yearly. Fabric capacity reservations carry a stated 40.5% saving over pay-as-you-go, with per-capacity prices left off the page.
Pros
- Lowest published per-seat price among full BI tools on this list at $14
- 100 GB models on Premium Per User for $10 more per seat
- Desktop authoring is free, so data analysts can build before anyone buys a license
- Customizable dashboards with visuals that cross-filter, per users
Cons
- Every viewer needs Pro too, so a 40-person sales team costs $560 a month
- Pro's 1 GB model ceiling forces aggregation on large raw data
- The learning curve for creating dashboards with DAX and gateways is steep for Excel users
The bitter pill to swallow is the cost of sharing outside the tenant. A director in research and development wrote on TrustRadius in April 2026:
"The pricing for the tier to have publicly, universally accessible reports was, for a long time, cost-prohibitive."
Verified User, Director in Research & Development, TrustRadius, 5 April 2026
A project manager on TrustRadius in October 2025 put the build effort plainly: "Because dashboards take time and expertise to build, Microsoft Power BI is less compelling for one-off dashboards." An analyst in IT on TrustRadius (April 2026) named the upside: "It is affordable, because desktop version is free".
Why it’s ranked #1. Power BI beats Domo on the first criterion: a published $14 seat against Domo's unpublished credit pricing and $50,000 Vendr median. Nothing ranks above it, and its 8-refresh Pro cap is the price of that lead.
Domo
Best fit
Enterprises pulling data from multiple sources across dozens of SaaS apps that want one vendor for connectors, ETL and dashboards.
Domo sells the widest connector shelf on this list. Its connectors page claims 1,000+ pre-built connectors, and its own buyer's guide lists drag-and-drop ETL with SQL access kept for analysts, plus a semantic layer for consistent metric definitions. That combination puts data integration, data modeling and the dashboard builder in one bill.
The devil's in the details of the bill. Domo's pricing page promises unlimited users and credit-based pricing, where credits are consumed by storing data, updating tables and running workflows. It publishes no credit rates. Vendr's anonymised buyer data puts the median at $50,000 a year across 91 purchases, with a low of $10,920 and a high of $175,245.
Key features
- 1,000+ pre-built connectors for apps, warehouses and files
- Drag-and-drop ETL with SQL access retained for data analysts
- Semantic layer shared by every dashboard
- Unlimited users on every contract
- HIPAA-compliant environment and AWS PrivateLink on the custom tier
Pricing
Credit-based with no published rates. A 30-day free trial needs no credit card and includes the full platform. Vendr's buyer median is $50,000 a year over 91 purchases, ranging from $10,920 to $175,245.
Pros
- Unlimited users, so sharing dashboards and reports doesn't scale the bill
- 1,000+ connectors cover most SaaS sources natively
- 30-day trial is the longest on this list, long enough to explore data from every source you own
Cons
- No published credit rate, so a forecast needs a sales call
- Median contract buys about 297 $14 seats for a year
- Data visualization styling lags Power BI, per user reviews
An account executive at FUSIONARTS Solutions compared the two directly on TrustRadius in March 2023:
"The colours are awful, and the charts and other components are more difficult to work with than those in Power BI and similar programmes."
Rajeev Saxena, Account Executive, FUSIONARTS Solutions, TrustRadius, 21 March 2023
A fullstack developer at Logicnesia on TrustRadius (February 2025) praised the engine: "Domo is very fast when processing data".
Why it’s ranked #2. Domo's 1,000+ connectors and unlimited users beat Looker Studio for enterprise data integration. It loses to Power BI because it publishes no price, and Vendr puts the median at $50,000 a year.
Looker Studio
Best fit
Marketers who live in Google Analytics, Google Ads and BigQuery and need shareable dashboards at no charge.
Looker Studio, formerly Google Data Studio, is Google's free tool to build dashboards, and Google's own product page now calls it Data Studio again. The page says it's available at no charge for creators and report viewers and connects to more than 1,400 data sources, including Google Sheets, Google Ads, BigQuery and Google Analytics. For a team already inside Google's products, that's the best of both worlds: free seats and native ad data.
The Pro edition costs $9 per user per project per month and adds Google Cloud support and system administration. Google's enterprise product, Looker (Google Cloud core), is a separate purchase: its pricing page lists Standard, Enterprise & Embed editions on annual commitments with prices set through sales, and meters Conversational Analytics, its natural language queries feature, at 60 million input data tokens a month on Standard.
Key features
- 1,400+ data sources, including over 1,300 Community Connectors
- Drag and drop interface for data visualization on a free canvas
- Native Google Analytics, Google Ads, Sheets and BigQuery connectors
- Shareable dashboards through Google account permissions
- Pro edition at $9 per user per project per month
Pricing
Free for creators and viewers. Pro costs $9 per user per project per month, and Google says the per-user rate varies with subscription length.
Pros
- $0 for unlimited creators and viewers on the free tier
- 1,400+ sources, the largest count any vendor here publishes
- Reports need little technical knowledge to read, per user reviews
Cons
- Data blending caps at 5 sources per blend, per user reports
- Community connectors are third-party, so support varies by author
- Pro's $9 is per user per project, so 3 projects triple the seat bill
A marketing mentor at Plex flagged the blend limit on TrustRadius in January 2026: "Theres a limit of 5 sources when attempting to blend data which can be restrictive". Lee Preston, head of CRO at CTI Digital, wrote on TrustRadius in February 2026 that "It's a tool that clients can access easily".
Why it’s ranked #3. Looker Studio's $0 price and 1,400+ sources beat Grafana for business reporting. It loses to Domo on blending, capped at 5 sources per blend, against Domo's ETL across 1,000+ connectors.
Grafana Cloud
Best fit
Engineering teams that need to track CPU usage, latency and other infrastructure metrics in real time.
Grafana is the monitoring-side answer to dashboard tools, built for time-series data visualization and a fish out of water on campaign reporting. Its documentation lists core data sources including Prometheus, InfluxDB, Graphite, Loki, Elasticsearch, PostgreSQL and MySQL, plus AWS CloudWatch and Azure Monitor. The free tier gives 10k active metric series, 50 GB of logs and 3 active users, all with 14-day retention.
Pro starts at a $19 monthly platform fee, then bills metrics from $6.50 per 1k series and visualization at $8 per active user beyond the 3 included.
Enterprise starts at $25,000 a year in committed spend.
Key features
- Core connectors for Prometheus, InfluxDB, Loki, Tempo and Jaeger
- Alerting with Alertmanager as a built-in data source
- 13-month metrics retention on Pro
- Grafana Assistant at $20 per active AI user on Pro
- Self-hosted open-source edition alongside Grafana Cloud
Pricing
Free forever with 10k series and 3 users. Pro is $19 a month plus usage, with logs from $0.050/GB processing. Enterprise has a $25,000-a-year minimum commit.
Pros
- Free tier keeps 10k series live with no credit card
- Alerts route to Slack, email and webhooks
- Usage pricing starts at $19, far under any enterprise reporting contract
Cons
- 14-day retention on free makes month-over-month charts impossible
- Some settings, such as LDAP and SSO, still need config files
- Usage billing across 4 signal types makes the monthly bill hard to forecast
Anurag Tamrakar, a DevOps engineer at Precisely, wrote on TrustRadius in December 2021: "There are some settings which we can't configure from UI (Web Console)." An IT engineer on TrustRadius (October 2023) listed the upside: "Alerting through many different medium as Slack, Email, Webhook etc".
Why it’s ranked #4. Grafana's free 10k-series tier and $19 Pro fee beat Sigma for anyone monitoring systems. It loses to Looker Studio for business users, since 14-day free retention can't hold a quarter of marketing metrics.
Sigma
Best fit
Companies on Snowflake & Databricks that want to build interactive dashboards on live warehouse data.
Sigma runs its queries inside the customer's cloud data warehouse. Its pricing page lists connections for Snowflake, Databricks, ClickHouse, AWS, Azure and Google Cloud, and sells through demos with no published plan prices.
Vendr's anonymised buyer data shows the median at $64,941 a year across 154 purchases, ranging from $15,585 to $145,339. That's the largest median on this list, the lion's share of most dashboard budgets, and it buys enterprise scale analytics with row-level security for a data team that already pays a warehouse bill.
Key features
- Warehouse-native queries on Snowflake, Databricks and ClickHouse
- Spreadsheet interface for deep data exploration without SQL
- Workbook embedding for embedded analytics
- Row-level security and scheduled exports
- Connections listed for AWS, Azure and Google Cloud
Pricing
Quote only. Vendr's median is $64,941 a year over 154 purchases, with a $15,585 low and a $145,339 high.
Pros
- Live queries on connected data, so interactive reports match the warehouse
- Spreadsheet formulas shorten the learning curve for non-SQL users
- Scheduled, recurring reporting is simple to set up, per users
- Embedded analytics through workbook embedding, praised by users
Cons
- $64,941 median equals about 386 seat-years at $14
- Warehouse compute is billed separately by Snowflake or Databricks
- Advanced customization of table formatting and multi-join datasets draws repeated complaints
A customer service manager on TrustRadius in April 2025 wrote that it's "Very easy to set up re-occurring reporting on your schedule- for yourself or your team". An IT engineer on TrustRadius (June 2024) pointed to "Saving costs for the client in multiple ways like embedding, Running warehouse queries etc."
Why it’s ranked #5. Sigma's warehouse-native queries beat Zoho Analytics for teams on Snowflake. It loses to Grafana on the first criterion: no published price and a $64,941 Vendr median against Grafana's $19 fee.
Zoho Analytics
Best fit
Small companies on Zoho CRM or Zoho Books that want data reporting tools for 2 to 15 people.
Zoho Analytics sells by users and rows, so sizing a plan is no rocket science: count seats, count rows. The pricing page shows Basic at €24 a month billed annually to an EU visitor, covering 2 users and 0.5 million rows. Standard starts at 5 users and 1 million rows, Premium at 15 users and 5 million, Enterprise at 50 users and 50 million.
The free plan gives 2 users, 10K rows and 5 workspaces with unlimited dashboards and reports. Yearly billing saves 20%.
Key features
- Row-based plans from 0.5 million to 50 million rows
- Extra users at €6.40 per user per month on annual billing
- Free plan with 2 users and 10K rows
- Dedicated Compute tier at 500 million rows
- Generative AI assistant to explore data with natural language queries
Pricing
Basic at €24 a month billed annually (2 users, 0.5M rows); Standard €48; Premium €115; Enterprise €455, as shown to EU visitors.
Pros
- €24 entry price is the cheapest paid plan with 2 seats here
- Row-based pricing makes the bill predictable
- Free plan keeps custom dashboards in 5 workspaces
Cons
- 10K free rows caps the free plan at a small spreadsheet's worth of data
- Data visualization customization is thinner than on the top 3
- Spreadsheet-based syncs glitch, per user reviews
Jeb Brilliant, owner of Soulwise, wrote on TrustRadius in November 2024: "Sometimes the software glitches when we update spreadsheets."
Why it’s ranked #6. Zoho's €24 Basic plan with 0.5 million rows beats Databox for teams that need data modeling across tables. It loses to Sigma at scale, where Zoho's 50-million-row Enterprise cap sits under a warehouse.
Databox
Best fit
Small marketing teams that want marketing dashboards and KPI scorecards from HubSpot, Google Analytics and Google Ads with no technical setup.
Databox is a KPI dashboard builder with templates, goals and automated reporting digests. Its pricing page says it pulls data from 130+ tools, spreadsheets, databases and APIs. The Analyst plan costs $71 a month billed annually for 5 data sources, 1 user and hourly sync.
Beggars can't be choosers on the free plan, which is "free forever" with 3 data sources, 1 dashboard, 1 user and daily sync, but leaves out sharing, API access and CSV export. The pricing page also lists Team Core at $199 a month on its plan card and $249 in its FAQ; the plan card is the purchasable figure.
Key features
- 130+ native integrations, including HubSpot and Google Analytics
- Hourly sync on every paid plan; 15-minute sync as an add-on
- Goals and scorecards pushed to Slack and email
- Agency plan with account packs for multiple clients
- White-labeling add-on at $80 a month
Pricing
Free with 3 sources. Analyst $71 a month, Team Core $199 a month and Agency from $79 a month, all billed annually; annual billing saves 20%.
Pros
- Pre-built templates and a drag and drop interface speed up custom dashboards
- Free plan covers 3 sources with no time limit
- Hourly sync on the $71 plan
Cons
- 5 sources on Analyst runs out fast
- White-labeling costs $80 a month extra
- Some data types only report 1 to 2 months back
A sales strategist reviewing Databox on TrustRadius in December 2019 hit both sides:
"Some types of data can only be reported on for 1-2 months back. Unless I'm misunderstanding the function of the software this seems really weird."
Verified User, Strategist in Sales, TrustRadius, 4 December 2019
The same reviewer added: "It turns out most businesses don't need the highly customizable and very high-priced features of Tableau."
Why it’s ranked #7. Databox's free 3-source plan and hourly $71 tier beat Geckoboard for KPI tracking across marketing metrics. It loses to Zoho Analytics on depth, with 5 sources on Analyst against Zoho's 0.5 million modelled rows.
Geckoboard
Best fit
Support, sales and operations teams putting live numbers on an office TV.
Geckoboard does one job: real-time data visualization on a wall display. Its pricing page lists real-time refresh per data source on every plan, unlimited viewers, and 90+ integrations. Essentials starts at $79 a month billed annually for 2 dashboards, 1 editor and 1 screen; extra dashboards cost $24 each.
Keep an eye on the dashboard count, since the 3rd one costs extra. Performance starts at $319 a month for 20 dashboards, 3 editors and 5 screens. A 14-day free trial needs no commitment, and prices exclude VAT.
Key features
- Real-time refresh per data source on all plans
- 90+ integrations with unlimited integrations per plan
- TV screen mode with per-screen pricing
- Unlimited viewers on every plan
- 14-day free trial
Pricing
Essentials from $79 a month, Performance from $319 a month, both billed annually; Enterprise is custom. Extra editors and screens are $20 each.
Pros
- Real-time refresh with no plan gating
- Unlimited viewers, so a whole office can watch
- Little technical setup, per reviews from 2016 to 2021
Cons
- 2 dashboards on Essentials; the 3rd costs $24
- No ad hoc analysis or complex data analysis
- Pricing has tightened on screens and connections, per users
An IT technician on TrustRadius in March 2021 spelled out the scaling cost:
"Limited number of database connections means that we would have to pay a huge amount to keep all of our potential dashboards live at a given time."
Verified User, Technician in Information Technology, TrustRadius, 25 March 2021
Chris Peters, director of marketing at Diggerland USA, wrote on TrustRadius (February 2016): "Geckoboard is affordable simply stated."
Why it’s ranked #8. Geckoboard's real-time refresh on a $79 plan beats AgencyAnalytics for internal wall displays. It loses to Databox, which keeps a free 3-source plan where Geckoboard offers only 14 trial days.
AgencyAnalytics
Best fit
SEO and paid-media agencies sending branded reports to multiple clients each month.
AgencyAnalytics prices per client, which kills two birds with one stone: the bill tracks both agency revenue and the client list. The pricing page lists $20 per client per month billed annually, 85+ marketing integrations and a 14-day trial with no credit card. Rank tracking is an add-on at $41.67 a month per 500 keywords. Our AgencyAnalytics review covers the product in full.
It sits between reporting tools and a client portal: each client logs into a white-labeled dashboard that pulls data from Google Analytics, Google Ads and the rest of its 85+ integrations. Volume discounts start at 25 clients.
Key features
- 85+ marketing integrations, Google Analytics and Google Ads included
- Custom dashboards per client with client logins
- Rank Tracker add-on at $41.67 a month per 500 keywords
- AI Tracker add-on at $20.83 a month per 250 credits
- Automated reporting on a schedule per client
Pricing
$20 per client per month billed annually; annual billing saves 20%. Discounted per-client pricing applies from 25 clients.
Pros
- Per-client billing scales with the agency's book
- Integrations are added fast, per users
- Client portal replaces emailed PDFs
Cons
- Built only for marketing data; finance and ops data don't fit
- Rank data has drawn accuracy complaints
- Limited customization on imported data
Tyson Downs, owner of Titan Web Agency, wrote on TrustRadius in December 2022 of "Sometimes wildly inconsistent rankings that we are unable to duplicate".
"The company quickly adds new integrations and takes feedback seriously, often making changes from it within the same quarter."
Sally Benson, Digital Marketing Manager, LuccaAM, TrustRadius, 13 May 2021
Why it’s ranked #9. AgencyAnalytics at $20 per client beats Whatagraph's €999-a-month entry for small agencies. It loses to Geckoboard on scope: 85+ marketing-only integrations against Geckoboard's 90+ across support, sales and ops.
Whatagraph
Best fit
Larger agencies blending paid social, search and analytics data into one client report.
Whatagraph bills by connected source. Its pricing page says each source costs 1 credit regardless of plan, where one credit is one connected data account, such as one Facebook Ads account. Max starts at €999 a month billed annually with 50 credits, unlimited users and unlimited reports.
Both plans route through a demo, so a buyer can't play it by ear on a self-serve trial.
Key features
- Credit billing at 1 credit per connected source
- Data blends and joins across ad platforms
- Unlimited users and unlimited reports
- Advanced Explore integrations on Max
- White-labeled custom dashboards for multiple clients
Pricing
Max from €999 a month billed annually with 50 credits; Prime custom. Extra credits can be bought up to the next plan's threshold.
Pros
- Customizable dashboards with unlimited users and reports on both plans
- Blends got easier in 2026, per users
- Credit model is transparent: 1 source, 1 credit
Cons
- €999 monthly entry rules out small agencies
- No self-serve trial
- AI report generation ignores context, per a 2026 review
A marketing analyst on TrustRadius in September 2026 wrote that "Joins/Blends have become SO much easier and let me combine data in the ways I need," and in the same review that "Some of the data/widgets/AI don't reliably use the context I give them when generating reports, so that could be improved."
Why it’s ranked #10. Whatagraph's credit model and unlimited users suit agencies with 50 or more sources. It ranks last because its €999 monthly floor is the highest published entry price on this list, against AgencyAnalytics at $20 per client.
What dashboards and reports in this category do
A dashboard shows a fixed set of key metrics on one screen, refreshed on a schedule: a fast, visual way to track progress. Dashboard tools handle three jobs underneath: they connect to data sources, store or query the data, and render charts that update when the source changes. Automated reporting keeps the numbers current without anyone exporting a CSV.
Dashboards are widely used to guide decisions and communicate results, and the test of one is plain. In a nutshell, a dashboard is only as good as the decisions it drives, so if nobody changes a budget or a staffing plan after reading it, it's decoration. Effective dashboard tools turn complex datasets into clear visuals, and effective dashboards put key performance indicators for decision-makers at the top and push detail into drill-downs.
Data visualization tools help turn raw information into charts, and a dashboard is the subset of data visualization that repeats. The difference shows up in setup: a one-off data visualization can be built from a spreadsheet, while a dashboard needs a connection that pulls data on a schedule.
Static dashboards versus interactive dashboards
Static dashboards communicate a clear, focused message. They're easier to share and faster to produce, which is why Geckoboard and Databox lean on them for TV screens and Slack digests. Static views are ideal for explaining findings to an executive who reads one number.
Interactive dashboards allow users to filter and explore data, and they're the better choice for uncovering trends in large datasets. They require more design and development effort: Power BI interactive reports need DAX measures, and Sigma's need a modelled warehouse.
Read the room and pick by audience. A board gets static; a data analyst gets filters.
Dashboard tools, BI tools and reporting tools: the subtypes
Data visualization tools split four ways, and buyers who mix them up end up barking up the wrong tree with a 12-month contract.
- Full BI tools (Power BI, Domo, Sigma, Zoho Analytics): data modeling, a semantic layer, access control and, on Power BI and Zoho, natural language questions. Built to create interactive dashboards for a whole company.
- Free and self-serve dashboard builders (Looker Studio): a drag-and-drop data visualization canvas on top of connectors, with little data modeling.
- Monitoring tools (Grafana): time-series data from Prometheus and InfluxDB, built for system metrics and alerting.
- Marketing dashboards and client reporting tools (Databox, Geckoboard, AgencyAnalytics, Whatagraph): pre-built connectors for Google Analytics, Google Ads and social platforms, priced per source or per client.
Embedded analytics cuts across the first group. Power BI Embedded is priced by capacity, Sigma sells workbook embedding, and Looker's Embed edition includes up to 500,000 query-based API calls a month on Google's pricing page. A company buying embedded analytics for its own product buys from this group.
Custom dashboard software for internal analytics is the fifth use, and it's usually a BI tool with a narrower audience. If the data team owns the warehouse, Sigma or Power BI fits; if marketing owns the data, Databox or Looker Studio does.
Connecting multiple data sources: connectors, warehouses and SQL databases
Every dashboard is only as current as its connected data. The tool must connect to existing data systems, including cloud data warehouses, and the numbers vendors publish vary by a factor of 15: Geckoboard's 90+, Databox's 130+, Domo's 1,000+ and Looker Studio's 1,400+.
Read between the lines on those counts, because they measure different things. Looker Studio's 1,400 includes more than 1,300 Community Connectors written by third parties. Domo's 1,000+ are Domo-built. Grafana ships core connectors for Prometheus, Loki, PostgreSQL, MySQL and Microsoft SQL Server and leaves the rest to plugins.
Evaluate data integration capabilities before selecting a dashboard tool, and run the test on data from multiple sources at once. Pulling data from multiple sources into one chart is where most tools strain: Looker Studio caps a blend at 5 sources, and Databox's Analyst plan caps the whole account at 5.
Consistent metric definitions across sources
Two dashboards showing two different revenue numbers is the last straw for most CFOs. Ensure consistent metric definitions across different data sources by putting them in one semantic layer: Domo's guide describes one, and Power BI's semantic models hold DAX measures that every report reuses. Centralized data management is the fix; copying a formula into 12 reports is the cause.
Data warehouses change the calculation. Sigma queries Snowflake or Databricks live, so the dashboard and the warehouse agree by design, and the warehouse bill rises with every refresh. Microsoft's Pro tier imports into a 1 GB model, so refreshes are capped at 8 a day but don't hit the warehouse between them.
Pricing across the category
Most dashboard software in this ranking prices between $8 and $24 per user per month where it prices by seat: Grafana's $8 per active user, Looker Studio Pro's $9, Power BI Pro's $14 and Premium Per User's $24. The spread widens once billing units change.
Four billing units run through these reporting tools: per user (Power BI, Looker Studio Pro), per usage (Grafana, Domo credits), per client or source (AgencyAnalytics, Whatagraph) and per dashboard or screen (Geckoboard). Price the same workload on each before comparing. A 10-client agency pays AgencyAnalytics $200 a month; the same agency on Whatagraph Max pays €999.
Hidden costs add insult to injury. Power BI charges every viewer, Databox charges $80 a month for white-labeling, Geckoboard charges $24 per extra dashboard, and Sigma's warehouse compute arrives on a separate invoice.
Contract minimums do the rest: Grafana Enterprise starts at $25,000 a year. Embedded analytics is priced by capacity on Power BI and by edition on Looker. Check which tier holds SSO and audit logs before signing. Natural language features are metered separately: Looker counts data tokens, Grafana bills $20 per active AI user.
Free dashboard software and what it can't do
Five tools on this list have a free tier, and each one leaves out a different thing, so don't put all your eggs in one basket before reading the caps.
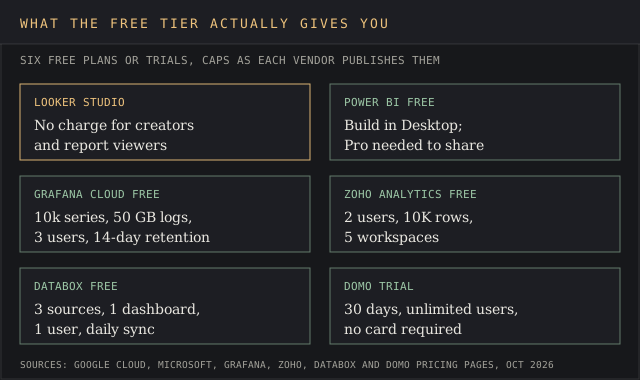
- Looker Studio: Google's free dashboard has no charge for creators or viewers.
- Power BI free account: build in Desktop, share nothing until you buy Pro at $14.
- Grafana Cloud Free: 10k series, 50 GB logs, 3 users, 14-day retention.
- Zoho Analytics Free: 2 users, 10K rows, 5 workspaces.
- Databox Free: 3 sources, 1 dashboard, daily sync, no sharing or CSV export.
What is the best free dashboard software? For shared marketing reports, Looker Studio, because it's the only one with free viewers. For engineering, Grafana, which works as custom dashboard software for any time-series source. For a solo analyst who'll pay later, Power BI Desktop. For basic dashboards on 3 sources, Databox Free.
How to run a trial with your own data
Testing dashboard tools with real data reveals limitations a demo hides. Trials are short: Domo gives 30 days, Geckoboard and AgencyAnalytics 14.
Plan the test before you start the clock, because a 14-day trial is a race against time.
- Connect your three largest data sources and time how long it takes to build dashboards on each.
- Rebuild one existing report using the key features you'd rely on daily, check it matches the source to the cent, and note if a visual query builder covers it without SQL.
- Schedule a refresh and confirm the count per day against the plan.
- Share it with one non-technical viewer and record what their seat costs.
- Check role-based access controls on one sensitive data table, plus where SSO and audit logs sit by tier.
Usability and learning curve decide adoption. Selecting the right data dashboard tool means balancing technical capability against user adoption, and user-friendliness for non-technical team members counts too. If the sales team can't read it without a data analyst, the tool has failed the trial.
Data governance and visual flexibility matter for any of the data visualization tools here, and collaboration and sharing features get tested at the same step: comments, subscriptions and alerts. Effective tools should send alerts when a metric crosses a threshold, as Grafana does to Slack, email and webhooks, and as Databox does with goals.
Common mistakes when buying dashboard software
Buying for key features the team won't use is the most expensive one. Choose dashboard tools and data visualization tools based on specific business needs: a wall display doesn't need DAX or interactive dashboards, and a finance model doesn't need 85+ marketing connectors.
Second, ignoring the viewer bill. Microsoft's $14 seat applies to readers too, while Domo, Geckoboard and Whatagraph include unlimited viewers or users. Third, skipping performance and scalability checks: a 1 GB Pro model or a 10K free row cap is fine in month one and sends you back to square one by month six.
Fourth, underestimating the learning curve and technical knowledge required. Power BI and Sigma need a data team; Databox and Geckoboard need someone who can authorise an OAuth connection, and a visual query builder only helps when the source schema is tidy. Templates in dashboard tools save time on report creation and on creating dashboards from scratch, and reusable templates are where Databox and AgencyAnalytics earn their price.
Power BI versus Looker Studio
These two cover most of the SERP for this category, and the split is clean. Power BI costs $14 per user per month and gives data modeling, DAX and interactive dashboards with 8 refreshes a day. Looker Studio costs nothing, has a short learning curve, integrates with Google products and third-party sources, and allows drag-and-drop chart building with no model. Both handle data visualization well; the split is the data underneath.
Pick Looker Studio when the data lives in Google Analytics, Google Ads and BigQuery and the readers are clients. Pick Microsoft's tool when the data lives in SQL Server, Excel and Dynamics and the readers are employees on Microsoft 365. It connects to various data sources, including SQL databases and cloud services, through the same Power Query engine Excel uses.
Real-time dashboards and operational monitoring
Real-time data visibility is essential for operational monitoring: a server outage or a support queue spike can't wait for an 8-a-day refresh. Grafana visualizes time-series data from monitoring tools such as Prometheus and InfluxDB, and it's best for visualizing infrastructure data.
Geckoboard covers the business version, with real-time refresh per data source on every plan.
Frequently asked questions
What are the top 5 dashboard tools?
Among dashboards and data visualization tools, this ranking puts Microsoft Power BI, Domo, Looker Studio, Grafana and Sigma first. Power BI leads on its published $14 seat; Domo on its 1,000+ connectors.
What are the top 5 data visualization tools?
For recurring dashboards, the same five data visualization tools as above. For one-off chart work, Tableau and Qlik sit in the data analysis tools ranking linked below.
What is the best software for dashboards?
The best dashboard software for most buyers is Power BI at $14 a seat. The best dashboard for Google data is Looker Studio at $0.
How can I create a data dashboard?
Connect one or multiple data sources, pick 5 to 7 key metrics, and build dashboards around one question per screen. Most tools here offer templates; Databox's free plan gives 1 dashboard and 3 sources to start.
What is the 5 second rule for dashboards?
It's a design heuristic: a viewer should find the dashboard's main number within 5 seconds of looking. Put the headline KPI top-left and keep the first screen to a handful of charts.
What is replacing Tableau?
Buyers leaving Tableau on this list move most often to Power BI for price, Sigma for warehouse-native work, or Looker Studio for free reporting. Tableau itself is covered in the data analysis tools ranking.
Does Microsoft have a dashboard tool?
Yes: Power BI, at $14 per user per month for Pro, with a free Desktop account for authoring.
What is a dashboard software?
Software that connects to data sources and renders a refreshed set of data visualization charts on one screen. It ranges from free canvases like Looker Studio to platforms like Domo with 1,000+ connectors and ETL.
What are the top 5 data analysis tools?
That's a separate category with Excel, KNIME and Alteryx in it; see the data analysis tools ranking. For product and web analytics such as Google Analytics, see the customer analytics tools ranking.
Bottom line
Power BI is the best dashboard tool for most companies: $14 a seat, published, with the deepest data modeling and data visualization library here. Domo wins when the problem is 50 SaaS sources and unlimited viewers, and the budget clears a $50,000 median.
Looker Studio wins for anyone reporting Google data to clients at no charge. Grafana hits the nail on the head for infrastructure. Sigma wins as custom dashboard software for teams already paying for Snowflake.
Zoho Analytics, Databox and Geckoboard cover small teams' custom dashboards by rows, sources and screens. Agencies pick AgencyAnalytics until 50 clients at $20 each reach Whatagraph's €999 floor, and Whatagraph above that.