Operational Intelligence Platforms: 10 Tools Ranked for 2026
 By Jan Suski. I go deep on every review, checking every number against its source and digging up details other coverage misses, a habit from six years of SEO and link building for tech companies. Bylines at Surfer, Brand24, and Senuto. How the scoring works.
· Prefer this source on Google
Quick comparison of operational intelligence tools
Ten platforms with each one's score against the six tests below, the lowest price its vendor publishes beside the median annual contract Vendr reports from anonymised buyer data, and the buyer each fits. Rows link to the full entry below.
| # | Platform | Tests passed (of 6) | Entry price and Vendr median | Best fit |
|---|---|---|---|---|
| 1 | Elastic | 5 | $0.07/GB log ingest · $77,302 median* | Log-heavy teams that may self-host |
| 2 | Splunk (Cisco) | 4.5 | Free to 500 MB/day · $94,200 median* | Security and IT on one search language |
| 3 | Grafana Labs | 4 | $19/month Pro fee · $100,533 median* | Open-source metrics shops |
| 4 | Dynatrace | 4 | $29/month per host · $165,375 median* | Business events tied to app traces |
| 5 | IBM Instana | 3 | $21.20/month per MVS · no median | Hybrid estates needing self-hosted APM |
| 6 | Datadog | 3 | $15/month per host · $154,080 median* | Cloud-native teams wanting one SaaS |
| 7 | New Relic | 3 | Free to 100 GB/month · $112,800 median* | Small teams starting on the free tier |
| 8 | Celonis | 2 | Quote only · $12,775 median* | Process mining on ERP event logs |
| 9 | Sumo Logic | 1.5 | Calculator estimate only · $85,135 median* | Log and security teams on credits |
| 10 | Chronosphere | 1 | Quote only · no median | High-cardinality metrics at scale |
Medians marked * are anonymised buyer-reported annual contract values published by Vendr. Every other price is the one the vendor publishes itself.
Where these figures come from
Prices, free tiers and deployment options are each vendor's own published figures, read in September 2026. Medians marked * are the header stats on each vendor's Vendr marketplace page, and Gartner status is each vendor's own announcement of its 2026 Magic Quadrant placement.
Celonis's Vendr page shows no purchase count, IBM Instana and Chronosphere have no Vendr median, and Celonis, Sumo Logic and Chronosphere publish no rate card, so no row claims one.
Celonis also sits at #1 on our process intelligence software ranking, which scores it against process-mining rivals such as SAP Signavio and UiPath. This page scores it against observability platforms on six tests built for live IT data, so it lands at #8.
An operational intelligence platform collects logs, metrics, traces and business events from running systems and alerts a team while a problem is still small. AWS defines operational intelligence (OI) as "the process of collecting and analyzing real-time operations data to monitor system health and pre-emptively reduce issues." That definition fits the software Google ranks for the term.
The search results for this keyword split four ways. AWS, Splunk and Sumo Logic describe machine-data platforms for IT operations. Pipefy and Appian describe process monitoring.
Honeywell uses the name for a service that tracks mobile computers, scanners and printers, and Salesforce applies the idea to contact centers. This ranking zeroes in on the first two groups and covers platforms that ingest real time data from IT systems and business processes into one searchable store.
Buyers comparing operational intelligence solutions for forecasting or a decision engine should read the decision intelligence platforms ranking. Buyers cataloguing and governing data should read the data intelligence tools ranking. Dashboards over last quarter's warehouse tables belong to business intelligence, a separate market covered in the business intelligence market report.
The timing matters because ownership has changed hands fast. Cisco closed its $28 billion Splunk purchase on 18 March 2024, and Palo Alto Networks completed its $3.35 billion Chronosphere deal on 29 January 2026. Contracts signed now will renew under those owners.
Evaluation criteria for operational intelligence software
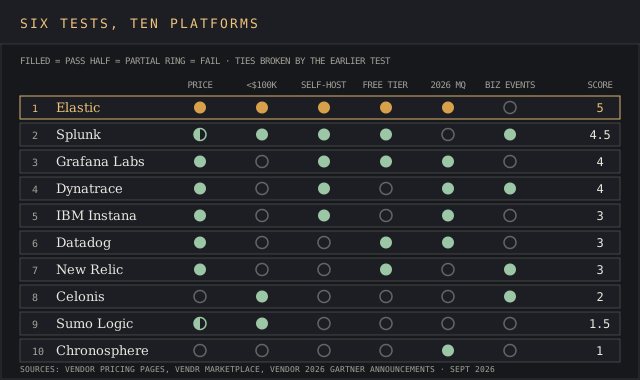
Six tests decide the ranking. Each one returns a yes, a no or a number that a buyer can check on the vendor's own site or on Vendr. The order is by tests passed, and ties go to the platform that passes the earlier test in this list, the same scoring approach described on the site's methodology page.
Published price per unit
Does the vendor's pricing page show a price per host, per GB or per monitored unit? A published rate lets a buyer model year-one cost and make informed decisions before a sales call. Splunk scores half, because it lists Observability Cloud per host while its core Splunk Cloud Platform ingest price stays behind a quote. Sumo Logic also scores half, because its Flex calculator returns a per-TB figure labelled an estimate for one usage profile, with no rate card behind it.
Take one month of your real log volume in GB and price it on the three per-GB rates published here: Elastic from $0.07, Datadog at $0.10 and New Relic at $0.40 after the first free 100 GB. Then send Splunk and Sumo Logic the same number for a quote.
Median contract under $100,000
Vendr's marketplace header reports a median annual contract drawn from anonymised purchases. A median under $100,000 passes. Platforms with no Vendr header figure can't pass this test.
Self-hosted deployment
Can the platform run in the buyer's own data center? Manufacturers, banks and public agencies with data-residency rules need that option for operational data that can't leave the building.
Free tier with no end date
A pass needs a free plan that takes the buyer's own data and doesn't expire. Timed trials fail this test.
Leader in the 2026 Gartner Magic Quadrant
Vendors announced their placements in Gartner's 2026 Magic Quadrant for Observability Platforms on 15 July 2026. A pass requires the vendor's own announcement of Leader status in that edition.
Business-event or process analytics
Does the vendor document a product that maps telemetry and operational metrics to business process stages or key performance indicators? The test separates operational intelligence from plain IT monitoring by tying a failed checkout to lost orders. Vendors once sold this business half as business activity monitoring, and it breaks down data silos between IT and the order desk.
Platforms here that document a business-event or process analytics product: Splunk through AppDynamics Business iQ, Dynatrace, New Relic through Pathpoint, and Celonis.
The 10 best OI solutions, ranked
Each entry runs the same order: who it fits, what it does with a figure attached, key features, pricing, pros and cons, a user quote, and the line that defends its position.
Elastic
Best fit
Teams whose operational data is mostly logs and who want the option to run the stack themselves.
Elastic sells Elasticsearch, Kibana and a hosted observability service built on them, so one engine handles search, security events and telemetry, a jack of all trades by design. On 29 August 2024 the company added the AGPL license to Elasticsearch and Kibana, and its self-managed Free and open Basic tier includes log and metric shippers, an APM server and dashboards.
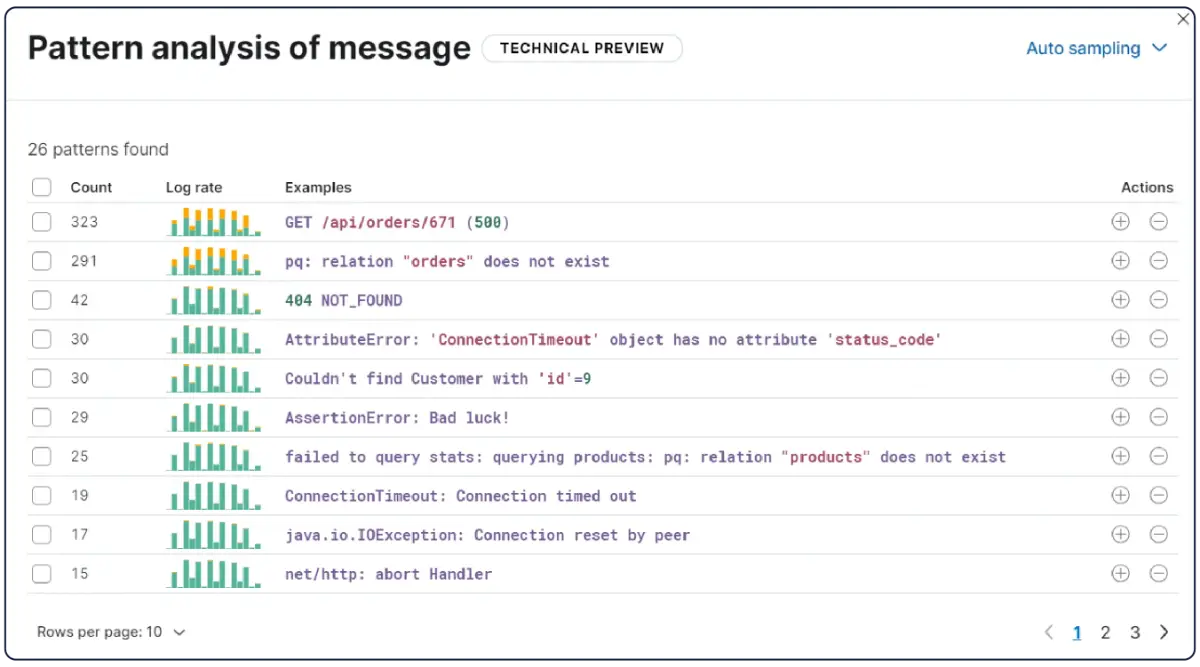
Elastic was named a Leader in the 2026 Gartner Magic Quadrant for Observability Platforms, its third year running. Per its log monitoring page, machine learning runs on every log message to catch anomalies such as a sudden drop in log rate.
Key features
- ES|QL query language across logs, metrics and traces in one store
- Log pattern analysis that groups messages, 26 patterns in Elastic's sample screen
- Filebeat and Metricbeat shippers plus an APM server in the free Basic tier
- Serverless and hosted cloud plus self-managed deployment
- OpenTelemetry-native ingest
Pricing
The serverless observability page lists Logs Essentials ingest from $0.07 per GB and retention from $0.017 per GB per month. The Complete tier starts at $0.09 per GB for logs and traces. Vendr's anonymised buyer data puts the median Elastic contract at $77,302 a year across 151 purchases, ranging from $23,000 to $370,671.
Pros
- Lowest Vendr median of the seven observability platforms with Vendr figures
- AGPL source plus a free self-managed tier with no end date
- Per-GB ingest and retention prices published for serverless
Cons
- Kibana alerting and actions sit above the Basic tier
- Self-managed clusters need staff who tune shards and field mappings
- No named business-process analytics product
Operating cost at scale draws the sharpest complaint. Hacker News user mikeshi42, who builds the competing ClickHouse-based HyperDX, wrote on 13 November 2024 that "elastic is slow, expensive and finicky to operate at decent scale." Long-time users see it as a default choice.
"the same types of "de-facto" observability tools that I've been using for a while at all of my various employers over the last 5+ years - which are Grafana, Prometheus and Elastic Stack"
Hacker News user joedissmeyer, 23 June 2022, thread on Target's observability stack
Why it's ranked #1. Elastic passes five of six tests. It beats Splunk on the first test, a published $0.09 per GB ingest rate, and on median cost at $77,302 against $94,200. Its five passes are the highest count in the ranking.
Splunk (Cisco)
Best fit
Enterprises that already run Splunk for security and want IT operations on the same search language.
Splunk built its business on indexing any machine data and querying it with SPL, and it still publishes a guide titled Operational Intelligence: 6 Steps To Get Started. Cisco paid $157 a share, about $28 billion, and Splunk now also sells AppDynamics, whose Business iQ ties transactions to revenue metrics.
Splunk's Free license indexes 500 MB per day, but "Alerting (monitoring) is not available" and there's no login. That's a red flag for anyone planning to run production alerts on it.
Key features
- SPL search across any event data, with 1,000+ Splunkbase apps and add-ons
- IT Service Intelligence with service health scores and event correlation
- AppDynamics Business iQ for business transaction analytics
- Splunk Enterprise for self-hosted deployment
- Observability Cloud for metrics and traces
Pricing
The Splunk pricing page lists Observability Cloud from $15 per host per month for infrastructure, $60 for app and infrastructure, and $75 end to end, all billed annually. Vendr reports a median of $94,200 a year across 222 purchases, from $18,740 to $249,758.
Pros
- Free tier of 500 MB per day with no expiry
- Self-hosted and cloud options
- Business iQ covers the business-event test
Cons
- No published ingest price for Splunk Cloud Platform
- Free license drops alerting and user accounts
- Splunk's own Leader announcements stop at the 2025 edition
"Splunk is one of the best software I've ever used but it HAS to be used with very fast storage to be effective."
Hacker News user UltraSane, 4 November 2025, comment on Splunk licensing
The same comment notes that Splunk is "normally licensed on GB ingested per day. This can lead to bitter fights between teams over how this is allocated." A self-described Splunk integrator described the pattern on 6 October 2022: "Customer adds infrastructure to the deployment. Splunk slows down. License costs go up."
Why it's ranked #2. Splunk scores 4.5 of 6. It loses to Elastic on published ingest pricing and a $94,200 median, and it beats Grafana Labs on the median test, where Grafana's $100,533 misses the $100,000 line.
Grafana Labs
Best fit
Engineering teams already on Prometheus who want hosted dashboards for real-time data, logs and traces.
Grafana Labs sells Grafana Cloud on top of its open-source Grafana, Loki, Mimir and Tempo projects, which teams can also run themselves at no license cost. The company was named a 2026 Leader and positioned furthest in Completeness of Vision.
Key features
- Free cloud tier with 10,000 active metric series, 50 GB of logs and 50 GB of traces a month
- Open-source Loki, Mimir and Tempo for self-hosting
- Metrics retention of 13 months on the Pro tier
- Data visualization across Prometheus, SQL and cloud data sources
Pricing
The Grafana pricing page lists a $19 monthly Pro platform fee, metrics from $6.50 per 1,000 series, and logs at $0.050 per GB processed, $0.400 per GB written and $0.100 per GB retained. Enterprise needs a $25,000 annual commit. Vendr's median is $100,533 across 100 purchases, from $33,944 to $671,697.
Pros
- Free tier with no strings attached beyond a 14-day retention window and 3 users
- Self-hosting through open-source projects
- All unit prices published
Cons
- Usage bills climb during incidents, when log volume spikes
- No named business-process analytics product
- Enterprise minimum of $25,000 a year
Hacker News user nullify88 wrote on 14 July 2025 that "Grafana Cloud have quite a nice free tier." The metered model cuts the other way at scale.
"If I have an outage, I'll end up paying more for monitoring and log storage. There are no limits. I ended up cancelling my Pro account purely because of this."
Hacker News user lukaslalinsky, 3 February 2025, thread on observability costs
Why it's ranked #3. Grafana passes 4 of 6. It trails Splunk because its $100,533 median misses the $100,000 test, and it beats Dynatrace on the free-tier test, where Dynatrace offers a 15-day trial.
Dynatrace
Best fit
Enterprises that want business events, application traces and infrastructure metrics priced on one rate card.
Dynatrace comes closest to the textbook definition of operational intelligence. Its business observability product tracks "business metrics, KPIs, and SLOs, automatically in context with IT infrastructure, services, and databases." The company was named a 2026 Leader for the 16th time.
Key features
- Business events ingested at $0.20 per GiB, the same rate as logs
- OneAgent auto-instrumentation for hosts and processes
- Dynatrace Managed for on-premises requirements
- Real user monitoring at $2.25 per 1,000 sessions
- Application security at $13 a month per 8 GiB host
Pricing
The Dynatrace rate card lists full-stack monitoring at $58 a month per 8 GiB host and infrastructure monitoring at $29 a month per host. Log and business-event retention costs $0.0007 per GiB-day and queries $0.0035 per GiB scanned. Vendr's median is $165,375 across 31 purchases, from $33,944 to $1,416,075.
Pros
- Business events and IT telemetry on one published rate card
- Self-hosted option through Dynatrace Managed
- 16 Leader placements in Gartner's observability research
Cons
- Highest Vendr median of the ten, at $165,375
- Free access ends after a 15-day trial
- Agent-level instrumentation can collide with application runtimes
Deep agent hooks put all your eggs in one basket. Hacker News user to11mtm described a rollout on 10 January 2025.
"as soon as Dynatrace agents got installed on the app hosts, we started having various 'heisenbugs' requiring node restarts as well as a directly measured drop in performance."
Hacker News user to11mtm, 10 January 2025, thread on APM vendor pricing
Why it's ranked #4. Dynatrace passes 4 of 6, tying Grafana, and loses the tie on the free-tier test. It beats IBM Instana on business-event analytics, a test Instana fails, and on a Leader record of 16 placements.
IBM Instana
Best fit
Hybrid IT estates that need to track operational performance on premises and in the cloud.
IBM Instana discovers and instruments applications automatically and, per IBM's product page, gives visibility "for over 300 platforms" with full-stack data "updated every second." IBM announced Leader status in the 2026 edition on 15 July 2026.
Key features
- Automatic discovery without application restarts
- One-second metric updates
- SaaS, self-hosted and pay-per-use purchase models
- OpenTelemetry support
Pricing
IBM's Instana pricing page lists SaaS from $21.20 per managed virtual server a month, self-hosted from $385.20 per server a year, and pay-per-use from $0.03 per server-hour. A 14-day trial is free.
Pros
- Published per-server prices for SaaS and self-hosted
- Self-hosted option for regulated data
- 2026 Leader
Cons
- No free tier beyond the 14-day trial
- No Vendr contract data to benchmark a quote
- One user found it more complex than Jaeger for simple tracing
"Instana is a wholistic solution and does a pretty good job merging and displaying the collected metrics, logs, and traces."
Hacker News user EspressoGPT, 20 July 2023, comment on migrating from Jaeger to Instana
Why it's ranked #5. Instana passes 3 of 6 and loses to Dynatrace on business events. It beats Datadog, also on 3, because it runs self-hosted from $385.20 per server a year, an option Datadog lacks.
Datadog
Best fit
Cloud-native companies that want infrastructure, logs and APM from one SaaS vendor.
Datadog reported second-quarter 2026 revenue of $1.12 billion, up 36% year over year, with about 4,720 customers paying $100,000 or more a year. Gartner placed it highest in Ability to Execute in the 2026 edition.
Key features
- 1,000+ integrations
- Infrastructure, APM and log management on one agent
- Free plan for up to 5 hosts
- Indexing priced per million log events
Pricing
The Datadog pricing page lists Infrastructure Pro at $15 per host a month billed annually ($18 on demand), log ingest at $0.10 per GB, and standard indexing at $1.70 per million events. APM starts at $31 per host. Vendr's median is $154,080 across 1,133 purchases, from $21,218 to $712,779.
Pros
- Every core price published
- Free tier for 5 hosts with no end date
- Largest Vendr sample in this ranking
Cons
- SaaS only, with no self-hosted deployment
- Free plan keeps metrics for 1 day
- Second-highest Vendr median, at $154,080
Small teams report low bills. Hacker News user CSMastermind wrote on 18 August 2024 that "At small scales Datadog is fairly cheap and will almost certainly give you everything you need out of the box." Larger fleets see costs that add up to an arm and a leg. On 7 August 2026, user jhaygood86 wrote "DataDog comes to mind, and they are EXPENSIVE."
Why it's ranked #6. Datadog passes 3 of 6 and loses to Instana on self-hosting. It beats New Relic, also on 3, through its 2026 Leader placement, where New Relic's latest announced Leader edition is 2025.
New Relic
Best fit
Small teams that want full-stack monitoring on a free allowance before committing budget.
Francisco Partners and TPG took New Relic private on 8 November 2023 for $87 a share, about $6.5 billion. Its Pathpoint product maps telemetry to business process stages, and New Relic was named a Leader for the 13th time in the 2025 edition.
Key features
- 100 GB of free data ingest a month
- Pathpoint business process views
- Default retention of at least 8 days
- Data Plus option with up to 90 days of extra retention
Pricing
The New Relic pricing page charges $0.40 per GB beyond the free 100 GB, or $0.60 on Data Plus. Core users cost $49 a month, and Pro full-platform users cost $349 a month on annual terms. Vendr's median is $112,800 across 248 purchases, from $24,689 to $499,928.
Pros
- 100 GB of free ingest a month across all data types
- Published per-GB and per-user prices
- Pathpoint covers business process views
Cons
- Full-platform seats at $349 a month add up fast
- SaaS only
- Vendr median above $100,000
"NewRelic's pricing is so brutal that I hold out hope. Unfortunately, NR's product really is that good"
Hacker News user icelancer, 11 January 2025, thread on moving off New Relic
That leaves some buyers between a rock and a hard place, paying seat fees for a product they rate.
Why it's ranked #7. New Relic passes 3 of 6 and trails Datadog on 2026 Leader status. It beats Celonis because it publishes a $0.40 per GB rate, the first test Celonis fails.
Celonis
Best fit
Operations and finance teams monitoring business processes in SAP or Salesforce event logs.
Celonis reads event logs from operational systems such as ERP and CRM and rebuilds how orders, invoices and shipments move, the process-mining side of operational intelligence. Gartner placed it highest on Ability to Execute and furthest on Completeness of Vision in the April 2025 Magic Quadrant for Process Mining Platforms.
Process mining shares roots with the techniques in the data mining tools ranking. On AWS Marketplace it holds 4.5 stars from 350 ratings, 344 of them syndicated from G2 and PeerSpot, two sites whose moderation the site checked in Is G2 legit.
Key features
- Process mining on SAP and Salesforce event data
- PQL, a query language for event logs
- Variant and bottleneck analysis across process paths
- Free Celonis Academy training
Pricing
Celonis quotes every deal. Vendr's median contract is $12,775 a year, with a range of $6,000 to $130,277 and no purchase count shown.
Pros
- Process analytics built for business operations
- Lowest Vendr median in this ranking
- Top placement in Gartner's process mining research
Cons
- No logs, metrics or traces from IT systems
- No published price
- Reviewers flag stability and missing source control
Finding the root cause of a late shipment is a needle in a haystack without event-level data. A G2 reviewer whose review AWS Marketplace syndicates wrote on 8 June 2024 that "we can not only measure your OTIF rate, but also find the root causes of delays in your processes." A PeerSpot reviewer with two years on the tool wrote on 24 May 2023: "The solution is expensive. I rate its pricing a six."
Why it's ranked #8. Celonis passes 2 of 6, a $12,775 median and process analytics. It trails New Relic on published pricing and beats Sumo Logic, which scores 1.5, on the business-event test.
Sumo Logic
Best fit
Log and security teams that want unlimited users and prefer paying for queries over paying for ingest.
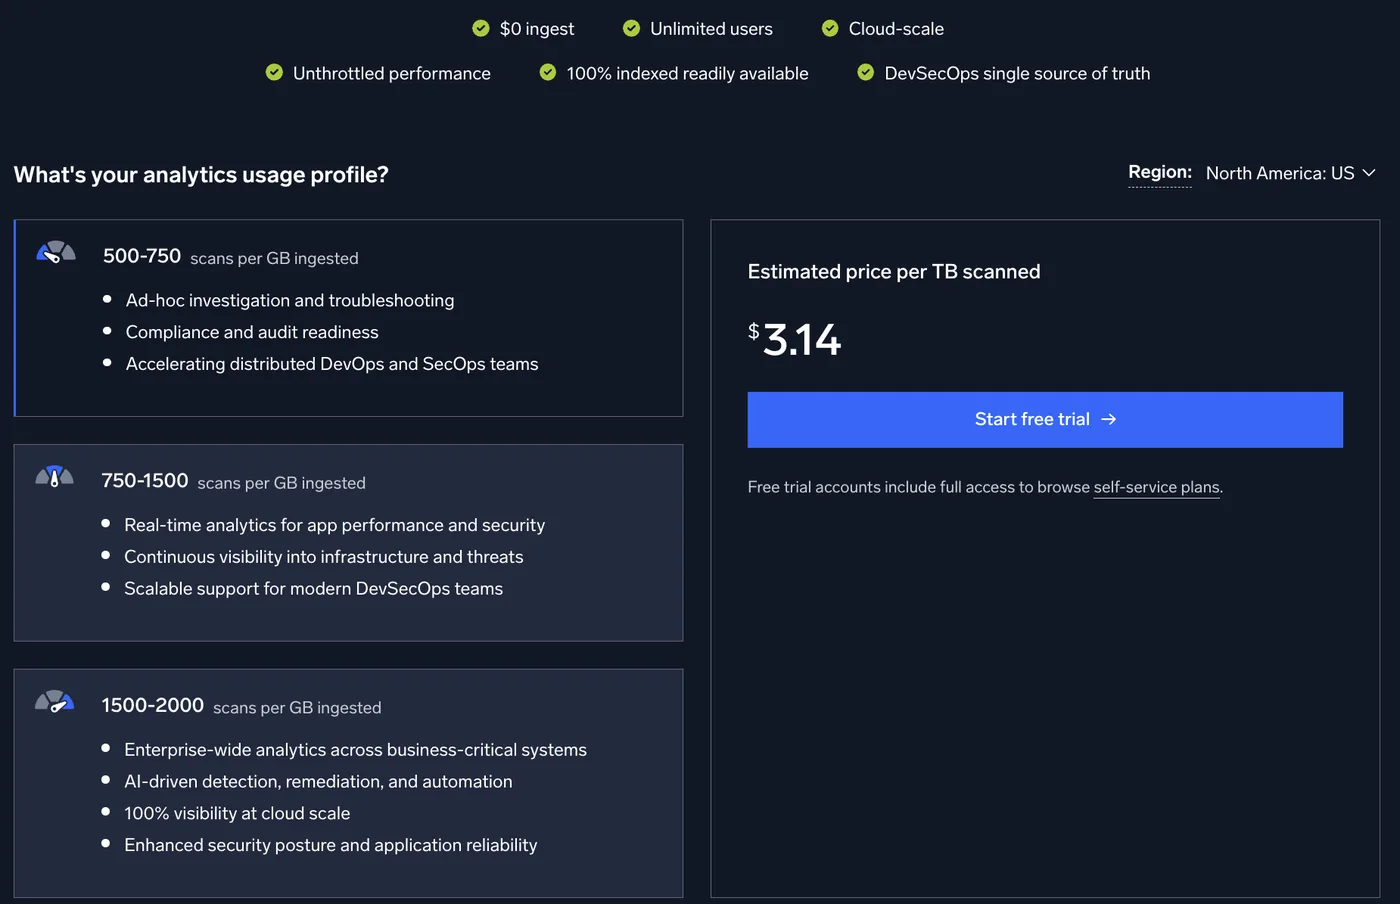
Francisco Partners bought Sumo Logic for $12.05 a share, about $1.7 billion, on 12 May 2023. The Flex pricing model advertises "$0 ingest," "Unlimited users" and charges by data scanned.
Key features
- Flex pricing with unlimited data ingest
- Log analytics and SIEM for security threats on one platform
- Unlimited users under Flex pricing
- Pricing calculator estimating cost per TB scanned
Pricing
The pricing page carries no rate card. Its Flex calculator estimates $3.14 per TB scanned for the lightest usage profile, 500 to 750 scans per GB ingested, in the North America: US region. The 14-day Agentic Free Trial runs on example data, and a 30-day AWS Marketplace trial converts to monthly billing. Vendr's median is $85,135 across 181 purchases, from $11,273 to $551,813.
Pros
- Vendr median of $85,135, under the $100,000 line
- No ingest charge under Flex
- Unlimited users
Cons
- No rate card, only a calculator estimate per TB scanned
- The website trial can't ingest the buyer's own data
- SaaS only
Scan-based billing means teams keep an eye on query habits. Hacker News user relistan, who has used it since 2017, wrote on 22 July 2024 that "Sumo Logic is reasonably priced, super powerful, easy to use, and really flexible."
Why it's ranked #9. Sumo Logic scores 1.5 of 6, from its $85,135 median and half a point for a $3.14 per TB calculator estimate. It trails Celonis on business events and beats Chronosphere, which passes 1.
Chronosphere
Best fit
Large cloud-native companies whose metric cardinality has outgrown self-run Prometheus.
Chronosphere reported more than $160 million in annual recurring revenue at the end of September 2025, according to Palo Alto Networks' acquisition announcement. The closing release says its controls "filter low-value noise to reduce data volumes by 30% or more." It was named a 2026 Leader.
Key features
- Control plane for dropping and aggregating metrics before storage
- Prometheus and OpenTelemetry compatibility
- Integration with Palo Alto Networks' Cortex security products
- Stated data-volume reduction of 30% or more
Pricing
Chronosphere quotes every contract and shows no rate card.
Pros
- 2026 Leader
- Volume controls aimed at metric bills
- Migrations can keep existing statsd code
Cons
- No published pricing or free tier
- No Vendr contract data
- Roadmap now set by a security vendor
"We've moved from SignalFX to Chronosphere, all using statsd and without having to change any of our application metrics-gathering code."
Hacker News user josephmosby, 22 April 2024, thread on metrics pipelines
The jury's still out on how Palo Alto Networks prices it after the January 2026 close.
Why it's ranked #10. Chronosphere passes 1 of 6, its 2026 Leader placement, and trails Sumo Logic's 1.5, built on an $85,135 median and a calculator estimate. Its $160 million in recurring revenue keeps it in the ten.
How operational intelligence works: data collection, analysis and alerting
Operational intelligence systems run three stages. Data collection gathers logs, metrics and performance data, and AWS lists sources across several technologies, from servers and databases to IoT sensors, smart meters and clickstreams. The analysis layer correlates event data, and the alerting layer tells a person or a script what to fix.
Analyzing data at ingest speed drives the bill. Datadog charges $0.10 per GB to ingest logs and $1.70 per million events to index them. Real time data collection means gathering data from thousands of hosts as a constant stream, and OI systems must index that stream before anyone can query it.
Complex event processing sits in the middle. AWS describes it as the step that "identifies and analyzes patterns of events across multiple streams of data," and adds that machine learning in OI systems refines alert criteria over time. Elastic's pattern analysis and Dynatrace's anomaly detection are two shipping versions of that idea.
Sumo Logic's glossary puts the goal this way: "AI algorithms can also help identify patterns, trends and anomalies in the data, enabling organizations to optimize their business operations and achieve operational excellence."
The storage layer, sometimes called the OI database, decides what's affordable. Dynatrace bills business events at $0.0007 per GiB-day retained, and Elastic lists retention from $0.017 per GB-month. Historical data kept for 13 months, Grafana's Pro metrics retention, supports trend views that a 1-day free window can't.
Pipefy's guide lists data collection, data analysis and data visualization as the three features that drive OI, and notes that modern "OI solutions are highly effective at pulling data from multiple sources and have the capacity to process millions of data points each day." Its dashboards turn raw data into actionable insights for the person on shift.
Sumo Logic's glossary adds that "Dashboards can be configured to display data in many different ways and can be customized based on the specific job role of the person using the dashboard or the needs of the business." For decision making under pressure the automated alert is the part a team acts on, so Splunk Free's missing alerting rules it out for production.
Operational intelligence examples
Published case figures show what operational intelligence (OI) solutions deliver when they work. Each example below comes straight from the horse's mouth, the vendor that sold the system, so treat the figures as the vendor's own claims.
- Retail service management: Splunk's ITSI page headlines "Specsavers Sees 10x Faster MTTR with Splunk."
- Banking: IBM says Instana helps teams at Mizuho "detect and resolve issues before they impact customers."
- Finance: Pipefy describes OI alerts on currency rates and stock prices used for detecting potential fraud.
- Manufacturing: the AWS guide walks through a factory where on-premises IoT devices feed a cloud pipeline and a production manager's screen.
- Contact centers: Salesforce says real-time monitoring through service dashboards helps teams spot issues while reducing customer wait times.
- Order-to-delivery: Celonis users measure on-time-in-full rates and trace delays to specific process steps.
Pipefy's guide adds human resources teams tracking staff workload and recruitment conversion, logistics supply chain visibility and retail demand tracking as use cases. The site's market intelligence examples cover the external-facing counterpart, and the supply chain intelligence ranking covers the logistics case in depth.
Share of service professionals in Salesforce's research who anticipate a higher case volume over the next year. 86% say customers expect more than they used to.
Contact centers watching customer interactions in real time are a common entry point for OI, alongside the tools in the conversation intelligence software ranking.
Operational intelligence and decision making
Operational intelligence shortens decision making to the minutes an incident allows. AWS writes that "OI includes proactive monitoring and taking immediate actions to fix runtime operational issues," which puts up to date information in front of the engineer during the outage.
Real-time insights feed three kinds of decision making. Engineers work against the clock to decide which release to roll back, often from real-time insights on error rates. Service managers decide on resource allocation when case volume spikes. Operations leads decide which process step to fix first, using bottleneck data from tools like Celonis.
Data-driven decisions depend on data accuracy, and Sumo Logic lists "ensuring data accuracy" among the main OI challenges. Data feeds that reach OI systems late or duplicated turn informed decisions into calls made on wrong numbers.
Faster data analysis on a failed checkout speeds decision making and protects revenue and customer satisfaction in the same minutes. Contact centers read the gain as operational efficiency and customer satisfaction together, since real-time insights into customer interactions from Salesforce's service dashboards cut the wait times both measures count.
Operational intelligence vs business intelligence: key differences
Operational intelligence focuses on what's breaking now. AWS puts the split plainly: "BI has a more long-term and retrospective focus, and doesn't have the alerting and troubleshooting aspect."
Business intelligence focuses on historical data pulled into a warehouse on a schedule, where BI tools run data analytics that give analysts actionable insights for the next planning cycle. Sumo Logic's glossary frames business intelligence as finding efficiencies that protect profits, while OI keeps IT systems healthy. Appian separates process mining, which reads historical ERP event logs, from OI, which watches live processes.
| Dimension | Operational intelligence | Business intelligence |
|---|---|---|
| Data age | Seconds to minutes | Daily or weekly loads |
| Typical data | Logs, metrics, traces, business events | Warehouse tables, finance and sales records |
| Output | Alerts, automated remediation | Reports, dashboards |
| Decision making | During the incident | At the next planning cycle |
| Main users | IT operations, SRE, service leads | Analysts, finance, executives |
Companies that run both forms of data analytics get the best of both worlds when the two share KPI definitions. A checkout-failure alert and the quarterly revenue report then count orders the same way, and a competitive advantage claimed from either rests on one number. The site's guide to market intelligence vs business intelligence covers the third category that faces outward.
Benefits of operational intelligence and OI implementation problems
The core benefits of operational intelligence (OI) are shorter outages and faster fixes, and OI tools boost efficiency through real-time monitoring that alerts before users notice.
AWS describes workflows that detect faults and trigger remediation automatically, so maintenance teams hear about a failing server before users do, a stitch in time that saves nine. Splunk's ITSI page promotes a resource on reducing downtime titled "Reduce unplanned downtime by 60% with Splunk ITSI."
Pipefy names three barriers to OI implementation that slow data analysis: resistance to change from staff without the technical skills, the balance "between the quality and speed of data analysis," and too many possible data priorities. Sumo Logic adds data integration from disparate data sources and data accuracy. Appian's checklist covers security: encryption in transit and at rest, strict access controls, and compliance with GDPR, HIPAA and CCPA.
Scalability shows up on the invoice. Usage-billed platforms charge more during an incident, the moment log volume peaks, and Grafana Cloud's $0.400 per GB written grows with the spike. That bill is the complaint that made the Grafana Cloud user quoted in the ranking cancel.
Data silos add a second cost. OI systems blind to the order system can't tell a slow API from a lost sale, the gap Dynatrace's business events and Splunk's Business iQ are built to close.
Pricing across OI tools
Operational intelligence systems bill in five different units across this list: per host, per GB ingested, per GB scanned, per user and per managed server. Vendr's medians cut through that and show a 13x spread from Celonis to Dynatrace.
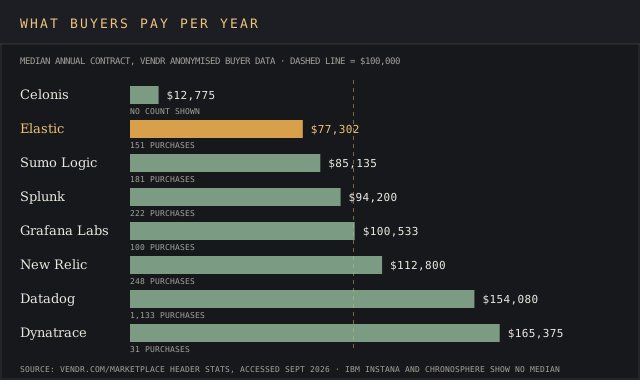
Read between the lines of each rate card. Datadog bills indexing per million events on top of per-GB ingest, Grafana charges to process, write and retain each GB, and New Relic's full-platform seats cost $349 a month each on Pro. The site's platform pricing report walks through the same tier traps in adjacent categories.
Future trends in operational intelligence
Consolidation is the first trend. Cisco bought Splunk, Palo Alto Networks jumped on the bandwagon with Chronosphere, and private equity bought New Relic and Sumo Logic.
Combined announced value of four deals: Splunk to Cisco at about $28 billion, New Relic to Francisco Partners and TPG at about $6.5 billion, Chronosphere to Palo Alto Networks at $3.35 billion, and Sumo Logic to Francisco Partners at about $1.7 billion.
Every operational intelligence company on this list with a network or security parent now answers to that parent's roadmap.
Artificial intelligence is the second. Elastic markets an AI Assistant that explains log rate spikes, and IBM promotes agentic AI for Instana incident investigation. Appian's guide says OI systems use predictive analytics to "predict future trends and behaviors based on current data." Real-time visibility into business outcomes, the test four platforms here pass, follows the same path as real-time market intelligence.
Operational intelligence FAQ
What is operational intelligence?
Operational intelligence (OI) is the real-time analysis of logs, metrics, traces and business events to spot and fix problems while they happen. Its data analysis runs on streams, where business intelligence runs on stored tables.
What is operations intelligence?
Operations intelligence, or ops intelligence, is another name for operational intelligence. It means collecting real time data from IT systems and business processes and alerting teams while problems are still fixable.
What are some examples of OI platforms?
Elastic, Splunk, Grafana Labs, Dynatrace, IBM Instana, Datadog, New Relic, Celonis, Sumo Logic and Chronosphere, ranked above. The first seven and the last two monitor IT systems, and Celonis monitors business processes.
Is operational intelligence the same as AIOps?
AIOps applies machine learning to IT operations alerts. It's one layer inside an OI system, which also covers business events and process data.
What is an OI database?
An OI database is the storage layer that indexes logs, metrics, traces and business events as they arrive, so a team can query them within seconds. Its retention price sets how much history a team can afford: Dynatrace bills retained logs and business events at $0.0007 per GiB-day, Elastic lists retention from $0.017 per GB-month, and Grafana Cloud Pro keeps metrics for 13 months.
How is operational intelligence different from process mining?
Process mining reads historical event logs from ERP and CRM systems to rebuild how orders, invoices and shipments moved, and operational intelligence watches live systems and alerts while a problem is running. Appian draws the same line in its guide. Celonis, ranked #8, is the process-mining platform on this list, and the other nine monitor IT telemetry.
How much do OI tools cost?
Published entry prices start at $15 per host a month on Datadog Infrastructure Pro and $0.07 per GB of log ingest on Elastic serverless. Vendr's anonymised buyer data puts median annual contracts between $12,775 for Celonis and $165,375 for Dynatrace, with Elastic at $77,302 and Splunk at $94,200.
Which operational intelligence tools have a free tier?
Five platforms here keep a free tier with no end date. Elastic's self-managed Basic tier is free, Splunk Free indexes 500 MB a day without alerting, Grafana Cloud's free tier takes 10,000 metric series plus 50 GB each of logs and traces a month, Datadog covers 5 hosts with 1 day of metric retention, and New Relic includes 100 GB of ingest a month.
Bottom line
Elastic wins for teams that want published per-GB pricing, a free self-managed tier and the lowest median contract among the big observability vendors. Splunk wins where security and IT already share SPL. Grafana Labs suits teams already running Prometheus.
Dynatrace is the pick for buyers whose main question is how an outage hits revenue, since it prices business events on the same card as logs. Celonis covers process-level operational intelligence for ERP-heavy operations. Datadog and New Relic suit small teams that can start free and accept SaaS-only hosting.