Best freight intelligence platform for 2026: 10 tools ranked
 By Jan Suski. I go deep on every review, checking every number against its source and digging up details other coverage misses, a habit from six years of SEO and link building for tech companies. Bylines at Surfer, Brand24, and Senuto. How the scoring works.
· Prefer this source on Google
Quick comparison of the 10 ranked tools
Rows follow the ranked order. The coverage column is the one figure that best shows how much freight data or network each tool rests on.
| # | Provider | Coverage figure | Entry price | Best fit |
|---|---|---|---|---|
| 1 | DAT iQ | $1 trillion in collected freight invoices | Broker load board plans from $159/mo; RateView quoted | US truckload brokers and shippers |
| 2 | Xeneta | 800m+ ocean and air rates | Quote only | Importers tendering ocean and air contracts |
| 3 | FreightWaves SONAR | 28-day NTI rate forecast | $24.99/mo Quick Rates | Brokers watching daily truckload market conditions |
| 4 | Freightos Terminal | 350,000+ lane benchmarks | $0 free tier | Forwarders quoting ocean and air lanes |
| 5 | Greenscreens.ai | $22.7B in transaction volume | Flat monthly fee, quoted | Freight brokerages pricing buy and sell rates |
| 6 | project44 | 1.5B+ shipments a year | $48,150/yr Vendr median* | Enterprise shippers tracking every mode |
| 7 | FourKites | 176 countries | Quote only | Consumer goods brands automating exception work with AI agents |
| 8 | Truckstop | 80M annual loads | $239/user/mo broker Pro | Small brokerages wanting rates inside the load board |
| 9 | Descartes MacroPoint | 435,000+ carriers and drivers | Quote only | Brokers tracking loads and sourcing capacity |
| 10 | Loadsmart FreightIntel AI | $1B+ freight dataset | Quote only | Loadsmart TMS users |
* Vendr’s anonymized buyer-reported contract data for project44, read 14 October 2026. Every other price is the figure the vendor publishes on its own site.
Where these figures come from
Coverage figures are each vendor’s own published number, linked from its entry below and read on 14 October 2026. The project44 price is Vendr’s median across buyer-reported contracts. Xeneta, Greenscreens.ai, FourKites, Descartes MacroPoint and Loadsmart publish no dollar figure, so their rows carry the pricing model and no price.
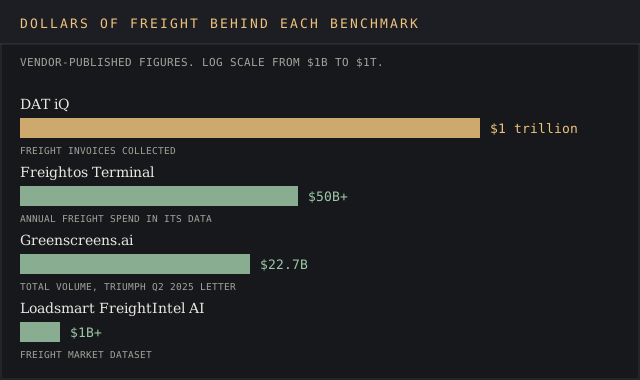
A freight intelligence platform collects transportation data (paid invoices, bookings, tender responses, ELD pings) and turns it into a rate, a forecast or an alert you can act on before the truck is booked. The biggest dataset on this page rests on $1 trillion in freight invoices. The cheapest paid entry costs $24.99 a month.
Ten platforms are ranked below, with the evaluation criteria set out first. The buyers in mind are freight brokers pricing spot loads, shippers running a procurement cycle, and logistics companies that need one view of carriers across ocean, air and road.
Half of the ten publish no price at all. Every entry still carries a pricing paragraph, with the vendor figure or a Vendr median where one exists, and says so where a demo call is the only route.
The timing matters for 2026 contracts. Triumph Financial paid $140 million in cash and $20 million in stock for Greenscreens.ai in 2025, so the tender season in the year ahead will be priced partly with tools owned by a bank, a load board company and a TMS vendor.
Evaluation criteria for a freight intelligence platform
Five criteria decide the shortlist, and the ranking below applies them in this order. Each one is a test a buyer can run against the vendor's own pages or a trial account and get a number back.
1. Freight volume behind the benchmark
A lane rate is only as good as the shipments under it. The test: does the vendor publish the dollar value or record count its benchmarks rest on, and does the lane view show how many companies and loads sit behind each rate. DAT's RateView does the second on every lane.
2. Refresh cadence
Count the days between updates. Daily is the bar for spot pricing: DAT updates rates daily, and the Freightos Baltic Index is calculated at 06:00 UTC and published at 14:00 UTC every day. A vendor that says its dataset is continuously updated, with no stated interval, scores lower here.
3. Forecast horizon
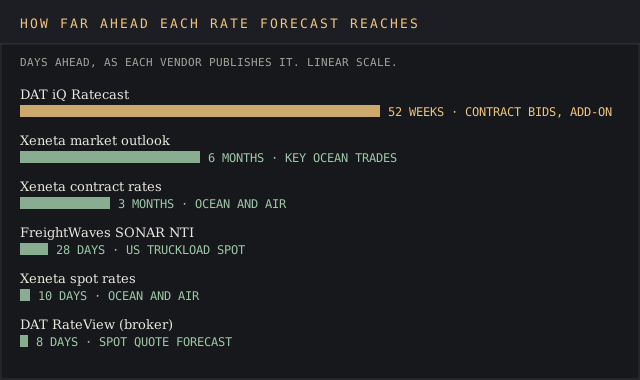
Real time data tells you where freight rates are, and long-run trends tell you how they move by season. A forecast tells you where they'll be when the contract starts, and the test is the number of days ahead the vendor commits to in writing: from 8 days for a broker quote to 52 weeks for a contract bid.
4. Mode and geography coverage
Count the modes and countries the vendor lists. A US truckload benchmark and a 176-country visibility network answer different questions, and this criterion is where rate tools and tracking tools part ways.
5. Published entry price
A vendor either publishes a price a buyer can pay this week or it doesn't. A Vendr median counts as a reference point. Contact-sales pricing scores zero on this test, which five of the ten fail.
The 10 best freight intelligence platforms
DAT iQ
Best fit
US freight brokers and shippers pricing van, reefer and flatbed truckload lanes against what the market paid this week.
DAT iQ is the analytics side of the DAT load board business, and RateView Analytics is the product most brokers open first. DAT says it collects invoices from thousands of transportation companies totaling $1 trillion, updates rates daily, and shows on each lane how many companies and shipments a rate rests on.
Shippers get DAT iQ Benchmark for network performance comparisons, and carriers get lane seasonality. DAT also claims its forecasts are over 95% accurate across more than 7 million daily predictions. That's the vendor's own number, and the page doesn't publish the method behind it.
Key features
- RateView Analytics: spot and contract rates, buy and sell rates, 13-month pricing histories per lane
- Broker averages from 3-day to yearly, plus an 8-day forecast for quoting
- Ratecast add-on with 52-week forecasts for contract bids and RFP responses
- DAT iQ Benchmark for shipper network performance comparisons
- Contract Bid and Network Analytics services for procurement teams
Pricing
RateView itself is quoted after a demo. DAT One, one of two load boards on this list, publishes its plans: broker plans start at $159 a month, and the Select tier adds the most current paid rate averages. Carrier plans run $59 to $339 a month, with 15-day lane averages from the $149 Enhanced plan.
Pros
- $1 trillion of invoices is the largest published dataset on this list
- Each lane shows its own sample size, so a thin lane is visible as thin
- The 52-week Ratecast covers a full annual bid
- Rates load inside the same DAT account brokers use to post loads
Cons
- No published RateView price
- The 52-week forecast is sold as a separate Ratecast add-on
- Truckload scope only, with no ocean or air benchmarks
Capterra lists DAT iQ at 4.5 from 66 reviews, and the forecast add-on draws praise from pricing staff. A pricing analyst at a trucking company wrote in June 2023 that "The new predictive Ratecast system has added another element to our pricing workbooks." The sharpest complaint is lag, from a sales manager in mining and metals in March 2026:
The rates and ranges quoted are outdated and generally too low.
Matt C., Industrial Minerals Sales Manager, Capterra, 19 March 2026
Why it's ranked #1. DAT iQ beats Xeneta on criteria 3 and 5: a 52-week forecast against Xeneta's 3-month contract horizon, and a $159 published entry against a quote. Nothing on the list publishes more than its $1 trillion of invoices.
Xeneta
Best fit
Importers, exporters and forwarders who negotiate annual ocean and air contracts and need to know where their rate sits against the market.
Xeneta benchmarks against the rates other shippers paid, so the data comes straight from the horse's mouth. Its homepage lists 800m+ ocean and air freight rates, 170k+ port-to-port pairs, 60k+ airport pairs, and contributions from 700+ global shippers. Forecasts reach 3 months ahead for contracted rates and 10 days for spot, with market outlooks up to 6 months on key trades.
The company also reports a tender result for the 2025-2026 ocean season: customer rates ended 23% below the long-term market benchmark, about $37M in savings across the customer base. Read between the lines: that's a Xeneta figure about Xeneta's own customers, with no outside audit.
Key features
- Ocean Freight and Air Freight rate benchmarks by port and airport pair
- Ocean Schedules built on AIS vessel tracking
- XSI-C shipping index and Euronext container freight futures data
- Integrated Rate Management System for storing contract rates
- ISO 27001:2022 certification
Pricing
Xeneta publishes no price or tier. The site offers a free analysis and a demo, and a quote follows from there.
Pros
- 800m+ rates contributed by 700+ shippers who paid them
- Three published forecast horizons: 10 days, 3 months, 6 months
- Covers ocean and air on one account
Cons
- No published price
- Refresh cadence is unstated beyond "a continuously updated dataset"
- Ocean and air only, so US truckload buyers need a second tool
- Thin public review base: 7 ratings on Gartner Peer Insights
Gartner Peer Insights shows Xeneta at 4.1 from 7 ratings. A senior specialist at a consumer goods company with $1B to $10B in revenue called it a "Great tool to compare the rates, volumes across the world supply chains" in August 2024.
Why it's ranked #2. Xeneta's 3-month contract forecast beats SONAR's 28-day NTI horizon on criterion 3, and 800m+ rates beats SONAR's unpublished volume. It loses to DAT on price: quote-only against $159.
FreightWaves SONAR
Best fit
Brokers and carriers who watch US truckload market conditions daily and want tender rejection rates next to spot rates.
SONAR is FreightWaves' real time market intelligence product, and its National Truckload Index forecasts rates up to 28 days in advance. FreightWaves says SONAR aggregates data from thousands of sources but publishes no count of lanes or records.
The May 2026 Quick Rates launch made it the cheapest paid tool here. Quick Rates gives unlimited spot rate searches by lane and equipment, confidence scores, 7- and 28-day trends, tender rejection rates, and a Chrome extension that shows lane rates on other sites.
Key features
- National Truckload Index with a 28-day forward view
- Quick Rates: lane search, confidence scores, margin calculator
- Capacity data, including tender rejection rates
- SONAR API, Container Atlas, Market Dashboard and Watchlists
- SONAR SCI for shippers' contract and spot mix
Pricing
Quick Rates costs $24.99 a month or $249 a year. The Freight Market Monitor is $199 a month. The full SONAR interface is available by request, with no listed price.
Pros
- $24.99 is the lowest published paid entry on the list
- Tender rejection trends keep a broker ahead of the curve, since capacity tightens before rates move
- Self-serve sign-up, no sales call for Quick Rates
Cons
- Full SONAR pricing is unpublished
- Lane-level accuracy draws complaints
- Modules are sold à la carte, so the full stack adds up
Capterra users give SONAR 4.7 from 9 reviews. A logistics coordinator wrote in September 2024 that it gives "a ton of real-time data that's super helpful for understanding market trends." A logistics startup CEO called the breadth of datapoints "incredible," then added that "at the price point I would expect to have more features included in the subscription." An account manager named the accuracy gap:
Accuracy is a little off in my experience - rates can be significantly higher than projected by SONAR for some lanes
Nick L., Account Manager, Logistics and Supply Chain, Capterra, 8 August 2024
Why it's ranked #3. SONAR's 28-day NTI forecast beats Freightos Terminal on criterion 3, since Terminal publishes no forecast horizon. It loses to Xeneta's 3-month contract forecast and 800m+ published rates.
Freightos Terminal
Best fit
Freight forwarders and importers who quote ocean and air lanes and want daily index data before paying for anything.
Terminal is the market intelligence arm of Freightos, and its data comes mainly from transactions on the Freightos booking marketplace. Freightos says it analyzes 10B+ data points daily and represents 50B+ in annual freight spend, with 50 to 70 million price points collected every month for the Freightos Baltic Index.
The FBX is the useful public product: 12 ocean lanes, priced per 40-foot container, published daily at 14:00 UTC and traded as futures on the Chicago Mercantile Exchange and Singapore Exchange. Terminal also gives real-time data on shipping lanes, transit times and rates, and flags port congestion, GRIs, blank sailings and labor issues.
Key features
- FBX ocean indices for 12 trade lanes and FAX air indices, both daily
- 350,000+ lane-specific benchmarks on the full platform
- 5-year historical data, custom My Routes and API access
- Negotiation deck exports for carrier meetings
- Transit time and reliability comparisons by lane
Pricing
The free tier includes live FBX indices for 12 lanes, FAX indices, 30-day historical trends and weekly market reports. Full platform pricing depends on the data package and is quoted after a demo.
Pros
- $0 entry with daily index data, the only free tier in the top ten
- The FBX methodology is published, and the index trades as futures
- Ocean and air in one account
Cons
- No published forecast horizon
- Paid tier price is unpublished
- Data skews to bookings made through its own marketplace
That last point shows up in reviews of the marketplace the data comes from. Capterra rates Freightos 4.3 from 54 reviews; one operations manager praised "Competitive rates and a good variety of freight partners" in November 2022. A music industry manager writing the same month described the gap between a quoted rate and the final bill:
I would have liked to known ahead of time about the total customs fee that would be due.
Mike C., Manager, Capterra, 8 November 2022
Why it's ranked #4. Terminal's $0 tier with daily FBX data on 12 lanes beats Greenscreens' quote-only pricing on criterion 5. It loses to SONAR, which publishes a 28-day forecast where Terminal publishes none.
Greenscreens.ai
Best fit
Mid-size and large freight brokerages that want buy and sell rate recommendations trained on their own quoting history.
Greenscreens prices truckload lanes with machine learning, and every prediction carries a confidence score. Triumph Financial closed its purchase on 8 May 2025, and Triumph's Q2 2025 shareholder letter counted about 240 Greenscreens customers and $22.7 billion in total volume.
Triumph is feeding its factoring and payments data into the Greenscreens models. Management claims they're 2x more accurate than competing products, based on internal testing; no outside test backs that up yet.
Key features
- Four products: Greenscreens Core, Integrated, Ignite and Insights
- Synchronized buy and sell price recommendations per lane
- Ignite add-on for analysis of quoting success and win-rate performance
- Insights dashboards and analytics, designed for managers and users
- Confidence score attached to every rate prediction
Pricing
A flat monthly fee based on business size, with no transactional, per-user or API fees. The dollar figure is quoted.
Pros
- Predictions are specific to each brokerage's buying and selling behavior
- Flat fee, so adding reps doesn't add cost
- Triumph's payment data adds lanes the model couldn't see before
Cons
- No published price
- No published forecast horizon beyond short-term
- Three Capterra reviews, all from 2023
- Now owned by a bank that also sells factoring to the same brokers
Capterra shows Greenscreens at 4.3 from 3 reviews. One logistics sales rep called it "Reliable for quoting lanes" in May 2023. Another, in June 2023, said the tool "seems to produce quotes that are higher than the current market," and that a high quote leaves the team less competitive on the load. Quote too high and the shipper walks; quote too low and the margin goes, which puts a rep between a rock and a hard place on every lane the model misreads.
Why it's ranked #5. Greenscreens prices against $22.7 billion of transactions, a rate benchmark project44 doesn't sell at all. It loses to Freightos Terminal, whose $0 tier beats a quote-only flat fee on criterion 5.
project44
Best fit
Enterprise shippers and manufacturers who need shipment visibility across every mode in one place, with AI agents working the exceptions.
project44 tracks freight and turns movement data into decisions. The homepage counts 282K carriers connected globally, 1.5B+ shipments a year, 700M+ logistics events processed daily and 1,000+ enterprise brands. Our project44 review covers the visibility product in more depth.
Movement, its Decision Intelligence Platform, combines shipment and carrier data with 8B external risk signals captured a day. The vendor reports a 72% faster response to supply chain exceptions and $16M in costs avoided during the Baltimore bridge collapse, both as customer outcomes.
Key features
- Ocean, air, rail, intermodal, full truckload, LTL, parcel, barge and RoRo tracking
- Mo, an AI analyst that answers questions from shipment data
- Agentic Workflow Manager for no-code AI agents
- Emissions measurement and reporting for carbon targets
- Carrier tools and data quality dashboards
Pricing
No list price. Vendr's anonymised buyer data puts the median at $48,150 a year, with a range of $21,150 to $77,630.
Pros
- Widest mode list here, including barge, RoRo and intermodal
- Carbon emissions reporting built in
- A Vendr median gives buyers a figure to negotiate against
Cons
- No freight rate benchmark or rate forecast
- A $48,150 median costs an arm and a leg for a five-person team
- Tracking gaps reported when a carrier swaps the truck mid-load
Reviews are sparse, which is par for the course in freight software: project44's freight API listing on Capterra India shows 4.0 from 3 reviews. A trucking reviewer wrote in July 2019 that "P44 does all of the setup needed behind the scenes with out much needed from the consumer." A 2021 reviewer was blunter: "The airfreight doesn't work," after seven months of paying without a working platform.
Why it's ranked #6. project44's 1.5B+ yearly shipments and a $48,150 Vendr reference beat FourKites, which publishes neither a price nor a yearly shipment figure. It loses to Greenscreens because it carries no rate benchmark.
FourKites
Best fit
Food, beverage and consumer goods brands that want AI agents to handle carrier check calls, appointments and supplier follow-ups.
FourKites runs a visibility network across 176 countries and 3.6 million facilities, with 246K+ active carriers, 1,600+ global brands and 3.2M+ tracked events a day. Its mission page puts the count of supply chain events monitored at 1,206,841,400. The current product sells AI agents, each named for a job.
Key features
- Tracy for carrier operations and Sam for supplier operations
- Alan for facility operations and Cassie for customer operations
- Polly for compliance and documents
- Sophie, a developer agent for building new workflows
- Appointment scheduling and API integrations with TMS systems
Pricing
No price on the site. The only call to action is a talk with an "Outcome Advisor."
Pros
- 176-country network suits global shippers
- Agents take over manual work like check calls, which is where efficiency gains show up first
- API setup gets good marks from users
Cons
- No price and no Vendr median
- No rate benchmark
- TMS-side setup needs in-house technical staff
Capterra lists FourKites at 4.3 from 3 reviews. A logistics reviewer wrote in August 2022 that "The API setup to connect to our other systems is very easy." A trucking reviewer disagreed in 2019: "Takes quite a bit of tech knowledge on the TMS side to get this setup."
Why it's ranked #7. FourKites' 176-country network beats Truckstop's road-only load board on criterion 4. It loses to project44, which publishes 1.5B+ yearly shipments and has a $48,150 Vendr price reference.
Truckstop
Best fit
Small brokerages and owner-operator fleets that want lane rates inside the load board they already pay for.
Truckstop is a load board first, with Rate Insights on the higher tiers. It counts 80M annual loads and 250k+ active users. Brokers use it to post loads and find available trucks; carriers use it to find more loads and check the RPM heat map before they accept.
Key features
- Rate Insights benchmarking in real time on broker Pro and Premium
- Book It Now posting and 20 free Load Boosts on broker Pro
- Predictive Carrier Sourcing on broker Premium
- Market Conditions Map and Truck Count by State for carriers
- AI broker assistant browser extension
Pricing
Broker plans are $109, $239 and $369 per user a month, and Rate Insights starts at the $239 Pro tier. A $42 application fee applies. Carrier plans run $42 to $159, with Rate Insights on the $159 Pro plan.
Pros
- Published prices for every tier
- Rates sit next to the loads, so no second login
- 80M annual loads feed the board
Cons
- No published forecast horizon
- No ocean or air data
- Per-user pricing adds up past three seats, so a growing team has to bite the bullet on every new hire
TrustRadius shows Truckstop at 7.4 out of 10 from 14 ratings. A logistics coordinator wrote in December 2023 that "It has an onboard Rate check tool for latest lane rates," then warned in the same review that "the data is becoming less reliable."
Why it's ranked #8. Truckstop publishes $239 for rate access, which beats Descartes MacroPoint's quote-only pricing on criterion 5. It loses to FourKites on coverage: 176 countries against a road-only board.
Descartes MacroPoint
Best fit
Brokers and 3PLs that need load tracking from every carrier, including the small fleets without an API.
Finding a small carrier's truck without tracking is a needle in a haystack, and MacroPoint is Descartes' answer: 435,000+ carriers, logistics providers and drivers and 30,000+ customers worldwide. ELD+ combines telematics and driver mobile app data, so a load keeps tracking when one source drops.
Key features
- ELD+ dual-source tracking from telematics and the driver app
- Capacity Sourcing for finding carriers
- Analytics and Intelligence reporting
- Driver Mobile App with arrival confirmations
Pricing
Not published. Descartes routes buyers to a demo.
Pros
- 30,000+ customers on one tracking network
- Dual-source tracking cuts lost pings
- G2 rates it 4.7 from 913 reviews, the largest review base here
Cons
- No rate benchmark or forecast
- No published price
- Tracking can start late when a truck's first ping lags
G2 shows MacroPoint at 4.7 from 913 reviews. A driver services manager wrote in March 2022 that "One of the best features of MacroPoint is how easy they make it to track integrated carriers," and named the main delay in the same review:
Sometimes there is a delay in which you need to wait for the truck to ping against an unknown variable.
Tore G., Driver Services Manager, G2, 4 March 2022
Why it's ranked #9. MacroPoint's 30,000+ customers and 913 G2 reviews beat Loadsmart FreightIntel AI, which publishes no customer count. It loses to Truckstop, which publishes a $239 price for rate data.
Loadsmart FreightIntel AI
Best fit
Companies already running ShipperGuide TMS that want spend analysis without building reports.
FreightIntel AI runs inside ShipperGuide, Loadsmart's TMS, and Loadsmart announced it on 10 September 2024. It's powered by a $1B+ freight market dataset, a drop in the bucket next to DAT's $1 trillion. It runs in the background and surfaces consolidation opportunities, carrier benchmarking, mode optimization and spend outliers without anyone asking.
Loadsmart claims 97% fully automated shipments, 35% cost savings per lane and a 42% reduction in exceptions. The page gives no method, time frame or sample size for any of the three.
Key features
- Automatic spend outlier detection
- Carrier benchmarking against the Loadsmart dataset
- Consolidation and mode optimization suggestions
- Native in ShipperGuide TMS, or by data upload for other TMS users
Pricing
Not published. Loadsmart asks buyers to contact sales.
Pros
- No data upload for ShipperGuide users
- Findings arrive without an analyst request
- The product aims at shippers, where most tools here serve brokers
Cons
- Headline savings figures carry no method
- Smallest published dataset on this list at $1B+
- Works best inside one vendor's TMS
ShipperGuide's G2 reviews praise ease of use; a customer service specialist wrote in May 2024 that "Using ShipperGuide is super easy and user friendly." The same reviewer asked for "better reporting capabilites by the user," the gap FreightIntel AI is built to close, in a G2 review dated 23 May 2024.
Why it's ranked #10. FreightIntel AI publishes a $1B+ dataset figure, which FreightFox Pulse and LaneSurf don't. It loses to MacroPoint's 30,000+ customers and 913 G2 reviews.
What a freight intelligence platform does
The job is to aggregate and analyze transportation and logistics data until it answers a pricing or freight operations question: which lanes and carriers drive cost, and where the savings opportunities sit. Three inputs dominate: paid invoices and bookings (DAT, Freightos), tracking pings from GPS devices, ELD telematics and driver apps (MacroPoint, project44), and a buyer's own TMS history (Loadsmart, Greenscreens).
On the pricing side, the platform gives visibility into market freight rates by lane and forecasts future rate shifts. On the operations side, it combines shipment and carrier data so a team sees a late load in real time, before the customer calls. project44 describes the predictive half as spotting equipment shortages or network bottlenecks before they occur.
Most of it replaces spreadsheets. A pricing analyst who once pulled lane averages into Excel each morning gets them on real-time dashboards, and the exception email becomes an agent task that tracks carrier performance and freight costs line by line. Freight audit sits next door: Triumph sells audit and payments services, and its letter counted 100+ Greenscreens customers with $13.4 billion in volume who had yet to sign up for them.
Real time market intelligence for freight brokers vs shippers
Freight brokers buy rate tools. A brokerage quoting hundreds of loads a day needs a buy rate and a sell rate per lane in seconds, which is why DAT, SONAR, Greenscreens and Truckstop sit on broker shortlists. Capacity signals count as much as price: SONAR's tender rejection data and Truckstop's truck counts show when available trucks thin out across load boards, the same boards brokers use to find capacity.
Shippers buy benchmarks and visibility. Their question is how their contract rates compare to the market before a tender, and where the freight is once it moves. Xeneta, Freightos Terminal and DAT iQ Benchmark answer the first; project44 and FourKites answer the second.
Intermodal and LTL buyers have fewer options. project44 tracks rail, intermodal and LTL in real time, but none of the ten publishes an intermodal rate benchmark.
Freight intelligence platform pricing
Prices run from Freightos Terminal's $0 tier at the low end to project44's $48,150 Vendr median at the high end. The pattern holds across all ten: tools sold to small brokers publish a monthly price, and tools sold to enterprise shippers don't.
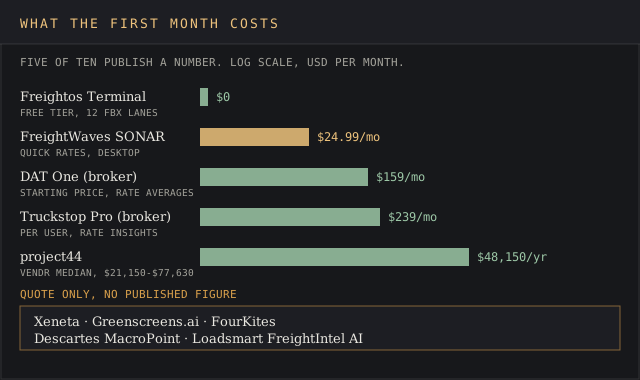
The devil's in the details with add-ons. DAT's 52-week forecast is a separate Ratecast purchase, SONAR sells modules à la carte, and Truckstop charges per user with a $42 application fee. Greenscreens is the outlier, with one flat fee and no per-user cost.
Ask every vendor how many of your lanes have enough reported loads in the past 30 days to price. That figure decides how much of your network the tool covers, and it's the line item that turns a cheap plan into an expensive gap.
Vendor savings claims and how to read them
Talk is cheap, and every vendor in this category publishes a savings number with no outside audit attached. FreightFox says on its Pulse page that freight analytics delivers ~8-15% freight cost savings and a ~10% drop in unplanned transportation costs, then adds that "Figures are approximate."
- FreightFox Pulse: 8-15% lower freight costs, ~70% fewer procurement man-hours, ~10% fewer unplanned transport costs
- LaneSurf: 8–10% better buy rates per load, from its own customer data
- SONAR: one SCI customer cut spot exposure from 20% to 11% and saved 10% of transportation spend
- Loadsmart: 35% cost savings per lane, no method given
- Xeneta: customer ocean rates 23% below the long-term benchmark in the 2025-2026 tender season
Each figure comes from the vendor's best customers and clients, and none states its freight costs baseline. A fair test is your own: price 20 recent lanes in the tool, compare against the invoices you paid, and count how many land within 5%.
LaneSurf works on the other end of the quote. It captures carrier quotes from voice calls, emails, texts and load board responses, then normalizes and ranks them for faster rate comparisons, with onboarding that the vendor says can begin in under 48 hours.
Carrier performance scoring and freight KPIs
Transporter performance scoring ranks carriers on measurable metrics. FreightFox defines it as ranking on "SLA adherence, on-time delivery, cost competitiveness, and reliability," and lists OTIF, cost per ton-kilometer, vehicle utilization and freight cost as a percentage of revenue among the KPIs it tracks on real time dashboards.
Benchmarking across carriers is the mechanism behind most savings claims. When a procurement team can show a carrier its on-time rate against four others on the same lane, it has a number to negotiate with. DAT iQ Benchmark, project44's carrier tools and Loadsmart's carrier benchmarking all track carrier performance this way. FreightFox's page quotes customer Atul Limited onboarding 300 to 400+ transporters and getting 3–5% better freight rates.
The challenge is data quality in the areas with the fewest loads. A score built on 3 loads is a red flag, so check the sample count before a carrier conversation turns on it.
How to run a trial of freight rate and visibility tools
A two-week trial gives a better understanding than a demo. Pull 20 lanes your team quoted last month, with the rates you paid, and run them through each tool on the same date. Record the gap, the confidence score where one exists, and the sample size behind each rate.
Then walk the vendor through the misses. A tool that shows 3 shipments behind a lane rate is telling you to avoid it on that lane; a tool that shows no sample size leaves you guessing. Ask about integrations with your TMS, how much faster the tool surfaces a bad rate, and how faster quoting turns into booked loads, since that's where the subscription earns its fee.
Freightos Terminal's free tier lets a forwarder hit the ground running on day one, and SONAR's $24.99 plan is cheap enough to run for a month alongside a paid trial. Join each vendor's demo with your 20 lanes in hand, and join the trial only once the vendor agrees to price them.
Market intelligence context: consolidation in 2025 and 2026
Freight data is consolidating into larger financial and software companies. Triumph Financial's purchase of Greenscreens.ai was announced on 26 February 2025 and added $13.4 billion of transactional volume to its network. Descartes runs MacroPoint, and Freightos' index underpins exchange-traded futures.
The buyer's risk is a conflict of interest. When the company that prices your lanes also factors your carriers' invoices, putting all your eggs in one basket hands one vendor both sides of the trade. Ask in writing how your rate data is used and who else sees it, and don't leave the data clauses unread before you sign.
Keep an eye on the news for further deals. For the risk side, the supply chain risk management ranking and the Everstream review cover disruption monitoring, and the supply chain intelligence ranking covers planning suites.
Frequently asked questions
Who is the biggest freight brokerage?
Size depends on the measure: revenue, shipments or freight under management. C.H. Robinson reports 37 million shipments a year, $23 billion in freight under management, 450,000 contract carriers, 75,000 customers and $16B in 2025 revenue.
What is a digital freight platform and what are its benefits?
A digital freight platform books freight online: a shipper or forwarder gets instant quotes and books without a phone call. Freightos is one, and its booking data feeds Terminal. The market intelligence benefit is that every booking becomes a price point, which is how Freightos collects 50 to 70 million a month.
What is logistics intelligence?
Logistics intelligence applies analytics to shipment, carrier and facility data to predict delays and bottlenecks and to gain operational efficiency. It's the visibility half of this category; project44 and FourKites are logistics intelligence vendors, while DAT and Xeneta sell rate intelligence.
What is FTR in trucking?
FTR Transportation Intelligence is a freight forecasting firm based in Bloomington, Indiana. Its monthly Trucking Update, listed under Trucking Solutions on its site, costs less than $150 a month on Standard and under $300 on Premium, with forecasts for trucking demand, utilization and rates by equipment type from its Freight•cast model. It's a forecast subscription, so it sits outside this ranking of software platforms.
Bottom line
US truckload brokers and shippers should start with DAT iQ: the largest invoice base and the longest forecast. Teams that tender ocean and air contracts belong on Xeneta, and anyone who wants a daily truckload read for $24.99 a month gets it from SONAR.
Forwarders can test Freightos Terminal for free before spending anything. Brokerages pricing hundreds of loads a day should put Greenscreens.ai next to DAT in a trial, and enterprise shippers who need to see the freight once it moves should compare project44 against FourKites on their own lanes.