Industrial data analytics software: 10 platforms ranked for 2026
 By Jan Suski. I go deep on every review, checking every number against its source and digging up details other coverage misses, a habit from six years of SEO and link building for tech companies. Bylines at Surfer, Brand24, and Senuto. How the scoring works.
· Prefer this source on Google
Quick comparison of industrial data analytics platforms
The table lists the ten industrial analytics solutions in ranked order. The connectivity column carries each vendor's own published figure for how much industrial data it reaches; the price column carries the cheapest published number or the word quote.
| # | Provider | Connectivity figure (vendor-published) | Entry price | Best fit |
|---|---|---|---|---|
| 1 | Seeq | Reads AVEVA PI in place, integrated for over a decade | Quote | Process engineers in oil & gas, chemicals, pharma |
| 2 | AVEVA PI System | Hundreds of connectivity options; 40+ years in plants | Quote (subscription) | Multi-site operators that need one historian of record |
| 3 | Cognite Data Fusion | 90+ extractors and connectors | Quote | Asset-heavy firms building one contextualized data model |
| 4 | TrendMiner | Used by 48% of the top 50 chemical makers | Quote | Chemical plants wanting fast self-service trend analysis |
| 5 | Siemens Insights Hub | Packages from 500 to 500,000 asset attributes | Quote | Discrete manufacturers tracking OEE and energy |
| 6 | Proficy CSense (Velotic) | Sub-second to microsecond data via Proficy Historian | Quote, 30-day free trial | Proficy Historian sites that want prescriptive tuning |
| 7 | Litmus | 250+ types of OT systems | $1,500/month per site | Multi-plant edge data collection with KPIs on top |
| 8 | Canary Labs | 3,500 tags at entry, slider to 100,000+ | $3,980/year | Plants that want a cheap historian with industrial analytics basics |
| 9 | Ignition | Unlimited tags, clients and devices per server | $1,200 platform, modules extra | Industrial automation integrators building SCADA and reporting |
| 10 | Braincube | Over 250 manufacturers worldwide | Quote | Continuous-process plants buying ready-made industrial analytics solutions |
Every dollar figure is the price the vendor publishes on its own pricing page. "Quote" means the vendor publishes none.
Where these figures come from
Connectivity counts, customer outcomes and prices are each vendor's own published figures, read in October 2026. Ratings and user quotes come from G2, Gartner Peer Insights, Capterra and Hacker News and link to the page they came from; our report on G2's review moderation covers how G2 vets reviewers.
Seeq, AVEVA, Cognite, TrendMiner, Siemens, Proficy CSense and Braincube publish no price, and TrendMiner and Braincube publish no connector count, so no row claims one.
Plant-level demand and production forecasts sit on the manufacturing forecasting software ranking, IT log and machine-data monitoring on the operational intelligence platforms ranking, and national output statistics on the industrial production database ranking. This page ranks ten tools that analyze a plant's own historian data.
Industrial data analytics turns the raw data a plant already stores in its historian into actionable insights an engineer can use before the next shift. A refinery, a pharma suite or a bottling line writes thousands of tags a second, and the industrial analytics solutions on this page read that real time data, line it up with batch, maintenance and quality records, and show why a unit drifted.
Seeq reports a 25% reduction in downtime for one pharmaceutical customer, which is the kind of number industrial analytics platforms sell on.
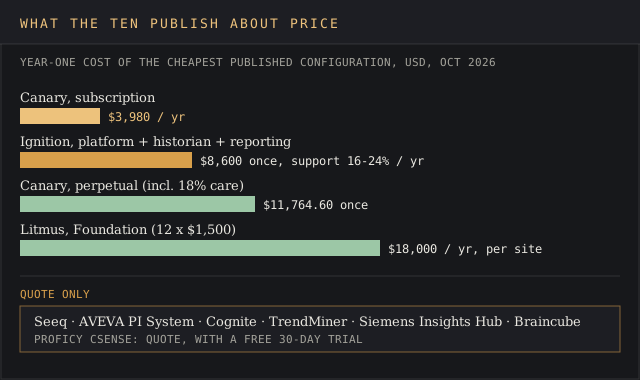
This ranking covers ten industrial analytics solutions, from self-service tools that sit on top of an existing historian to DataOps layers that move and model industrial data before anyone tries to analyze data in it. Three of the ten publish a price. The other seven sell by quote, so the pricing notes lean on what each vendor does publish: tier limits, trial terms, support percentages.
It's written for process engineers, reliability leads, data scientists and the plant IT people who'll run whatever gets bought. If your team wants general BI over business tables, the data analysis tools ranking fits better. If the question is how an order moves through ERP, process intelligence software is the right shelf.
Timing matters this year. Three of the ten changed owners between January 2023 and March 2026, and one of them, the former GE Proficy line, now ships under a new company name. A buyer signing a five-year term in 2026 should know who'll be cashing the renewal checks, since many digital transformation contracts outlast an owner.
Evaluation criteria for industrial data analytics platforms
Four criteria decide the shortlist, and the ranking below applies them in this order. Each one is a test a buyer can run during a trial or a sales call and come away with a yes, a no or a number, which keeps the comparison of industrial analytics tools on a level playing field.
Hours to a first engineer-built analysis
Give a process engineer read access to one historian and one asset, no vendor consultant, and time how long it takes to analyze data around a known excursion and find its cause. Vendors that publish this number get credit for it: TrendMiner claims about four hours against 1 to 30 days for the legacy approach. A tool that needs a data science team to answer a routine question fails the test, however good its data models are.
Documented connectivity to existing industrial systems
Count the connectors the vendor documents for historians, control systems, MES, ERP and LIMS, and check that yours is on the list by name. Data silos are the usual reason industrial analytics projects stall. Cognite publishes 90+ extractors; Litmus publishes 250+ OT system types. A platform that only reads data after you copy it into a new store adds a data processing and migration project to every deployment.
A customer outcome with a number on the vendor's own site
Look for a named customer, a metric and a figure: 64 days of downtime avoided through predictive maintenance, a 15% OEE gain in manufacturing processes. Generic claims about efficiency don't count. This doesn't prove the tool will do the same for you, but a vendor with no published figure gives you nothing to hold it to.
A published price
A buyer should be able to find a dollar figure without booking a demo. Canary, Ignition and Litmus pass. Seven vendors don't, which is par for the course for industrial analytics solutions, and it's the last tiebreaker here because a published price rarely covers the analytics layer by itself.
The 10 best industrial data analytics platforms, ranked
Seeq
Best fit
Process and reliability engineers at oil & gas, chemical and pharma sites who already run a historian and want industrial analytics they can run without waiting on IT.
Seeq is a self-service industrial analytics platform for advanced analytics on time-series data. It connects directly to historians, data lakes and other sources, so the data stays where it is. Its connectivity page says a team can connect its first data source "in hours, not weeks" and that Seeq & AVEVA have been integrated for over a decade, which matters because most of Seeq's target plants already run PI.
On its homepage, Seeq claims 1.5 to 3 hours of engineering time saved per engineer per day, a 25% capacity increase for one oil and gas customer and a 75% cut in taste complaints for one food & beverage customer. Each is a single-customer result, so read between the lines before quoting it to a finance team.
The product line now runs as Seeq Analytics, Seeq Enterprise and Seeq Intelligence, the last of which adds an agent called Agent Q that reaches across operational data systems.
Key features
- Seeq Analytics: point-and-click time-series cleansing, conditions (capsules) and calculations for process engineers
- Seeq Enterprise: shares an engineer's analysis across sites as a repeatable workflow
- Seeq Intelligence with Agent Q, an agentic AI layer across connected operational systems
- Connectivity partners named on its site: AWS, Microsoft Azure, Databricks and AVEVA
- ISO/IEC 27001:2022 and ISO 27018:2019 certification, announced on its company page
Pricing
Seeq doesn't publish a price; it sells through sales-led quotes. On G2, reviewers report a 4-month average implementation, a 13-month average payback and a 14% average discount, across a 4.6 rating from 150 reviews.
Pros
- Reads PI and other historians in place, so there's no data migration before the first analysis
- Vendor-published outcomes with figures: 25% less downtime, 25% more capacity at named customer types
- 150 G2 reviews at 4.6, the largest review base in this ranking
Cons
- No public price, so budgeting starts with a sales call
- Reviewers repeatedly flag the learning curve for engineers new to signal processing
- Tag search against PI naming conventions gets fiddly: one G2 reviewer called finding "the exact pi tag name" frustrating
A G2 reviewer, Head of Refining Analytics at a mid-market firm, wrote on 23 September 2025: "Outstanding and intuitive capability for analyzing time series data." The recurring complaint shows up in another G2 review:
"Sometimes the learning curve can be a bit steep, especially for newer users unfamiliar with signal processing concepts."
G2 review, Manufacturing Data Analytics Engineer (APAC), enterprise, 8 April 2025, via G2
Why it’s ranked #1. Seeq beats AVEVA PI System on the first criterion: it claims 1.5 to 3 engineer-hours saved daily and a first source connected in hours, while PI's industrial analytics run through add-ons. No other entry publishes both figures.
AVEVA PI System
Best fit
Multi-site operators in oil & gas, power, mining and pharma that need one historian of record for every plant.
The PI System is the historian much of heavy industry already uses to record readings from sensors and control systems; Seeq, a data analytics vendor, has integrated with it for over a decade. AVEVA's product page says all 25 of the top 25 pharma companies, 9 of the top 10 mining companies and more than 1,000 power utilities use it, and that 75% of the world's crude oil, natural gas and liquids are produced with it.
Plants have relied on PI for over 40 years, which makes it the default source of manufacturing data for any industrial analytics platform sold into these sectors.
AVEVA, which owns the PI System, was taken private by Schneider Electric, a deal AVEVA announced as complete on 18 January 2023. The same product page cites TotalEnergies avoiding 64 days of rotating-equipment downtime and saving 1.5 million euros in 2022 with AVEVA Predictive Analytics, a predictive maintenance figure as concrete as anything else on this page.
Key features
- AVEVA PI Server and AVEVA Edge Data Store, collecting real time data at sub-second granularity
- Connectivity through PI Interfaces, PI Connectors and AVEVA Adapters, which AVEVA counts in the hundreds
- Add-ons: AVEVA PI Vision, PI DataLink for Excel, PI Integrator for Business Analytics, RtReports
- CONNECT, AVEVA's cloud industrial intelligence platform, for cross-site data sharing
Pricing
AVEVA lists no prices. The PI page says it is moving PI to a subscription-based commercial model that can mix on-premises and cloud components, and it routes buyers to an account rep to set the contract. Long-time perpetual owners who move over bite the bullet on a new cost basis, so get the subscription math in writing.
Pros
- The installed base: 25 of the top 25 pharma firms and 1,000+ power utilities
- Four decades of plant data formats and interfaces behind it
- Named predictive-analytics outcome: 64 days of downtime avoided at TotalEnergies
Cons
- Data analysis needs add-ons or a third-party industrial analytics tool on top; the historian alone is storage plus trends
- No published pricing, and the move to subscription changes the cost basis for long-time perpetual owners
- Users report the PI Vision display layer is the weak link
A Gartner Peer Insights reviewer, a chemist at a manufacturer, wrote on 11 March 2026: "I love the visibility the PI system gives me into our production plants." The cost side came up years earlier on Hacker News:
"It's closed source and you have to pay for it, so it's probably not attractive to startups and smaller companies."
Hacker News comment by apohn, 25 January 2018, via Hacker News
Why it’s ranked #2. PI beats Cognite on connectivity, with hundreds of documented interfaces against Cognite's 90+, and on install base, with 25 of 25 top pharma firms. It loses to Seeq because engineer-built analysis needs add-ons.
Cognite Data Fusion
Best fit
Asset-heavy industrial operations in energy and manufacturing that want one contextualized model of assets, time series, documents and work orders before building AI on it.
Cognite Data Fusion is an industrial DataOps platform: it extracts operational data from OT and IT systems, links it to an asset hierarchy and exposes the result to apps, machine learning models and AI agents. Cognite's product page lists 90+ ready-to-use extractors and connectors and cites a three-year ROI of 465% with $29.4M in total benefits, of which $14.5M came from less unplanned downtime.
The company hit the ground running: it was founded in 2016 in Norway, employs more than 500 people and became Norway's first unicorn after a $150M round. That's young for this list, and it shows in the product: the data model for complex data is the selling point, and the engineer-facing analysis tools sit on top of it.
Key features
- 90+ extractors for historians, SCADA, ERP and engineering documents
- Cognite Atlas AI for industrial agents built on the contextualized model
- Industrial Canvas for collaborative investigation, plus InField and Maintain apps for field work and predictive maintenance planning
- Cognite Flows for workflow automation and an AI Solutions Library
Pricing
Cognite publishes no prices and sends buyers to a product expert. Plan for a platform contract plus services; the "Quick Start" and "Success Tracks" offerings on its site are services sold alongside the platform.
Pros
- 90+ extractors cover the usual industrial data sources out of the box
- Published three-year benefit breakdown: $10.7M production, $10.5M staff efficiency, $14.5M downtime
- Puts documents, P&IDs and work orders in the same model as the information generated by sensors
Cons
- Only 3 reviews on G2 and 2 ratings on Gartner Peer Insights, so independent evidence is thin
- Modeling complex data comes first; the early months need data science and modeling time before a process engineer gets a quick trend answer
- No public price or trial
A Data and Analytics Manager reviewing Cognite on Gartner Peer Insights on 10 August 2026 wrote "It's great for unifying complex industrial data by creating a single version of the truth", then added the caveat behind the review's title: "In the automobile, energy or gas industries its difficult to bring the data into 1 place".
Why it’s ranked #3. Cognite beats TrendMiner on documented connectivity, with 90+ named extractors against no published count, and publishes a $29.4M three-year benefit figure. It loses to PI's hundreds of interfaces and installed base.
TrendMiner
Best fit
Chemical and process plants that want engineers to analyze data and search historian trends for patterns within an afternoon of setup.
TrendMiner is a self-service industrial analytics tool built around pattern search on historical data, which lets engineers identify trends across years of a unit's history. Its homepage says it's used by 48% of the 50 largest chemical manufacturers (2024 listing), serves 28 industry segments and delivers time to value in about four hours, against 1 to 30 days for the legacy approach. It also cites customer-reported value of $500k+ per site per year.
Ownership has moved since the platform launched. In April 2024 German industrial-data firm Proemion agreed to buy it from Software AG, keeping the TrendMiner brand. Buyers should keep an eye on how the roadmap tracks Proemion's mobile-equipment focus.
Key features
- Time-series and event analytics with pattern search across years of industrial big data in the historian
- 24/7 monitoring of real time data with alerts built from saved searches
- Analytics Agent, an agentic AI assistant
- Data Catalog and contextualization across MES, QMS, ERP, field data and shift logs
- Statistics, machine learning and other advanced analytics modules
Pricing
TrendMiner's pricing page carries no figures; it books a call. A free demo is offered, with no trial terms published.
Pros
- Four-hour vendor-stated time to value, the most specific published figure on this list
- 4.6 rating from 179 G2 reviews
- Strong footprint in chemicals: 48% of the top 50
Cons
- Cost complaints reach budget holders, per G2 reviewers
- No dedicated mobile app; the interface assumes large screens
- Owner changed in 2024, from Software AG to Proemion
An MES Architect at an enterprise wrote on G2 on 25 September 2024: "Using Trend Miner is so easy, that users don't need extensive training to use the software." A Process Control Engineer's 1 October 2025 G2 review put the con in six words: "Too Expensive for our higher level management".
Why it’s ranked #4. TrendMiner beats Siemens Insights Hub on the first criterion with a published four-hour time to value. It trails Cognite on connectivity: Cognite names 90+ extractors and TrendMiner publishes no count.
Siemens Insights Hub
Best fit
Manufacturing companies on Siemens industrial automation that want OEE, energy usage and asset performance apps on a cloud industrial internet of things platform for Industry 4.0 pilots.
Insights Hub is the industrial analytics platform Siemens sold as MindSphere until the rename, and its product page now lists seven industrial analytics apps, including Insights Hub OEE, Energy Manager, Energy Optimizer and Quality Prediction.
One customer case there, Vorwerk Elektrowerke, collects 7,500 data points every 15 seconds from 500 connected machines and reports an OEE improvement of around 3 to 5% across those manufacturing processes. BorgWarner monitors energy use at 63 locations in 20 countries.
Siemens's own pricing and packaging post describes Basic, Standard and Premium capability packages sized by asset attributes in four steps: 500, 5,000, 50,000 and 500,000. That is the closest thing to a published scale ladder among the quote-only vendors.
Key features
- Insights Hub OEE for overall equipment effectiveness across lines
- Energy Manager and Energy Optimizer for metering and load optimization
- Asset Health & Maintenance for predictive maintenance, plus Quality Prediction for quality control
- Production Copilot and Copilot Studio for generative AI on shop-floor data
- Add-ons: Visual Explorer, Remote Services, and Predictive Learning for predictive analytics models
Pricing
No figures are published. The packages scale by asset attributes (500 to 500,000) and five cloud resource pack sizes from extra-small to extra-large. In a nutshell, the bill grows with assets modeled and cloud capacity.
Pros
- Packaged OEE and energy apps, so a plant doesn't build those dashboards from scratch
- 4.5 rating from 115 Gartner Peer Insights ratings and 69 G2 reviews
- Published customer figures: 7,500 data points, 500 machines, 3 to 5% OEE
Cons
- Reviewers report repackaging and lower API rate limits on cheaper plans
- Report design customization is limited, per G2 reviewers
- Cloud-first; plants with strict OT isolation need an edge design
A Group Product Manager in consumer goods titled a 31 July 2026 Gartner review "Strong Industrial Analytics Platform with Significant Untapped Potential" and wrote that "Insights Hub offers significant capabilities and long-term potential". A Mechatronic Engineer's 4 September 2025 review there carried a sharper title: "Effortless Setup Offset by Changes in Packaging and Reduced Rate Allowances".
Why it’s ranked #5. Insights Hub beats Proficy CSense on documented outcomes, with a named 3 to 5% OEE gain across 500 machines and 115 Gartner ratings. It loses to TrendMiner's published four-hour time to value.
Proficy CSense (Velotic)
Best fit
Plants already on Proficy Historian or iFIX that want troubleshooting, process digital twins and prescriptive analytics with closed-loop setpoint tuning from one vendor.
CSense is the analytics product in the Proficy line, and the line changed hands this year. GE Vernova completed its sale of Proficy to TPG for $600 million on 2 March 2026, describing a business serving more than 20,000 customers. TPG has since combined Proficy with PTC's former Kepware & ThingWorx units under the Velotic name. Buyers renewing in 2026 should get their account team up to speed on which entity now holds the contract.
GE Vernova's CSense page claims first actionable insights in hours and gains of up to roughly 10%, offers a free 30-day trial, and describes five capabilities running from diagnostic to prescriptive analytics: analyze, monitor, predict, simulate and optimize. Paired with Proficy Historian, it works at sub-second and microsecond resolution. Velotic's site lists a 15%+ OEE improvement across Bharat Forge production lines.
Key features
- Troubleshoot: root-cause analysis on asset and process performance
- Process Digital Twins of industrial processes, built by process engineers
- Closed-loop optimization that tunes setpoints and PID control loops
- Native pairing with Proficy Historian and Kepware connectivity under the same owner
Pricing
Quote-based. The 30-day free trial is the only published commercial term, and it's the only free trial published by the seven quote-only vendors.
Pros
- Goes as far as prescriptive control, closing the loop to setpoints and PID tuning
- 30-day free trial, published on the product page
- Kepware Server and Kepware Edge connectivity now sit under the same owner
Cons
- Brand and owner both changed in 2026; support and licensing contacts may move
- Thin independent review base: CSense has 1 G2 review, Proficy Historian 3
- Fits best inside the Proficy industrial automation stack; outside it, connectivity work grows
The one detailed Proficy Historian review on G2, from a mid-market reviewer who rated it 2.5 of 5, ran under the headline "Waiting for data to decompress disrupts my workflow" and said:
"The retrieval system of the Proficy Historian sometimes appears to be awkward and sluggish."
G2 review, mid-market (51 to 1,000 employees), via G2
Why it’s ranked #6. CSense beats Litmus on the first criterion: it claims first insights in hours and offers a 30-day trial to prove it. It loses to Insights Hub on outcomes, where Siemens publishes figures across 500 machines.
Litmus
Best fit
Manufacturers rolling out a standard edge data layer across many manufacturing facilities, with KPIs and AI models running at each site.
Litmus Edge handles data capture, normalization and storage at the plant, and Litmus Edge Manager runs the fleet centrally. The pricing page says the Foundation plan collects data from 250+ types of OT systems and starts at $1,500 per month, site-based. The homepage cites one customer that deployed 95 sites in 18 weeks and another reporting $3M per month in savings from packing and volume tracking.
Industrial analytics proper, meaning KPI calculations on real time data and edge AI/ML model serving, starts on the Growth plan, which is quote-only. The devil's in the details here: the published $1,500 buys the data layer, and the analysis layer costs more.
Key features
- Litmus Edge: raw data collection from 250+ OT system types, normalization and edge storage
- Litmus Edge Manager for central management across sites
- Litmus Unify, an MQTT-based Unified Namespace with ISA-95 hierarchies, a common Industry 4.0 data pattern
- Litmus MCP Server and Data Catalog for AI agents and governance
- A free Litmus Edge Developer Edition
Pricing
Foundation starts at $1,500 a month per site, or $18,000 a year. Growth (analytics, KPIs, edge ML) and Scale (SDKs, SSO/SAML, digital twins) are custom quotes.
Pros
- A published entry price, rare among edge platforms
- 250+ OT system types at the entry tier
- 95-site rollout in 18 weeks as a published reference
Cons
- KPI and ML analytics need the quote-only Growth tier
- Per-site pricing adds up: 20 plants at Foundation is $360,000 a year before analytics
- Reviewers report gaps in legacy-platform integration and file sharing
A Gartner Peer Insights reviewer in transportation wrote on 6 February 2025: "The system, called Litmus Edge, is proving practical for controlling data at industrial locations."
Why it’s ranked #7. Litmus beats Canary on connectivity, reading 250+ OT system types against Canary's historian-centered collectors. It loses to CSense on the first criterion, since Litmus analytics sit in a quote-only tier with no trial.
Canary Labs
Best fit
Single plants and utilities that want a historian with descriptive industrial analytics at a price they can read off a web page.
Canary is a time-series historian with Axiom for data visualization and dashboards, Virtual Views for asset models and a Calculation Server for KPIs. The pricing page shows a 3,500-tag subscription at $3,980 a year, or a perpetual license at $11,764.60 including 18% CustomerCare, both with unlimited Axiom and Excel clients. Canary doesn't beat around the bush on price, and it says it has more than 30,000 installations in over 70 countries since 1985.
Key features
- Canary Historian with Data Collectors and Store & Forward, which buffers raw data during network outages
- Axiom dashboards and trends, unlimited clients on both license types
- Calculation Server for KPIs on real time data and history, plus Events
- ODBC Connector for BI tools: $2,500 one-time or $1,000 a year
- Private Cloud in US Azure from $12,320 a year for 3,500 tags, plus a $1,500 setup fee
Pricing
$3,980 a year by subscription or $11,764.60 perpetual at 3,500 tags. Private Cloud runs $12,320 to $58,684 a year from 3,500 to 60,000 tags. Enterprise licensing with unlimited tags and SOC 2 Type 2 compliance is quoted.
Pros
- The lowest published entry price on this list
- Unlimited Axiom and Excel clients, so seat counts don't drive cost
- 30,000+ installations over four decades
Cons
- Industrial analytics stop at trends, calculations and events; no ML or root-cause tooling
- Private Cloud is US-only Azure; hosting elsewhere needs a custom quote
- SOC 2 Type 2 is listed under Enterprise licensing
An engineer commenting on Hacker News on 5 May 2021 described the switch away from a costly incumbent historian this way: "Always nice when we get to just swap it out for something like Canary or even Ignition".
Why it’s ranked #8. Canary beats Ignition on the cost of an analytics-ready stack: $3,980 a year with unlimited clients against $8,600 in Ignition modules. It loses to Litmus, which reads 250+ OT system types.
Ignition
Best fit
System integrators and industrial automation teams that build SCADA, historian and reporting on one platform and want to pay per server.
Ignition by Inductive Automation is a SCADA and industrial automation platform licensed per server with unlimited tags, clients and devices. The price list puts the Ignition Platform at $1,200, the Historian suite at $3,500, the Reporting Module at $3,900 and the Perspective Module at $11,225. Ignition Edge IIoT costs $945.
Support is a percentage of retail, billed annually: 16% for BasicCare, 20% for TotalCare and 24% for PriorityCare. Skip support and a major version upgrade costs 65% of current retail, a bitter pill to swallow on an $8,600 stack. Ignition earns its place here through its historian and reporting, where many mid-size plants run their first industrial data analysis.
Key features
- Unlimited tags, clients and devices per server license
- Historian suite and Reporting Module for trends and scheduled reports
- Perspective for HTML5 dashboards of real time data on any device
- Ignition Edge with 35 days of internal storage, and a Cloud Edition on AWS or Azure
Pricing
$1,200 platform, $3,500 historian, $3,900 reporting: $8,600 one-time for a basic analysis setup on one server, plus 16% to 24% a year for support.
Pros
- Fully published price list
- No tag or client limits, which G2 reviewers name as the main draw
- Free, fully functional trial download
Cons
- Industrial analytics are reporting and trending; no pattern search or ML out of the box
- Reviewers call the Reporting Module dated
- Support queues: one Capterra reviewer reported waits of hours
An Automation Specialist wrote on G2 on 16 July 2026 that Ignition "Integrates with all the major industrial protocols and software standards." An Instrumentation and Controls Engineer in semiconductors had the opposite experience with support on Capterra on 8 February 2021: "Their Customer care is always busy with wait times of hours."
Why it’s ranked #9. Ignition beats Braincube on price transparency, publishing every module from $945 up while Braincube publishes none. It loses to Canary, whose $3,980 subscription covers analytics clients Ignition charges $8,600 for.
Braincube
Best fit
Continuous-process manufacturers that want prebuilt industrial analytics apps for production processes.
Braincube sells an industrial analytics platform built on manufacturing data, with ready-made apps that optimize operations on continuous lines through real-time process optimization and productivity management. Its site says it serves over 250 manufacturers worldwide, and a CertainTeed director of advanced manufacturing is quoted there on its fit across plants.
It runs an annual Go Beyond Summit, held 16 to 18 June 2026 in Chicago, yet it flies under the radar next to Siemens and AVEVA, with fewer published customer figures than any vendor here.
Key features
- Real-Time Process Optimization app for continuous lines
- Productivity Management System for plant and corporate KPIs
- Ready-made industry apps for data collection and analysis
- Role views for leadership, IT, engineering and frontline teams
Pricing
Quote only, through a contact-sales form.
Pros
- Prebuilt apps shorten setup for standard continuous-process questions
- 4.6 rating from 85 Gartner Peer Insights ratings
- 250+ manufacturer customer base
Cons
- No published price, trial or connector count
- Fewer published customer figures than any other vendor here
- Reviewers report some functionality arrived later than promised
A CEO in IT services titled a 3 August 2024 Gartner review "Braincube's Role in Boosting Productivity and Lowering Costs". A dislike posted on the same page reads: "Some of the functionality was not available from the get go."
Why it’s ranked #10. Braincube has 85 Gartner ratings at 4.6 and 250+ manufacturer customers, but it publishes no price, trial or connector count. It loses to Ignition, which publishes every module price from $945.
What industrial data analytics covers
Industrial analytics refers to collecting, cleaning and analyzing data generated by industrial equipment, control systems and production processes, then using it to change how the plant runs. The raw data is mostly time series: temperature, pressure, flow, vibration, current, written by sensors and PLCs into a historian at one-second or sub-second intervals. AVEVA's PI System collects readings with sub-second granularity; Proficy Historian goes down to microseconds.
What separates industrial data analytics from general data analytics is context, and it's the first thing to test in any manufacturing industry evaluation. A temperature tag means nothing without the batch it belongs to, the asset it sits on and the maintenance record of the pump next to it. That's why Seeq's capsules, TrendMiner's event analytics and Cognite's asset model all exist: each attaches context to the time series before anyone runs a calculation.
The four types of industrial data analytics
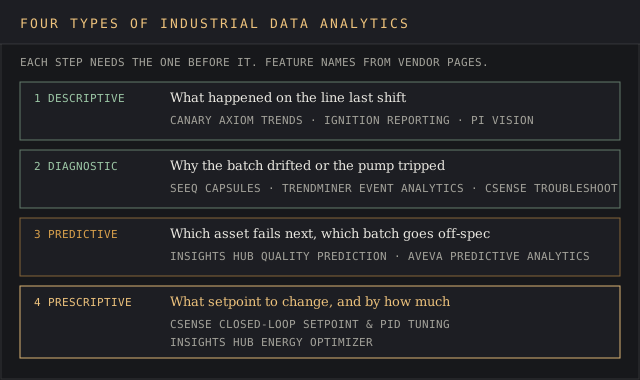
- Descriptive analytics summarizes historical data to show what happened: a shift report, a trend, an OEE number. Canary Axiom and Ignition Reporting live here.
- Diagnostic analytics finds the cause of a past outcome, such as why a batch went off-spec. Seeq and TrendMiner are built for this.
- Predictive analytics uses historical data and machine learning to forecast an outcome, such as which bearing fails next. Insights Hub Quality Prediction and AVEVA Predictive Analytics sit here.
- Prescriptive analytics recommends or applies an action. CSense closes the loop by tuning setpoints and PID loops, so the automated system acts without waiting for an operator.
Each step depends on the one before. A plant that can't trust its descriptive numbers because of data quality problems won't get value from prescriptive analytics. Buying a predictive tool before the historian is clean sends a team back to square one within a quarter. Start where the data is.
Industrial analytics within Industry 4.0
Industry 4.0 is the umbrella term for connecting machines, sensors and enterprise systems so data moves between them. Industrial analytics is the part of Industry 4.0 that turns that connected data into decisions about industrial processes.
Industrial internet of things projects, edge computing and cloud data lakes are the plumbing of Industry 4.0; the analysis layer is where a process engineer sees a return. McKinsey's 2017 manufacturing analytics study reported EBITDA margin improvements of as much as 4 to 10 percent from advanced analytics in manufacturing processes. That figure is why digital transformation budgets keep a line for it.
Plants that jump on the bandwagon with an AI pilot before the historian is clean usually stall at the first data quality review.
Applying industrial analytics: from raw data to business outcomes
Applying industrial analytics follows the same path at almost every site. Data generated by sensors and control systems arrives as raw data; a historian keeps it; data processing cleans it and adds context; data analysis turns it into actionable insights; and a person or an automated system acts on the result. Industrial analytics refers to that whole chain, from data capture at the machine to the change on the plant floor.
The information generated along the way is large. At one-second sampling, a 3,500-tag historian writes about 302 million values a day, and that's the entry tier on Canary's price list. Industrial big data at that scale is a needle in a haystack problem: the excursion that matters is one capsule among thousands, which is why pattern search and condition logic matter more than raw compute.
Data analytics infrastructure a plant needs first
- A historian of record (PI, Canary, Proficy Historian or Ignition) with clean tag names and sane compression
- An asset hierarchy that maps tags to industrial equipment and industrial machinery
- Connections to MES, LIMS and maintenance systems, so data analytics can join process data to events
- Network paths from industrial environments to wherever the analysis runs, edge or cloud
Plants that skip this data analytics infrastructure end up cleaning tags after the license is signed.
Machine learning, deep learning and synthetic data
Machine learning models in industrial data analytics mostly predict a quality result or a failure from historical data. Deep learning shows up in vision inspection more often than in time-series work.
Synthetic data and test data help when failures are rare: a pump that fails once in five years gives a model almost nothing to learn from. Seeq, Cognite's Atlas AI and Insights Hub's Predictive Learning add-on are industrial analytics platforms that package machine learning for engineers who aren't data scientists.
Measuring business outcomes
Business outcomes from industrial data analytics land in four places: uptime, yield, energy and quality. Customer satisfaction improves downstream when off-spec product stops shipping. Cognite's published three-year figures split $29.4M of benefits into production ($10.7M), staff efficiency ($10.5M) and downtime ($14.5M), the most detailed breakdown any vendor on this list publishes.
Ask all ten industrial analytics platforms for the same split from a reference customer in your manufacturing industry.
Industrial analytics in a digital transformation program
Most industrial analytics and data analytics purchases now arrive inside a digital transformation budget, next to MES upgrades, cloud migration and Industry 4.0 pilots. That shapes the buying committee: digital transformation leads care about enterprise operations and standard data models across sites, while plant engineers care about the next shutdown. Both views bring something to the table, and both belong in the room before anyone signs.
Digital transformation programs fail at the hand-off between pilot and rollout. A pilot on one unit works because a motivated engineer babysits it; the second site has different tag names and a different historian. Litmus's 95 sites in 18 weeks and Seeq Enterprise's site-to-site sharing are both answers to that rollout problem, and both are worth testing during the trial while the vendor still wants the deal.
Data-driven decision making is the stated goal of nearly every digital transformation charter. In practice it means operational processes change when the data says so: a maintenance planner moves a work order because a vibration trend crossed a limit. If the analysis can't reach the person who owns the decision, the digital transformation spend buys dashboards nobody opens.
Three signs a digital transformation program is ready for industrial analytics:
- Historian coverage on the units that matter, with fewer than a few percent of tags flat-lined
- A named process owner for each use case who'll act on a result
- Budget for year two, since most of the value from data driven decision making shows up after the first rollout
Who runs industrial analytics: engineers, data analysts and data scientists
Industrial data analytics changed hands over the last decade. Process engineers who know the chemistry now analyze data themselves in Seeq or TrendMiner for most diagnostic questions. Data analysts own data analytics reporting and data visualization across manufacturing operations. Data scientists build machine learning models and data mining pipelines for predictive maintenance and quality prediction.
The split matters when choosing industrial analytics platforms, because each group needs to analyze data a different way. A data science team will want notebooks, APIs and big data analytics on cloud storage, which Cognite and Seeq both support.
Process engineers want point-and-click analytics solutions that identify trends without code, which is TrendMiner's pitch. Seeq and Cognite come closest to serving both groups. Pick industrial analytics solutions for the people who'll use them daily, and give the data science team API access on the side.
Where industrial data comes from and why it's hard to use
Most plants hold the information generated by their industrial processes in at least five places: the historian, the control systems (DCS, PLC, SCADA), MES, ERP and a laboratory system (LIMS) for quality results. Each was bought separately to store data for one team, often a decade apart.
Those disconnected systems create data silos, and silos are the main reason a simple question such as "did the new catalyst lot change yield?" takes a week. A question that needs three exports and a spreadsheet to answer is a red flag.
The ranked industrial analytics solutions attack data silos in two ways. Seeq and TrendMiner read sources in place and join them at query time. Cognite, Litmus and Siemens Insights Hub copy data into a central or edge store, model it and serve it out. Reading in place gets a first answer faster; centralizing pays off once five or more teams need the same cleaned data. Neither approach fixes bad tags.
Data quality checks before any analysis
Validate data quality before trusting a model. Flat-lined sensors, compression settings that throw away excursions, clock drift between control systems and renamed tags all produce flawed insights that look correct on a chart.
A stitch in time saves nine: an afternoon spent checking the 20 tags behind a use case saves a month of chasing a phantom correlation in industrial processes that never changed. The Seeq G2 reviewer who struggled to find "the exact pi tag name" was describing a naming problem every industrial analytics platform inherits from the historian.
Edge computing, cloud and data lakes
Edge computing processes sensor data at the plant, close to the industrial machinery, which cuts bandwidth and keeps working when the WAN drops. Litmus Edge, Ignition Edge (35 days of local storage) and AVEVA Edge Data Store all handle real time data this way inside industrial environments.
Cloud computing and data lakes handle cross-site data analytics and model training at scale. Seeq lists AWS, Azure & Databricks as connectivity partners, and Canary sells Private Cloud in US Azure. Most manufacturing facilities that buy industrial analytics solutions end up with the best of both worlds: edge for real time data and control, cloud for history and machine learning.
Use cases with published figures
Every vendor claims the same five use cases. The figures below are the ones a vendor or a named publisher put a number on.
Predictive and proactive maintenance
Predictive maintenance uses historical data on vibration, temperature and run hours to forecast equipment failures and schedule work before a breakdown. It's the most common first project for industrial analytics solutions, because maintenance logs give a clear before-and-after.
The vendor figures for predictive maintenance: Seeq reports a 25% reduction in downtime for one pharmaceutical customer; AVEVA cites 64 days of avoided downtime at TotalEnergies; Cognite attributes $14.5M of its three-year benefit figure to less unplanned downtime. McKinsey's study said predictive maintenance "typically reduces machine downtime by 30 to 50 percent" on manufacturing equipment.
Proactive maintenance programs go a step further and fix the root cause, which improves product quality as well as uptime. Predictive maintenance tells a planner the bearing will fail in three weeks; proactive maintenance asks why that bearing keeps failing and nips it in the bud by changing the lubrication schedule.
Reduced downtime cuts costs directly: every hour a line stands still is lost output plus overtime to catch up. Most industrial analytics solutions support both predictive maintenance and proactive maintenance; the difference is how far the maintenance team follows the analysis. A proactive maintenance program also needs the CMMS work-order history joined to the sensor data, which is where data silos bite again.
Energy usage and cost
Energy is typically the largest controllable operating cost in an industrial facility, according to CrossnoKaye, a refrigeration-energy vendor that reports its customers saw an average 21% reduction in energy costs with its software. That 21% is CrossnoKaye's own customer average, so treat it as a vendor claim.
Real time data from meters and drives identifies energy waste, such as compressors running against closed valves, and energy analytics solutions can optimize energy consumption continuously across production processes. In the ranked group, Siemens Insights Hub Energy Manager and Energy Optimizer cover this.
AVEVA's PI page adds a sustainability figure: TotalEnergies cut CO2 emissions at one site by 15% a year. BorgWarner uses Insights Hub to monitor energy usage at 63 locations.
Quality control
Quality control analytics detect defects early by linking process conditions in production processes to lab results, using real time data from the line and historical data from LIMS.
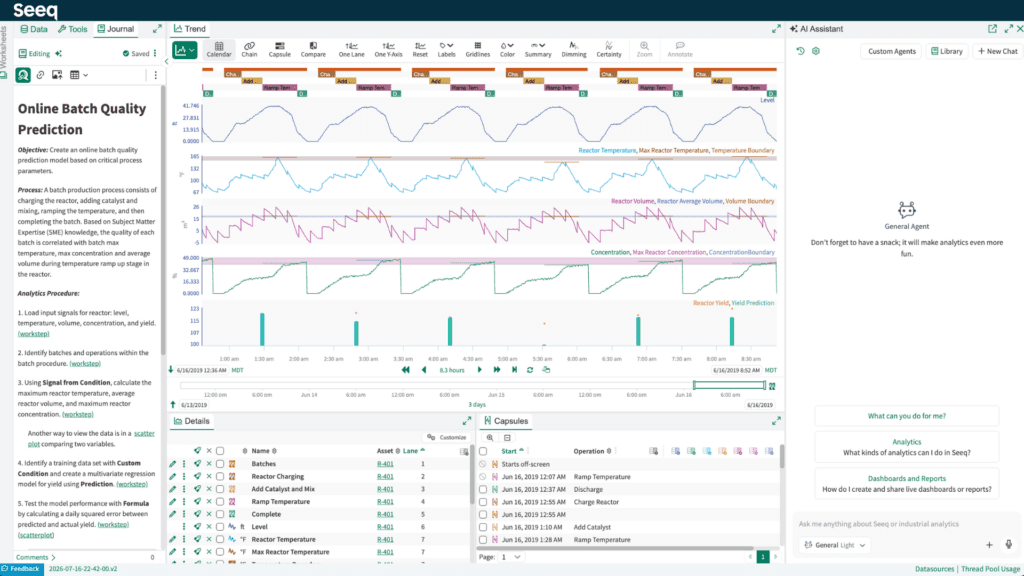
Seeq's 75% reduction in taste complaints for a food & beverage customer is a quality outcome; so is the batch-quality prediction shown in the Seeq screenshot above. Joining LIMS data to historian data is where analytics solutions differ most: a Seeq reviewer on G2 called visualizing "LIMS quality data with time series data" unfriendly.
Overall equipment effectiveness
Overall equipment effectiveness (OEE) multiplies availability, performance and quality to measure how much of a line's planned time produces good parts in discrete manufacturing processes. Siemens's Vorwerk case reports a 3 to 5% OEE improvement; Velotic lists a 15%+ OEE gain across Bharat Forge production lines. OEE is a descriptive metric, so it's where many discrete manufacturers start.
Supply chain management
Plant data feeds supply chain management when production rates and quality holds flow into planning. Synchronizing plant and supply chain data improves demand forecasting and inventory management, and supply chain planners then work from actual line rates. None of the ten specialize in supply chain planning; the supply chain intelligence ranking covers the planning tools that consume this data.
Industrial data analytics pricing across the category
Seven of the ten industrial analytics solutions don't publish a price, and the three that do publish different things. That makes comparing industrial analytics solutions on cost easier said than done unless you normalize to one scenario.
Take one plant with 3,500 historian tags and a team of five engineers who need trends and dashboards. Canary's subscription is $3,980 a year with unlimited clients. Ignition is $8,600 one-time for platform, historian and reporting, plus $1,376 a year for BasicCare at 16%. Litmus Foundation is $18,000 a year for the site, and KPI analytics need the quote-only Growth tier on top.
Hidden costs sit in four places:
- Per-site multiplication. Litmus prices by site, so 20 plants is 20 times the Foundation fee, $360,000 a year, which can cost an arm and a leg before any analytics tier.
- Support percentages. Ignition support runs 16% to 24% of retail a year; Canary's perpetual license adds 18% CustomerCare.
- Upgrade fees. Ignition charges 65% of retail for a major version upgrade without support.
- Services. Cognite and Seeq both sell onboarding and success programs next to the license.
G2 reviewers of Seeq report a 14% average discount, a reminder that quoted prices move. Ask every quote-only vendor for the price at your tag count, user count and site count, in writing, with the year-two figure, before the digital transformation budget is locked.
How to run an industrial data analytics evaluation
Pick one use case with a known answer, such as a predictive maintenance miss from last quarter whose cause the plant already found by hand. Give each shortlisted industrial analytics solution the same historian, the same 20 to 50 tags and the same engineer. Then measure the data analysis itself:
- Hours from login to the engineer finding the known event.
- Hours to find its cause, with the tool joining at least one non-historian source such as maintenance or LIMS.
- If the analysis can be saved and rerun on a second asset without rebuilding it.
- How much data science help the engineer needed along the way.
- The written price for year one and year two at your scale.
Trials are easier for some vendors than others. Proficy CSense offers a free 30-day trial; Ignition has a free, fully functional trial download; Litmus has a free Developer Edition. For quote-only vendors, ask for a paid proof of value with exit terms set in stone before it starts. G2's 4-month average implementation for Seeq is a fair planning figure for a first production rollout.
If the engineer can't find the known event in either tool, fix the data first. Don't put all your eggs in one basket at evaluation stage. Run two tools against the same data for the same weeks, and the side-by-side result settles questions a 45-minute demo leaves open.
Seeq versus TrendMiner
These two industrial analytics platforms belong side by side because both sell self-service analytics solutions for time series to process engineers in chemicals and oil & gas. TrendMiner publishes a four-hour time to value and claims 48% of the top 50 chemical makers. Seeq publishes per-engineer time savings of 1.5 to 3 hours a day and a decade-long AVEVA integration.
G2 scores sit level: Seeq at 4.6 from 150 reviews, TrendMiner at 4.6 from 179. TrendMiner reviewers praise how little training it needs; Seeq reviewers praise its advanced analytics depth and complain about the learning curve.
Seeq ranks higher here on breadth: Seeq Enterprise and Seeq Intelligence push data analysis across sites, and its customer outcomes carry more figures. Plants that want the fastest pattern search, a form of data mining, with the least training should trial TrendMiner first among industrial analytics platforms.
Industrial analytics market size and ownership changes
Meticulous Research projected the industrial analytics market would reach $55.3 billion by 2029 in a 2022 release, at a 16.6% annual growth rate. A later Meticulous forecast, cited by CrossnoKaye, puts it at $78.8 billion by 2032 at 19.1% a year. Both are one firm's estimates; neither is a count of software revenue at the vendors here.
Consolidation is the better signal for anyone running industrial operations on these platforms. When it rains it pours: in under four years,
- Schneider Electric completed its takeover of AVEVA, owner of the PI System, on 18 January 2023.
- Proemion agreed to buy TrendMiner from Software AG in April 2024.
- TPG bought Proficy from GE Vernova for $600 million on 2 March 2026 and merged it with Kepware & ThingWorx as Velotic.
Each change can bring new contract paper at renewal for industrial analytics solutions already in place. Read the assignment clause before signing a multi-year term.
Industrial data analytics by industry
Process industries and the discrete manufacturing industry use industrial analytics differently. Process plants run continuous industrial processes where a few hundred tags describe one unit, and the questions are about yield, energy and quality control. Discrete manufacturing facilities count parts, so the questions are about cycle time, scrap and OEE across manufacturing processes.
- Oil & gas and chemicals: predictive maintenance on rotating equipment and yield on production processes. TrendMiner counts 48% of the top 50 chemical makers as users; AVEVA says 75% of the world's crude oil, natural gas and liquids are produced with PI.
- Pharma and life sciences: batch quality control and GMP investigations. All 25 of the top 25 pharma companies use PI, and Seeq sells a separate Seeq for Pharma product.
- Power and utilities: asset performance and outage planning. More than 1,000 power utilities run PI, and Dominion Energy built a forecasting framework for outage planning on Seeq.
- Discrete manufacturing: OEE and energy in manufacturing operations. Vorwerk's 500 machines and Bharat Forge's 15%+ OEE gain are the published cases.
- Food and beverage: quality and consistency. Seeq's 75% cut in taste complaints is the published case.
Seeq lists seven industries on its homepage and TrendMiner says it serves 28 industry segments. Industrial automation vendors such as Siemens and Inductive Automation reach further into discrete plants, where the control systems and the industrial analytics solutions often come from the same supplier. The same methods reach outside manufacturing: Clarify, a Trondheim time-series vendor, lists agriculture, aquaculture and maritime among its industries.
Industrial data analytics FAQ
What software do factories use for industrial data?
Most factories run a historian (AVEVA PI, Canary, Proficy Historian or the Ignition historian), a SCADA or HMI layer, an MES and an ERP. An Industry 4.0 plant adds industrial analytics solutions such as Seeq, TrendMiner and Insights Hub on top of those systems.
What are the four types of analytics?
Descriptive (what happened), diagnostic (why it happened), predictive (what will happen) and prescriptive (what to do about it). Industrial analytics tools cover different steps; CSense is the only one here that documents closed-loop prescriptive control.
What are some industrial examples of big data?
Industrial big data examples include the data generated by Vorwerk's 500 machines, 7,500 data points polled every 15 seconds, years of vibration history on a refinery's rotating equipment, and Canary's 100,000+ tag systems. Each of those is industrial big data that general BI tools weren't built to query.
Is AI replacing data analysts in industry?
The jury's still out, and the vendors' own products point to no for now. Seeq markets Seeq Intelligence as AI that adds context for subject matter experts, and TrendMiner's Analytics Agent works on searches engineers build. Data scientists and data analysts still build the models; the tools move routine questions to process engineers.
What are the top 5 industrial analytics tools?
On this ranking: Seeq, AVEVA PI System, Cognite Data Fusion, TrendMiner and Siemens Insights Hub, in that order. For general business analytics software, see the data analysis tools ranking; for machine-learning platforms, see the predictive intelligence software ranking.
Bottom line
Seeq is the pick among industrial analytics solutions for process engineers who already have a historian and want answers without a data project. AVEVA PI System is the historian of record for multi-site operators, and Seeq reads it in place, so buying Seeq keeps PI underneath. Cognite fits a digital transformation program ready to model every asset, document and time series in one place before building AI on it.
TrendMiner is the fastest route to self-service pattern search in chemicals, going by its four-hour time-to-value claim. Siemens Insights Hub suits Siemens-automated discrete plants chasing OEE and energy across manufacturing processes. Proficy CSense is the only tool here that closes the loop to setpoints, and its 30-day trial makes it easy to test.
On a tight budget, Canary at $3,980 a year and Ignition from $1,200 cover descriptive industrial data analytics, and Litmus at $1,500 a month per site standardizes the data layer across many plants. Braincube suits continuous-process plants that want prebuilt apps to optimize operations and can live without a published price.