Data Analysis Tools: The Top 10 Platforms Ranked for 2026
 By Jan Suski. I go deep on every ranking, checking every number against its source and digging up details other coverage misses, a habit from six years of SEO and link building for tech companies. Bylines at Surfer, Brand24, and Senuto. How the scoring works.
A data analyst at a 200-person company and a data engineer at a bank are not shopping for the same thing when they search for data analysis tools, yet most roundups rank both groups against one list. This one splits the difference by price, data ceiling, and who opens the tool each day.
Ten platforms made the cut: three paid BI suites, two free reporting tools, one open-source self-hosted option, one automation-heavy data-prep tool, one no-code data-science workbench, one usage-billed lakehouse, and the spreadsheet every one of the other nine still has to export to. Each entry carries a current, vendor-sourced price.
This page covers business intelligence dashboards, no-code data-science platforms, and the spreadsheet tools that data analysts, data engineers, and data scientists reach for first, the same split our market intelligence versus business intelligence guide draws at a category level. It skips pure programming environments like plain Python or R installs, since those are languages. They carry no price tag of their own to rank.
Now, 2026 is the year "AI analytics" stopped being a feature and became the pitch on every one of these ten vendors' homepages. That shift changed who gets ranked where below, and it gets its own section later in the piece.
Quick comparison: 10 data analysis tools at a glance
| Rank | Tool | Entry price | Data / model ceiling | Best fit |
|---|---|---|---|---|
| 1 | Microsoft Power BI | $14/seat/mo (Pro) | 1 GB model, 8 refreshes/day | Teams already running Microsoft 365 |
| 2 | Tableau | $15/seat/mo (Standard) | 10 Cloud sites per tenant (Enterprise) | Dashboard-heavy enterprise reporting |
| 3 | Qlik Sense (Qlik Cloud) | $300/mo for 10 seats (Starter) | 10 GB fixed (Starter) | Associative, code-free data exploration |
| 4 | KNIME Analytics Platform | $0, desktop | No vendor cap, local hardware only | No-code data science and ML pipelines |
| 5 | Alteryx | $250/seat/mo (Starter) | 50 automation runs/mo (Professional) | Heavy, repeatable data-prep automation |
| 6 | Looker Studio | $0 | No published cap | Free reporting on Google data sources |
| 7 | Metabase | $0 (open source) / $100/mo (Starter) | 5 seats included (Starter) | Self-hosted BI with no license fee |
| 8 | Databricks | Usage-based, no seat price | No fixed cap, billed by DBU | Data engineers working at large scale |
| 9 | SAS Visual Analytics | Quote only (£81,025/yr, Small tier) | 25 viewers, 4 developers (Small) | Regulated, statistics-heavy enterprises |
| 10 | Microsoft Excel | $10/seat/mo (M365 Apps for business) | 1,048,576 rows per sheet | Ad hoc analysis by non-technical users |
Prices are each vendor's own published rate as listed in October 2026, or the procurement document cited directly on the SAS entry where no rate card exists. Figures with no published price read "Quote only" or "Usage-based."
The table orders by where each tool sits on the six criteria below. Brand size plays no part. Alteryx outranks Excel on pure analytical depth, and Excel still sells more seats than any other row in this table, because most of its buyers never read a ranking before opening it.
How we evaluated these 10 data analysis tools
Six criteria decide the shortlist, and the ranking below applies them in this order. Each one produces a yes, a no, or a number a buyer could check against the vendor's own page.
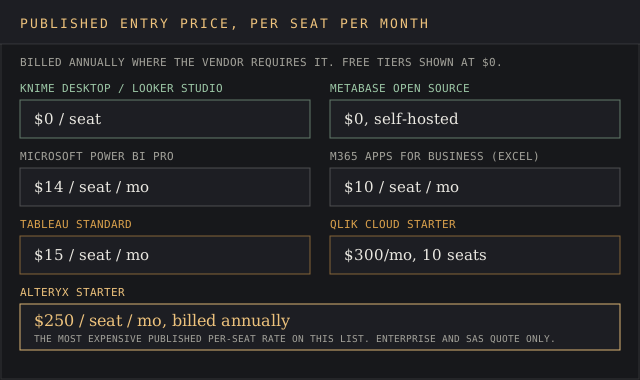
A tool only clears the first test if it publishes a dollar figure for a defined team size. A "starting at" teaser that resolves to "contact sales" doesn't clear it. Seven of the ten rows above carry a real number; Databricks, SAS, and Alteryx's higher tiers do not, and that absence is itself the finding.
Data or model ceiling before the next paid tier
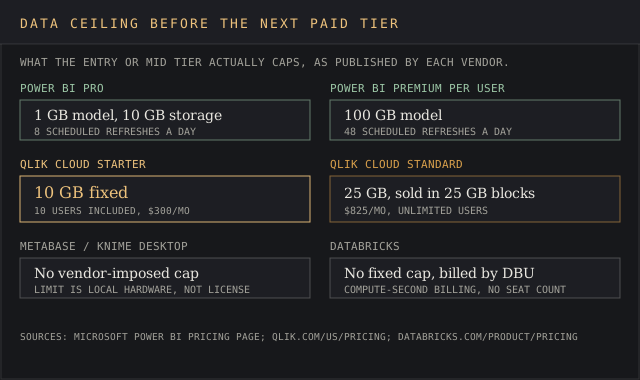
Every BI tool caps something at its entry price: model size, storage, or scheduled refreshes. Power BI Pro stops at a 1 GB model and 8 refreshes a day; Qlik's Starter tier stops at a fixed 10 GB. A tool that hides its ceiling behind "contact sales" fails this criterion outright.
No-code depth for non-technical users
Can someone with no SQL and no scripting background build a working chart or pipeline from the tool's own interface, unassisted? KNIME's drag-and-drop canvas and Power BI's Power Query editor pass this test for business users and data teams alike. A tool that requires a modeling language before the first chart renders does not, and that single gap decides which of these ten tools a non-technical hire can touch on day one.
A self-hosted or open-source deployment option
Only three of the ten, KNIME's desktop platform, Metabase's open-source edition, and (loosely) Excel through LibreOffice-compatible files, let a team run the software with zero recurring license fee. The other seven charge a recurring fee every year, and that distinction matters most for a self-service business analytics program with a fixed yearly budget.
Scheduled-refresh cadence for real-time data analysis
How often can data refresh without someone clicking a button? Power BI Premium Per User clears 48 refreshes a day; Databricks and Looker Studio refresh on their own job schedules. Neither publishes a fixed daily count, so the entries below treat that as a separate case.
A published AI feature with a stated usage limit
"AI-powered" is on every one of these ten homepages in 2026. This criterion only credits a feature with a published cap or scope, like KNIME's 20 free AI-assistant interactions a month, over an unquantified marketing claim.
The ranked list
Each entry follows the same shape: who it fits, what it does with a figure attached, key features, pricing, pros and cons, and the line that defends its position against the entries next to it.
Microsoft Power BI
Best fit
Teams already paying for Microsoft 365 who want dashboards without a separate BI budget line.
Power BI Pro costs $14 per user per month, billed yearly, and a free tier exists with no credit card required. The free tier can't share reports outside the organization's own account, the real reason most teams buy Pro within the first month of a trial.
Key features
- Power Query editor for no-code transformation of raw data, with data manipulation handled visually and no script required
- Native connectors across the Microsoft ecosystem: Excel, SharePoint, and the rest of Microsoft 365
- DAX formula language for custom measures and calculated columns
- Fabric integration for teams scaling past per-user licensing
Pricing
Pro runs $14/seat/month; Premium Per User steps up to $24/seat/month for a 100 GB model limit and 48 daily refreshes, against Pro's 1 GB and 8 refreshes. Fabric capacity pricing is usage-based and not published per seat.
A 2026 Hacker News thread shows the other side of that convenience. Commenter grvdrm described a refresh pipeline that silently drifted from its Excel source for months before anyone caught it: "Somehow automated a report. From Excel to Power BI. Then for months Power BI was wrong."
Pros
- Cheapest published per-seat BI price on this list at $14/month
- Deepest native tie-in to tools millions of business users already know
- Power Query handles data cleaning with no code to write
Cons
- Free tier can't publish reports outside the org
- 1 GB model cap on Pro forces an upgrade sooner than Qlik's 10 GB Starter tier
- DAX carries a documented learning curve once formulas go beyond basic sums
Why it's ranked #1. Power BI Pro beats Tableau Standard on price by a dollar a seat per month and ships inside the Microsoft 365 suite millions of teams already pay for, though Tableau's visualization depth still outruns it on complex, mixed-source dashboards.
Tableau
Best fit
Enterprises whose main deliverable is a polished, interactive dashboard shipped to dozens of executives and regional managers who never touch the underlying data.
Tableau Cloud Standard starts at $15 per user per month billed yearly, with Enterprise at $35 and a 10-site cap per tenant; Cloud+ raises that to 50 sites but only by quote.
Key features
- Drag-and-drop canvas for interactive dashboard building, no DAX or LookML required
- VizQL rendering engine tuned for large, mixed-source visualizations
- Tableau Next adds AI-assisted dashboard generation at $40/seat/month
- Server-side compute licensed in 8-core units for on-premises deployments
Pricing
Every Tableau plan requires an annual contract and at least one Creator license; monthly billing isn't offered at all, a sharp contrast with Power BI's month-to-month Pro option.
Price is the recurring complaint. On Hacker News, commenter jherskovic put it bluntly about an earlier per-desktop license, describing a four-figure-per-seat cost that confined dashboard-building to a small team: "For us, what killed it was the pricing."
Pros
- Visualization depth that the other nine tools on this list still measure themselves against
- VizQL handles blended, multi-source datasets with no manual joins in most cases
- Mature partner and training network built over two decades
Cons
- No monthly billing option on any tier
- Enterprise caps at 10 Cloud sites before Cloud+ pricing kicks in by quote only
- Per-seat cost still runs a dollar above Power BI Pro at the entry tier
Why it's ranked #2. Tableau's visualization depth beats Qlik's associative model on raw chart complexity, but it loses the top spot to Power BI on the one number a buyer can check without a sales call: $15 a seat against $14.
Qlik Sense (Qlik Cloud)
Best fit
Analysts who want to click through relationships in the data without writing a join or a formula first.
Qlik Cloud's Starter plan runs $300 a month for 10 users and a fixed 10 GB of analysis data; Standard jumps to $825 a month for 25 GB and removes the per-user cap entirely, so a team that outgrows 10 seats pays nothing extra for headcount.
Key features
- Associative engine that surfaces related records across tables with no manual join
- Hybrid cloud deployment, running analytics against on-premises and cloud data together
- Built-in predictive analytics and machine learning from the Premium tier up
- Public-facing embedded analytics on Premium and above
Pricing
Starter's $300/month covers 10 seats at $30 each; Standard's $825/month covers unlimited seats inside its 25 GB cap, flipping the usual per-seat math the other nine tools use.
A long-time BI developer, posting as peschu on Hacker News, described building end to end with no code touched at any point: "Going from raw data to a finished dashboard is a matter of days."
Pros
- Associative model surfaces connections a SQL join would miss without being asked to
- Unlimited users from the Standard tier up, a contrast with every seat-metered tool above it
- Hybrid deployment suits regulated data that can't fully leave on-premises systems
Cons
- Starter's 10 GB cap is fixed, with no partial top-up below the 25 GB Standard jump
- Premium's predictive features add $2,750/month over Starter's $300
- Enterprise tier publishes no price at all, only "Get a Quote"
Why it's ranked #3. Qlik's associative engine does something Power BI and Tableau don't: it surfaces related rows with no formula. It trails both on price transparency once a team needs more than the fixed 10 GB Starter cap.
KNIME Analytics Platform
Best fit
Analysts who want a visual, no-code canvas for machine-learning pipelines with no Python environment to maintain.
KNIME's desktop Analytics Platform is free for unlimited local runs on a single machine; the commercial KNIME Business Hub, for team deployment and scheduling, is priced on request across Basic, Standard, and Enterprise tiers with 4, 8, and 16 included vCores.
Key features
- Drag-and-drop visual workflow canvas, no scripting required for most pipelines
- Native nodes for statistical modeling, data transformation, and automated machine learning
- K-AI assistant included free, capped at 20 interactions a month on a personal account
- Open-source core under a published license, auditable by any team that wants to
Pricing
The desktop platform costs nothing; Business Hub's three commercial tiers (Basic, Standard, Enterprise) scale from 5 to 20 included users but publish no dollar figure, a contrast with KNIME's own smaller Hub collaboration plans at $19 and $99 a month.
Hacker News commenter m3047 uses it for exactly the workload it's built for, the kind of occasional, visual workflow a Python script would otherwise demand constant upkeep to maintain: "I'm a fan of KNIME" for those "Sunday Driver" pipelines run heavily for a week and then shelved for months.
Pros
- Zero cost for unlimited local use, a dime a dozen among BI tools but rare for ML workflow builders
- Automated machine learning nodes with no model code to write
- Open-source license means no vendor can revoke access retroactively
Cons
- Business Hub pricing is quote-only across all three commercial tiers
- Command-line automation is being phased out starting with version 5.6, per a vendor release note flagged by Hacker News user nijuashi
- Free K-AI assistant caps at 20 interactions a month
Why it's ranked #4. KNIME beats Qlik on price, a flat $0 against Qlik's $300 Starter floor, because it owns the no-code, open-source corner of the category outright. It loses ground to Qlik's associative model on how fast a non-technical business user reaches a finished chart.
Alteryx
Best fit
Data teams running the same data-prep workflow weekly or monthly who need it automated. Rebuilding it by hand each time is the cost Alteryx removes.
Alteryx Starter publishes a rate of $250 per user per month billed annually, the single most expensive published per-seat price on this list; Professional and Enterprise are both quote-only, with Professional including 50 automation runs a month and Enterprise including 15,000.
Key features
- Drag-and-drop workflow designer for repeatable data-prep automation
- Agent Studio for orchestrating multi-step automation pipelines
- Free viewer licenses included on the Enterprise tier only
- 30-day free trial across all published tiers
Pricing
Starter's $250/seat/month covers a single cloud-only entry point; moving to Professional or Enterprise requires a sales call, with Enterprise adding private data handling and governance controls Starter lacks entirely.
The cost shows up directly in community feedback. Data engineer edwardeechoud, introducing a browser-based alternative on Hacker News, credited Alteryx with solving a real problem while flagging its price and vendor lock-in: "Alteryx solved the visibility problem," roughly $5,000 a year for one seat and a proprietary workflow format that doesn't travel.
Pros
- Automation depth for recurring data-prep jobs beats a one-off script someone has to remember to rerun
- Agent Studio orchestrates multi-step pipelines with no separate scheduling software
- 30-day trial available on every published tier
Cons
- $250/seat/month Starter rate is the priciest flat figure on this entire list
- Proprietary workflow format creates real switching cost if a team leaves
- Professional and Enterprise both hide their price behind a sales call
Why it's ranked #5. Alteryx automates recurring data-prep work that KNIME's free canvas handles only by hand, but it loses ground on price: $250 a month against KNIME's $0, for a workflow problem KNIME's desktop tier can often solve at no cost.
Looker Studio
Best fit
Small teams and solo analysts who need a free, shareable report on Google Analytics, Sheets, or BigQuery data, and nothing more.
Looker Studio, formerly Google Data Studio, remains free with no published paid tier on Google's own product page; Looker, the separate enterprise semantic-modeling product under the same Google Cloud umbrella, uses LookML and prices by quote, with no published seat rate.
Key features
- Native connectors into Google Analytics, Google Sheets, and BigQuery at no cost
- Shareable, web-based reports with no install required on the viewer's side
- Looker, the enterprise sibling product, adds LookML modeling for governed, reusable metrics
- No seat limit published on the free report-building tier
Pricing
The free tier carries no published cap on users or reports; the enterprise Looker product's LookML licensing is quote-only, so a team scaling past basic reporting faces an unpublished jump in cost.
Reception on Hacker News leans toward good enough. Few call it great. Commenter gdilla summed up the sentiment in three words responding to a competitor's reporting pain, treating it as the baseline a team falls back on: "oof, at least use looker studio."
Pros
- Genuinely free with no credit card and no published seat cap
- Direct native pull from Google Analytics and BigQuery with no separate connector fee
- No install needed for anyone just viewing a shared report
Cons
- LookML modeling lives in the separate, quote-priced Looker product; Studio itself carries none of it
- Community sentiment treats it as a fallback few pick first
- No published enterprise support tier if something breaks
Why it's ranked #6. Looker Studio's $0 price beats every paid tool ranked above it, but it loses ground on depth: Qlik's associative engine and Power BI's DAX layer both do things Looker Studio's free report canvas was never built to do.
Metabase
Best fit
Engineering-led teams who want self-service BI with no per-seat license to pay for on the open-source core.
Metabase's open-source edition is free, self-hosted, and uncapped on users; the hosted Starter plan runs $100 a month (or $1,080 a year) for 5 included users, and Pro runs $575 a month for 10 included users, each with its own per-extra-seat add-on rate.
Key features
- Free, unlimited-user open-source edition for self-hosted deployment
- SQL-question builder alongside a no-code visual interface, so analysts can work either way
- Row- and column-level permissions from the Pro tier up
- Interactive dashboards with white-labeling and multi-tenant embedding on Pro and Enterprise
Pricing
Starter adds $6/user/month past its first 5 seats; Pro adds $12/user/month past its first 10; Enterprise starts at $20,000 a year with per-user pricing unpublished.
Running it well takes real operational care. Hacker News commenter jsiepkes raised that directly after a data breach traced to an exposed instance: "Why not require the use of a VPN like a Wireguard based solution or Nebula for these 'internal' kind of apps?"
Pros
- Genuinely free, unlimited-user open-source tier with no artificial seat cap
- SQL builder suits teams with engineers comfortable writing queries directly
- Row- and column-level permissions available without Enterprise's $20,000 floor, once on Pro
Cons
- Self-hosting puts network exposure and patching on the team's own plate
- Enterprise's $20,000/year floor is the single biggest single-step price jump on this list
- Starter and Pro per-seat add-ons stack quickly past their included-user counts
Why it's ranked #7. Metabase's open-source tier undercuts even KNIME on total cost of ownership for a self-hosted BI stack, but it ranks below Looker Studio's effort-free free tier because self-hosting demands security work Looker Studio's hosted model never asks of a team.
Databricks
Best fit
Data engineers running large-scale pipelines who want to pay for compute by the second, with no fixed seat count to negotiate.
Databricks bills entirely on usage: pay-as-you-go draws from a published Price List measured in Databricks Units (DBUs), with Committed Use Contracts offering volume discounts; no flat per-seat or per-tier dollar figure exists to quote.
Key features
- Unified lakehouse combining data warehousing, data engineering, and AI workloads in one platform
- DBU-based billing at per-second granularity, no up-front commitment required
- Committed Use Contracts for predictable volume discounts across multiple clouds
- Azure Databricks billed directly through the Azure subscription itself
Pricing
There is no published flat rate; a team's bill depends on compute type, region, and cloud provider, with the real DBU rate sitting in a separate Price List away from the main pricing page.
That billing model draws real scrutiny. Hacker News commenter dangjc, describing production use, put a number on the markup: "DBUs are about +50% the underlying compute cost."
Pros
- Pay-as-you-go model avoids a fixed seat count entirely for variable workloads
- Combines data engineering, warehousing, and AI model training in one platform
- Committed Use Contracts bring real volume discounts for predictable, large workloads
Cons
- No flat per-seat price published anywhere, a contrast with seven of the other nine entries here
- DBUs carry roughly a 50% premium over raw compute cost, per community estimates
- Azure deployments route billing through a separate Microsoft invoice, so no single Databricks bill covers them
Why it's ranked #8. Databricks out-scales every BI tool above it for raw data-engineering throughput, but it ranks behind Metabase's free tier on this list's price-transparency criterion: a team can't get a dollar figure without running its own workload first.
SAS Visual Analytics
Best fit
Regulated enterprises (insurance, pharma, government) that need audited statistical rigor above a modern interface.
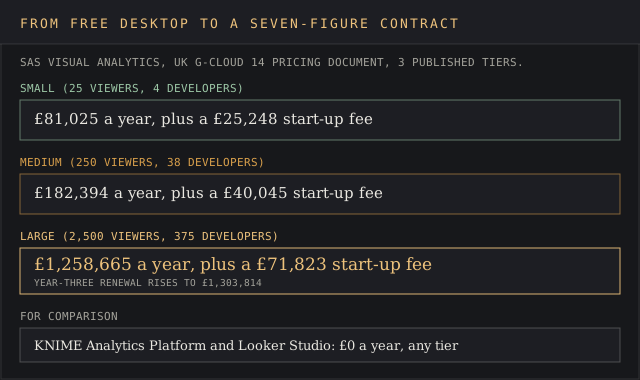
A UK government G-Cloud 14 pricing document lists three published SAS Visual Analytics tiers: Small at £81,025 a year (plus a £25,248 start-up fee) for 25 viewers and 4 developers, Medium at £182,394 a year for 250 viewers and 38 developers, and Large at £1,258,665 a year for 2,500 viewers and 375 developers.
Key features
- Statistical modeling and forecasting depth built for regulated, audited environments
- Viewer and developer licensing split, so read-only staff cost less per seat than builders
- Year-three renewal on the Large tier rises to £1,303,814, per the same document
- Decades of use inside government statistics agencies
Pricing
The Small tier's £81,025 annual fee works out to roughly £2,794 per included user per year; the Large tier's £1,258,665 works out to roughly £438 per user, so SAS gets cheaper per seat only at a scale few buyers on this list will reach.
That price tag is the recurring theme wherever SAS comes up. Hacker News commenter Saline9515, describing a French government deployment, put a figure on it directly, roughly in line with the UK document's own Large-tier number: SAS "required costly licences (more than a million € for a few dozens of workers)."
Pros
- Statistical depth and audit trail built for regulated industries from the ground up, unlike a BI tool with compliance retrofitted on
- Viewer/developer license split lowers cost for read-only staff specifically
- Long government and pharma deployment history with established compliance patterns
Cons
- Most expensive tool on this list at any published tier
- Per-user cost only improves at a scale (hundreds of developers) few buyers reach
- No self-service tier exists below a six-figure annual commitment
Why it's ranked #9. SAS beats every tool above it on one thing alone, documented statistical rigor for regulated audits, but an £81,025 annual floor for just 25 viewers puts it out of reach for the non-technical business users Excel serves free.
Microsoft Excel
Best fit
The non-technical business user doing a one-off analysis who doesn't need a dashboard, a data model, or a monthly BI bill.
Desktop Excel ships inside Microsoft 365 Apps for Business at $10 per user per month, or inside pricier bundles like Business Standard at $23.50/month; the cheapest M365 tier, Business Basic at $7/month, drops desktop Excel entirely and offers only the web and mobile versions.
Key features
- Pivot tables for fast aggregation with no query to write
- Native Power Query and Power Pivot for lightweight data modeling inside the same file
- 1,048,576 rows per sheet, a hard structural ceiling every other tool on this list avoids
- Works offline, with no server dependency for a single analyst's own file
Pricing
Desktop Excel requires at minimum the $10/month Apps for Business tier; the $7/month Business Basic tier looks cheaper on paper but excludes the desktop application entirely, a distinction easy to miss at checkout.
The case for keeping it is simple and well-worn. Hacker News commenter golergka made the strongest version of it, arguing that for the scale of analysis most businesses run, nothing on this list beats a spreadsheet already open on every laptop in the building: "Excel is miles ahead not only of any competing software."
Pros
- Already licensed for most office staff through an existing Microsoft 365 plan
- Pivot tables and Power Query cover real analytical ground with zero new tool to learn
- Works fully offline, a contrast with every cloud-hosted tool ranked above it
Cons
- 1,048,576-row ceiling per sheet, a hard limit none of the other nine tools impose
- No native version control; a bad formula can silently corrupt months of work
- Cheapest M365 tier strips out desktop Excel entirely, web-only
Why it's ranked #10. Excel loses to every BI tool above it on scale and automation, capped hard at just over a million rows a sheet. It wins the category nobody else on this list competes for: an analysis a non-technical user can finish before lunch, with no new login.
Where these ten prices come from, and which ones are estimates
Seven of the ten entry prices are pulled directly from each vendor's own current pricing page: Power BI, Tableau, Qlik Cloud, Alteryx, Metabase, and the M365 tiers behind Excel.
SAS Visual Analytics is the one exception with a published figure: those three tiers come from a UK government G-Cloud 14 procurement document. SAS itself publishes no public rate card. Databricks and KNIME's Business Hub publish no price at all; both are marked "quote only" or "usage-based," with no invented number in their place.
Every Hacker News quote is attributed to the commenter's own public username, with the thread's subject matched to the tool being quoted. None of the pricing figures above come from a third-party blog restating another site's number.
What data analysis tools do for data analysts and data scientists
A data analysis tool takes raw data from a spreadsheet, a database, or an API and turns it into a chart, a model, or a number someone can act on. Data analysts live mostly in the BI layer, Power BI, Tableau, Qlik, building dashboards other people read. Data scientists lean toward KNIME, Databricks, or a plain Python notebook, building models. A static chart is not what they are measuring.
Data engineers sit a layer below both groups, and Databricks is built squarely for that audience: moving and transforming data at a scale where a spreadsheet's million-row ceiling stopped being relevant years ago. Jupyter Notebook, free and open source, combines code, text, and visual output in one file and remains the default workbench for that kind of exploratory, code-first analysis outside any of the ten vendors ranked above.
Categories: from spreadsheets to data engineering platforms
Three broad categories cover this list. Self-service BI (Power BI, Tableau, Qlik, Looker Studio, Metabase) targets a business user building a dashboard with no code to write. No-code data science (KNIME) and automation (Alteryx) target a more technical analyst building a repeatable pipeline.
Data engineering platforms (Databricks) and statistical software (SAS) sit furthest from the spreadsheet end, built for teams moving or modeling data at a scale a BI tool's model-size cap can't hold, the same split our market intelligence versus business intelligence guide works through from the other direction.
Excel occupies all three categories at once in practice, which is exactly why it survives every one of the other nine vendors' attempts to replace it outright. Data professionals shopping specifically for data analytics tools usually need at least two rows from this list working together: one to clean and store the data, one to analyze data and present it. A single data visualization tool rarely covers both jobs on its own.
Where Google Analytics fits (and where it doesn't)
Google Analytics is a web-analytics product. It earns no entry on this list because it isn't a general-purpose data analysis tool. It measures traffic and on-site behavior on a single site or app; it has no native path to model a sales pipeline, a manufacturing dataset, or any data that didn't originate from a tracked web property.
Teams that need to analyze Google Analytics data alongside other business data typically export it into Looker Studio or Power BI, both of which carry native connectors built for exactly that handoff.
Machine learning and automation inside today's data analysis tools
Every one of the ten entries above now markets some form of built-in machine learning or AI assistance, a shift AtScale's 2026 research ties partly to how fast adoption has moved: by AtScale's count, over 80% of organizations now use AI in at least one business function, and camelAI's 2026 analysis puts the global AI-analytics market on track toward $68 billion, a scale our AI statistics report tracks across the wider software market.
KNIME ships automated machine learning nodes and a capped AI assistant for free; Qlik's predictive analytics only unlocks on its Premium tier; Power BI and Tableau both lean on their vendors' own foundation models for natural-language query features layered on top of their existing chart engines.
AtScale's 2026 research puts the figure at over 80% of organizations using AI in at least one business function, up from a far smaller share only a few years earlier. None of that adoption changes the data-cleaning work underneath it.
The caution worth keeping: a model trained on the wrong column is still wrong, just faster. None of the AI layering changes the data-cleaning work underneath it, handling duplicates and missing values before any chart or model can be trusted, the same foundational step data analysis has required since long before any of these ten tools existed.
Statistical analysis still does the heavy lifting behind the marketing. Predictive models, the kind Qlik unlocks on its Premium tier and SAS has shipped for decades, rest on the same regression and classification techniques, built by hand or searched out by an automated-machine-learning node in KNIME. Our decision intelligence platforms ranking covers the layer that sits above these ten, turning a model's output into a recommended action.
Machine learning algorithms can search that space faster than a person, but advanced analytics still needs a correctly framed business question before any algorithm, however automated, can answer it usefully. Data security sits alongside all of it: a model trained on customer data that leaks, the way an exposed Metabase instance can, is a bigger risk than a model that is only less accurate.
The operational layer underneath every chart
Before any data visualization renders, the data has to arrive somewhere clean. Data integration pulls records out of a CRM, a billing system, and a web log into one place; data transformation reshapes those raw rows into a consistent format; data quality rules catch duplicates and nulls before a dashboard ever opens. Skip this layer and every downstream chart inherits the mess.
Database management underneath a BI tool usually means one of the standard relational databases, Postgres or SQL Server, feeding a data warehouse built for queries. Transactions stay in the relational layer in front of it; large datasets that outgrow relational databases on a single server typically move to Databricks or a dedicated warehouse next.
Power BI and Tableau both query that warehouse directly; Databricks and Alteryx do more of the transformation work themselves before analysts ever open a dashboard. None of the ten tools above substitute for sound database management upstream; they all assume it. The schemas themselves are designed earlier, in data modeling tools such as ER/Studio and SqlDBM.
Exploratory data analysis, poking at a dataset before committing to a specific chart or model, happens informally inside nearly every tool on this list, but KNIME's visual canvas and a Jupyter notebook both make that exploration visible step by step, something a finished Tableau dashboard, built for presentation, deliberately hides.
Common mistakes when choosing a data analysis tool
Buyers on this list's lower-ranked end typically make one of three mistakes. First, picking Tableau or Qlik for a five-person team that would fit comfortably, and far more cheaply, inside Power BI's free tier or Looker Studio. Second, signing an Alteryx Starter contract at $250/seat/month for a one-time data-cleaning job KNIME's free desktop platform would handle in an afternoon.
Third, and this one shows up constantly, choosing a tool by its demo and skipping the data ceiling that demo conveniently never mentions; every tier on this list has one, and it is always published somewhere on the vendor's own pricing page once you know to look.
Pull the published data or model ceiling from the vendor's own pricing page before the demo call. Waiting until the call rarely works. Every tool on this list states its cap somewhere; a sales rep walking through a demo rarely volunteers it unasked.
Frequently asked questions
What are the top 10 analytics tools?
By this ranking: Power BI, Tableau, Qlik Sense, KNIME Analytics Platform, Alteryx, Looker Studio, Metabase, Databricks, SAS Visual Analytics, and Microsoft Excel, ordered by published price, data ceiling, and no-code depth.
Is Excel a data analytics tool?
Yes. Pivot tables, Power Query, and Power Pivot give Excel real transformation and lightweight modeling capability, capped only by its 1,048,576-row-per-sheet ceiling, the reason it still ranks on this list and doesn't get waved off as just a spreadsheet.
What are the 5 main types of data analysis?
Descriptive (what happened), diagnostic (why it happened), predictive (what will happen), prescriptive (what to do about it), and exploratory (open-ended pattern-finding before a specific question exists). Every tool ranked above supports at least the first three; predictive and prescriptive work concentrates in KNIME, Qlik's Premium tier, and Databricks.
Which of these tools is best for business analytics versus data management?
Power BI, Tableau, and Qlik lead on business analytics, turning cleaned data into a chart a non-specialist can read. Databricks and Metabase's self-hosted edition lean toward data management, keeping the underlying tables organized before any dashboard opens.
What are the top 3 skills for a data analyst?
SQL for pulling and shaping data from a relational database, a BI tool from this list for turning that data into a dashboard, and enough statistics to tell a real trend from noise. Programming languages like Python and R extend all three; none of the three substitutes for the other two.
Bottom line
Microsoft Power BI wins this ranking on the number that moves a buying decision: $14 a seat a month, cheaper than Tableau, and native to a Microsoft 365 subscription most teams already carry.
Teams exploring loosely connected data with no clear schema should look at Qlik's associative engine instead, and anyone building a repeatable machine-learning pipeline with no Python environment to maintain should start with KNIME's free desktop platform before paying for anything on this list at all.
For data engineers moving real volume, nothing on this list substitutes for Databricks, and no amount of per-seat pricing math changes that. For everyone else still opening a spreadsheet first, Excel remains the default for a reason: it's already installed, and for most of the analysis most businesses run, that's still ahead of the curve.