Research Analytical Tools: 10 Statistical and Qualitative Platforms Ranked (2026)
 By Jan Suski. I go deep on every review, checking every number against its source and digging up details other coverage misses, a habit from six years of SEO and link building for tech companies. Bylines at Surfer, Brand24, and Senuto. How the scoring works.
· Prefer this source on Google
Quick comparison of the 10 research analytical tools
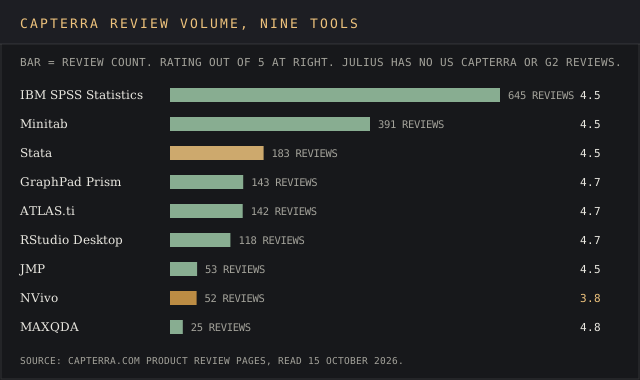
Ratings from each tool’s Capterra review page, read 15 October 2026. Prices are list prices on the vendor’s own site in USD.
| # | Tool | Capterra rating (reviews) | Entry price, published | Best fit |
|---|---|---|---|---|
| 1 | Stata | 4.5 (183) | $1,015/yr Stata/SE business; $94/yr student | Econometrics and reproducible academic research |
| 2 | IBM SPSS Statistics | 4.5 (645) | $99/mo base, per user | Survey data in the social sciences, menu-driven |
| 3 | R with RStudio (Posit) | 4.7 (118) | $0; Posit Cloud from $25/mo | Free, code-first work with the widest method library |
| 4 | JMP | 4.5 (53) | $1,390/yr; JMP Pro $8,820/yr | Engineers and scientists doing visual exploratory data analysis |
| 5 | Minitab | 4.5 (391) | Quote only; Vendr median $8,900/yr* | Six Sigma, process improvement, control charts |
| 6 | GraphPad Prism | 4.7 (143) | $260/yr academic; $520/yr corporate | Lab scientists fitting dose-response curves |
| 7 | MAXQDA | 4.8 (25) | From $633/yr business; $278/yr academic | Mixed methods with built-in statistics |
| 8 | ATLAS.ti | 4.7 (142) | $628/yr commercial seat; $107/yr student | Qualitative coding with AI assistance |
| 9 | NVivo | 3.8 (52) | Annual subscription priced by region | Institutional qualitative teams |
| 10 | Julius AI | No G2 reviews yet | Free tier; Plus $20/mo | Fast AI chat analysis of a spreadsheet |
The Minitab figure marked * is a median annual contract from Vendr’s anonymized buyer-reported data, since Minitab publishes no list price. Every other price is the vendor’s own published figure.
Where these figures come from
Ratings and review counts are each tool’s Capterra figure, read on 15 October 2026, and Julius AI’s row reports its G2 page. Prices come from each vendor’s own pricing page or online store, read in October 2026, and the one median marked * is Vendr’s anonymized buyer data. Neither Minitab nor NVivo publishes a US list price, so neither row claims one.
Julius AI also ranks on our predictive intelligence software ranking, scored there against Databricks, DataRobot and Dataiku.
Research analytical tools turn raw data from a survey, an experiment or a stack of interview transcripts into numbers and coded themes a researcher can defend in front of a reviewer. The category splits two ways. Statistical analysis tools such as Stata, SPSS and R run regression analysis, hypothesis testing and descriptive statistics on numeric data sets. Qualitative research packages such as MAXQDA, ATLAS.ti and NVivo code text, audio and video.
This page ranks ten statistical tools and qualitative packages on five tests a buyer can run in an afternoon: the published price of a full licence, the statistical methods inside the entry tier, a rerunnable script, the documented data ceiling and independent review volume. Every price links to the vendor’s own page, read in October 2026.
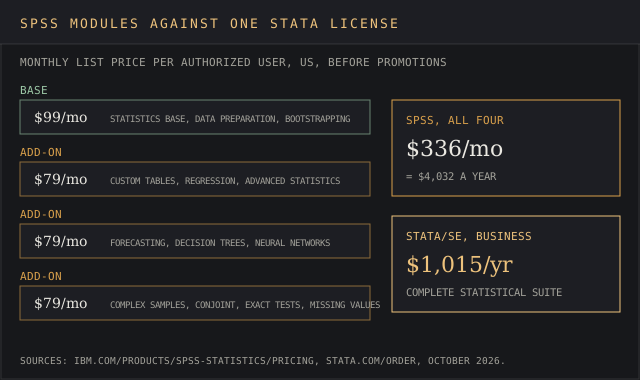
It’s written for academic research groups, market research teams and analysts in quality control who need one primary statistical analysis package and a second set of statistical tools for the gaps. Two facts reshape the buying picture: IBM sells SPSS Statistics as a $99-a-month base plan with three $79 add-ons, and Lumivero, which already owned NVivo, has owned ATLAS.ti since September 2024.
Evaluation criteria for research analytical tools
Five criteria decide the shortlist, and the ranking below applies them in this order. Each one returns a yes, a no or a number, and the same five tests apply to statistical tools and qualitative research tools.
Published price for the full procedure set
What does one commercial seat cost for a year with every statistical procedure the vendor sells switched on? Stata answers on its order page. IBM answers too, but the answer is four line items. Minitab and NVivo don’t publish a US list price, so a buyer starts from a sales call, and that costs them points here.
Statistical methods inside the entry licence
Statistical analysis lives or dies on method coverage. Count how many of five named statistical methods the cheapest paid tier documents: regression analysis, analysis of variance (ANOVA), factor analysis, cluster analysis and survival analysis. For the qualitative tools the test is coding plus any built-in statistical tests, since mixed-methods projects need both.
A scripted, rerunnable analysis record
A do-file, an SPSS syntax file, a JMP script or an R script lets a second analyst rerun the analysis on new data and get the same output. Journals that ask for replication files test exactly this, so it’s a yes or a no.
Documented data ceiling
The vendor should state its limits in rows, variables, columns or RAM. Stata/MP lists 120,000 variables. Prism lists 2,048 columns per table. Posit Cloud’s free plan lists 1 GB of RAM. Statistical tools that never state a ceiling make a big data project a long shot.
Independent review volume
Capterra review count and rating, read the same day for every tool. 645 reviews at 4.5 tells a buyer more than 25 reviews at 4.8, and the count settles ties between statistical tools that pass the first four tests.
The 10 best research analytical tools, ranked
Stata
Best fit
Economists, epidemiologists and social scientists who publish replication files and want one licence that covers every statistical procedure.
StataCorp sells Stata in three editions, and every one carries the complete statistical suite, publication-quality graphics and the do-file language. The business price for Stata/SE is $1,015 a year, with Stata/MP 2-core at $1,195 and 4-core at $1,315.
Stata’s own benchmark runs a logistic regression on 10 million observations and 20 covariates in 20 seconds on SE and 5.2 seconds on MP 4-core.
The ceilings are published on Stata’s edition comparison: Stata/BE handles 2,048 variables and 798 independent variables, Stata/SE 32,767 variables and Stata/MP 120,000 variables across up to 20 billion observations. The devil’s in the details there, since a panel data set with 3,000 columns already rules out BE.
Key features
- Do-files and Stata Markdown dynamic documents that rerun the whole research process from raw data to tables
- PyStata, which runs Python code inside a Stata session
- Data management commands that merge, reshape and clean data sets before further analysis
- SEM Builder for structural equation models
- Stata/MP parallel processing on up to 64 cores
- StataNow continuous-release updates in the current Stata 19
Pricing
Business single-user annual licences at $1,015 (SE), $1,195 (MP2) and $1,315 (MP4). Students pay $94 a year for Stata/BE or $298 for a perpetual BE licence, and $179 a year for SE.
Pros
- One price covers every procedure, with no module stack
- Published variable and observation ceilings for each edition
- Benchmarked speed: 10 million observations in 20 seconds on SE
Cons
- Default graphics need extra code to reach journal style
- Command-driven, so non-programmers face a learning curve
- No free tier outside the trial
The productivity case shows up in reviews. One Capterra reviewer, an executive director in non-profit management, wrote in January 2021 that “Switching to Stata however cut down our manual processes drastically; reducing task times by up to 80%.” The sharpest con is just as specific: a government analyst wrote on Capterra in June 2018 that “The data visualization tools are mediocre.”
Why it’s ranked #1. Stata/SE costs $1,015 a year with every procedure included, against $4,032 for SPSS base plus its three add-ons, so it wins the first criterion outright. R costs nothing but fails the menu test SPSS passes.
IBM SPSS Statistics
Best fit
Psychology, health and market research teams who analyze survey data from their own surveys through menus and want syntax only when they need it.
The point of SPSS is an intuitive interface: every statistical procedure sits in a menu with a paste-to-syntax button.
It’s the most-reviewed of the statistical tools on this list, with 645 Capterra reviews at 4.5. IBM’s pricing page lists the base subscription at $99 per authorized user per month, covering statistics base, data preparation and bootstrapping, with bivariate, factor and cluster analysis named in the base plan’s description. The current release is version 32, and its AI Output Assistant, built on watsonx.ai, translates output tables into plain-language summaries.
The lion’s share of the price sits in three add-ons at $79 a month each: custom tables and advanced statistics (GLMs, mixed models, 2SLS regression), forecasting and decision trees (ARIMA time series forecasting, neural networks, RFM analysis), and complex sampling and testing (conjoint, exact tests, missing values). Each one runs analysis methods market research projects use every week, from time series forecasting to conjoint.
Key features
- Menu-driven statistical procedures with a paste-to-syntax button
- AI Output Assistant powered by watsonx.ai
- Custom tables that export data to Excel or PDF
- Python integration for custom analysis scripts
- Neural networks and decision trees in the forecasting add-on
Pricing
$99 per user per month for base and $79 per add-on, so the full set is $336 a month, or $4,032 a year. IBM says the listed prices are monthly and vary by country, and buying an add-on on ibm.com earns 30% off quarterly or 45% off annual subscriptions.
Pros
- Point-and-click descriptive statistics, t-tests and chi-square tests for business users
- Largest review base on this list, 645 on Capterra and 936 on G2
- Syntax files give a rerunnable record
Cons
- Regression add-ons push the full price past $4,000 a year
- Output tables need reformatting for academic journals
- Operations research methods sit outside the package
Speed with correlation output is the most cited pro. A research project manager wrote on Capterra in January 2025:
“In 5 minutes you can have a lovely table in front of you that shows all the variables and their p value in the study.”
Capterra reviewer, research project manager, January 2025
The recurring complaint is age and cost; a student in hospital and health care wrote in December 2025 that “It can be a bit outdated compared to other softwares, and I don’t believe that it is free to have.”
Why it’s ranked #2. SPSS carries 645 Capterra reviews, more than three times Stata’s 183, and its menus beat R for non-programmers. Its full module set costs $4,032 a year against Stata’s $1,015, which keeps it second.
R with RStudio (Posit)
Best fit
Researchers and data scientists who’ll write code to get every statistical method free.
The R Project describes R as “a free software environment for statistical computing and graphics,” and the current release is R 4.6.1, out on 24 June 2026.
The method library is the selling point: CRAN currently lists 22,976 packages, covering everything from factor analysis to Bayesian complex models.
Posit’s RStudio Desktop is the free editor most researchers pair with it, and analysts who already write Python hit the ground running because one RStudio project runs both languages.
For browser access, Posit Cloud gives a free plan with 25 compute hours a month and 1 GB of RAM, a Basic plan at $25 a month with 150 hours and 8 GB, and a Standard plan at $75 with 500 hours and 32 GB. Teams that self-host get Posit Workbench on quote, and Vendr’s buyer data puts the median Posit contract at $10,900 a year, with a $5,779 to $78,048 range.
Key features
- 22,976 CRAN packages, including ggplot2 for data visualization
- R Markdown and Quarto documents that rerun analysis from code
- Python and R in one RStudio project
- Shiny for interactive dashboards on top of statistical models
Pricing
R and RStudio Desktop cost $0. Posit Cloud runs $0, $25 or $75 a month; extra compute is 10 cents an hour.
Pros
- $0 licence with no seat count
- Widest method coverage, so new statistical methods land in R first
- Scripts are the analysis record by design
Cons
- No menu interface for statistical tests
- Every new user builds a package stack from scratch
- The free cloud plan stops at 1 GB of RAM
Price is what pulls people over. A research assistant wrote on Capterra in September 2020 that “Competitors such as SPSS/IBM are expensive for one year licenses.” A statistician added in October 2022 that “There is a learning curve at first.”
Why it’s ranked #3. R costs $0 against JMP’s $1,390 and has 22,976 packages, so it beats JMP on price and statistical methods. It loses to SPSS because it has no menu path for the 645-review crowd who won’t code.
JMP
Best fit
Engineers and life scientists who explore data visually, run designed experiments and want scripting on the side.
JMP Statistical Discovery sells JMP through its online store at $1,390 per user per year, with JMP Pro and JMP Clinical at $8,820. For a solo researcher, JMP Pro costs an arm and a leg at 6.3 times the base price. It adds predictive modeling and machine learning, which is where buyers build predictive models with validation columns.
The store states that a cancellation stops the automatic renewal and that “Cancellations do not result in partial refunds.”
Students and academic researchers get JMP Student Edition free, renewed every 12 months while they stay eligible. That gives JMP a $0 academic route that doesn’t expire after a trial window.
Key features
- Graph Builder for drag-and-drop exploratory data analysis
- Design of experiments with custom designs
- JSL scripting to automate repeated analyses
- Regression analysis and ANOVA through point-and-click menus
- Machine learning and predictive modeling in JMP Pro
Pricing
JMP $1,390 a year per user, JMP Pro $8,820, JMP Clinical $8,820, all annual subscriptions bought online.
Pros
- Visual interface plus JSL scripts in one product
- Free Student Edition for degree-granting institutions
- Published price with no sales call
Cons
- JMP Pro costs 6.3 times the base product
- No partial refunds on cancellation
- Fewer published reviews, 53 on Capterra
Head-to-head reports favour it over Minitab. A Capterra reviewer wrote in October 2019:
“I use it side-by-side with Minitab 19 and I’ve found JMP to be far better on some data analysis methods because it does not need external micros installed like Minitab 19 does.”
Capterra reviewer, October 2019
An assistant professor countered in May 2018 that “JMP is kind of slow with catching up with the latest statistical tools.”
Why it’s ranked #4. JMP publishes a $1,390 price where Minitab sends buyers to a quote form, so it beats Minitab on criterion one. It loses to R, which is $0 and carries 22,976 packages.
Minitab
Best fit
Manufacturing and quality teams who monitor production quality with control charts and run Six Sigma projects.
Minitab’s product page lists variable, attribute, multivariate, time-weighted and rare-event control charts, the Capability Sixpack, and screening, factorial, response surface, mixture and Taguchi designs. A Predictive Analytics module adds CART, TreeNet and Random Forests. The page cites a candy maker that cut overfill and saved $1.2M with a consultancy using Minitab, a textbook process improvement case.
Control charts are par for the course in Six Sigma work, and Minitab ships five families of them. Minitab doesn’t publish a price; its pricing page is a contact form. Vendr’s anonymised buyer data puts the median Minitab contract at $8,900 a year, with a low of $6,987 and a high of $9,546.
That’s a multi-seat contract figure, so it isn’t a per-seat number.
Key features
- Control charts in five families for quality control
- Capability Sixpack for process capability
- DOE including Taguchi and mixture designs
- Minitab Assistant for guided test selection
- Predictive Analytics module with CART and Random Forests
Pricing
Quote only. Vendr median $8,900 per year, range $6,987 to $9,546.
Pros
- 391 Capterra reviews at 4.5, second only to SPSS
- DOE covers Taguchi and mixture designs
- Assistant explains test choice to business users
Cons
- No published list price
- Shared licences were withdrawn
- Vendr contracts run $6,987 to $9,546
Licensing is the sore point in recent reviews. An engineer wrote on Capterra in March 2025, “Before they used to allow shared license. But they have stopped doing this.” A mechanical engineer in research weighed it up in August 2026:
“Despite the steep annual licensing costs, its ability to automate complex mathematical calculations with a single click makes it an indispensable asset for mechanical engineering and testing.”
Capterra reviewer, mechanical engineer, August 2026
Why it’s ranked #5. Minitab’s 391 Capterra reviews and five control chart families beat Prism’s 143 reviews for industrial work. It loses to JMP, which publishes $1,390 where Minitab’s Vendr median is $8,900.
GraphPad Prism
Best fit
Biology and pharmacology labs that fit curves, run t-tests and ANOVA, and need the figure ready for academic journals.
Prism pairs statistical analysis with graphing. Its features page lists 105 built-in nonlinear regression equations, eight kinds of data table, and tables of up to 2,048 columns with 512 sub-columns each, plus survival analysis with Kaplan-Meier and Cox regression. Users can create charts from the same table that holds the analysis, so a new data point redraws the figure.
In a nutshell, Prism is a graphing program with the statistics a bench scientist needs attached. The GraphPad price list is the most granular here: $142 a year for students, $260 academic, $520 corporate, $50 a month for short projects, and perpetual Prism 11 licences at $1,600 academic and $3,200 corporate. The free trial runs 30 days.
Key features
- 105 built-in nonlinear regression equations
- Kaplan-Meier and Cox survival analysis, with time to event as the dependent variable
- Principal component analysis and logistic regression
- Publication-ready graphs linked to the data table
Pricing
$142 student, $260 academic and $520 corporate per year; group licences from $520 a year for 2 academic seats.
Pros
- Graphs and statistics live in one file
- Monthly $50 licence for short projects
- 4.7 on 143 Capterra reviews
Cons
- Data table layout trips up new users
- 2,048-column ceiling
- No factor analysis or cluster analysis listed
The use case is narrow and loved. A PhD student in biotechnology wrote on Capterra in August 2022, “I have used GraphPad to calculate IC50, EC50 in fluorescence-based assays for my scientific project.” A research associate added in November 2024 that “It can initially be difficult to understand how to input data correctly.”
Why it’s ranked #6. Prism’s 105 nonlinear equations and $260 academic price beat MAXQDA on quantitative depth. It loses to Minitab on review volume, 143 against 391, and on process tools.
MAXQDA
Best fit
Mixed-methods researchers who code interviews and want descriptive statistics and ANOVA without exporting to SPSS.
VERBI’s MAXQDA is the only qualitative package here with a statistics module built in. MAXQDA Analytics Pro documents frequencies, mean, standard deviation and median, crosstabs, ANOVA, independent-samples t-tests with Shapiro-Wilk testing, cluster analysis, Pearson and Spearman correlations and Cronbach’s alpha, and it reads Excel and SPSS data sets.
MAXQDA’s shop prices business single-user annual subscriptions at $633 and $759 for its two editions and academic single-user subscriptions from $278, according to the MAXQDA pricing page. Transcription is sold separately, at $49 for 5 hours.
Key features
- Stats module with ANOVA, t-tests and cluster analysis
- MAXDictio for quantitative text analysis
- AI Assist add-on, free or Premium
- TeamCloud with 25GB storage and up to 4 team members per licence
Pricing
Business from $633 a year single-user, academic from $278, 3-year and 5-year terms also listed.
Pros
- Qualitative codes and statistical tests in one project file
- 4.8 on Capterra, the highest rating on this list
- Published multi-year pricing
Cons
- Only 25 Capterra reviews
- No factor analysis or regression in Stats
- Transcription costs extra on student packs
Reviewers who’ve used several QDA tools pick it. An education reviewer wrote on Capterra in May 2025, “I have tried most of the QDA software out there. MaxQDA wins.” A PhD student flagged the gap in February 2025: “The exclusion of transcription option. I bought it within a student pack option.”
Why it’s ranked #7. MAXQDA documents ANOVA, t-tests and cluster analysis inside a $633 qualitative licence, which beats ATLAS.ti’s coding-only toolset. It loses to Prism, whose 105 regression equations cover quantitative work MAXQDA’s Stats module doesn’t reach.
ATLAS.ti
Best fit
Qualitative researchers who want AI-assisted coding and a published per-seat price.
ATLAS.ti was founded in 1993, and Lumivero, the developer of NVivo, acquired it on 12 September 2024. ATLAS.ti’s AI coding is the feature reviewers mention most.
The two biggest qualitative research packages now sit under one owner, which is a red flag for anyone counting on competition to hold prices.
The ATLAS.ti shop lists a commercial 1-seat licence at $628 a year and $1,275 for three years, a 5-seat licence at $2,062 a year, and a web-only commercial seat at $54 a month. Student licences are $107 a year or $55 for six months, and a seat is concurrent, so a team can share it.
Key features
- AI coding that proposes codes across documents
- Windows, Mac and web versions on one licence
- Real-time collaboration in ATLAS.ti Web
- Auto-transcription credits, 60 free minutes on student licences
Pricing
Commercial $628 a year per seat, educational $336, government and non-commercial $433, student $107.
Pros
- Concurrent seats can be shared across a team
- 4.7 on 142 Capterra reviews
- Published USD prices for every licence type
Cons
- No built-in statistical tests
- Web version lacks a visible code tree
- Same owner as NVivo since 2024
Switchers from NVivo are blunt. An instructor and researcher wrote on Capterra in October 2025, “It’s much better than the cumbersome Nvivo.” A think-tank research lead noted in October 2023 that “The web version doesn’t offer an easy to see code tree - which is sorely missed.”
Why it’s ranked #8. ATLAS.ti rates 4.7 on 142 Capterra reviews against NVivo’s 3.8 on 52, and it publishes a $628 seat price. It loses to MAXQDA, which adds ANOVA and t-tests that ATLAS.ti doesn’t offer.
NVivo
Best fit
Universities and government evaluators already licensed for NVivo who code large multimedia projects.
Lumivero now sells NVivo AI Cloud alongside NVivo Desktop. The Lumivero shop lists the AI Cloud plan with 1,000 AURA AI credits a month, 200 Paper Search searches a month and 5 hours of transcription a year, and the Collaboration Cloud add-on at $99 a year. Desktop transcription covers 43 languages.
NVivo has the weakest independent score on this list, 3.8 on 52 Capterra reviews, so buyers on the fence between NVivo and ATLAS.ti can read the gap off the ratings: 3.8 against 4.7. The shop shows plan prices in the visitor’s local currency, so a US list price can’t be checked from outside the US.
Key features
- AURA AI assistant with 1,000 credits a month on AI Cloud
- Paper Search, 200 searches a month
- Collaboration Cloud for shared projects
- Coding of text, audio, video and images
Pricing
Annual subscription or one-time licence by region; Collaboration Cloud $99 a year.
Pros
- Handles large multimedia projects
- Desktop transcription in 43 languages
- AI credits bundled with the cloud plan
Cons
- 3.8 Capterra rating, lowest here
- Collaboration Cloud draws the angriest reviews
- No published US price
The team feature is the recurring complaint. An assistant professor wrote on Capterra in October 2025:
“I bought/tried to use NVivo Collaboration Cloud for team-based qualitative analysis and it was a catastrophic experience.”
Capterra reviewer, assistant professor, higher education, October 2025
A research consultant who rated it 5.0 still wrote in March 2018, “I believe AtlasTI or MaxQDA offer better feature sets.”
Why it’s ranked #9. NVivo’s 52 Capterra reviews and 1,000 monthly AI credits beat Julius, which has no G2 reviews at all. It loses to ATLAS.ti, rated 4.7 against NVivo’s 3.8.
Julius AI
Best fit
Analysts who want a chart and a quick test from a spreadsheet by typing a question.
Julius runs analysis through a chat interface: upload a file, ask a question, get code, charts and a written answer. The pricing page lists a free tier, Plus at $20 a month with 2,000 credits, Pro at $45 with 5,000 credits and 32 GB of RAM, and Business at $450 a month for up to 50 team members. SOC 2 Type II compliance, SSO and audit logs sit on the Enterprise plan only.
Julius is a jack of all trades, building charts, presentations and websites from one chat. It’s the fastest way from a CSV to a chart on this list, and the hardest to audit. Julius’s G2 page shows zero reviews, and the method behind an answer lives in generated code a reviewer has to read.
Key features
- Chat-based analysis that writes and runs code
- Snowflake, BigQuery and Postgres connectors on Pro
- Scheduled runs and shared workspaces
- Presentation and website builders for interactive reports
Pricing
Free; Plus $20 a month or $16 billed annually; Pro $45; Business $450; Enterprise on quote.
Pros
- Lowest paid entry price, $16 a month annually
- No statistics syntax to learn
- Database connectors from the $45 tier
Cons
- No documented list of statistical procedures
- SOC 2 Type II only on Enterprise
- No independent review base on G2
Developers on Hacker News describe it as a stronger ChatGPT data mode. One wrote in May 2024, “If you’re looking for a more powerful version of ChatGPT Data Analysis, I recommend https://julius.ai/.” Another, in an August 2024 thread, was cooler: “just upload some data and ask for some charts and it does an ok job.”
Why it’s ranked #10. Julius starts at $16 a month, the cheapest paid entry here, but publishes no procedure list and has 0 G2 reviews. NVivo’s 52 Capterra reviews put it one place higher.
What research analytical tools do
Statistical tools summarize data and test hypotheses, and the math behind a t-test doesn’t change between packages.
Descriptive statistics report measures of central tendency, the mean, median and mode, plus the standard deviation of a continuous variable. Central tendency tells a reader where the sample data cluster; spread tells them how far it ranges.
Regression analysis models how a dependent variable, the outcome, moves with one or more independent variables, and every statistical package on this list reports the coefficient, standard error and p-value for each of those independent variables. A t-test compares the means of two groups, analysis of variance (ANOVA) compares three or more, and a chi-square test checks if two categorical variables are related.
Factor analysis groups correlated survey items into a smaller number of constructs, and cluster analysis groups respondents with similar answers. Those two statistical procedures are why SPSS and Stata dominate survey research: a 40-item questionnaire’s survey data becomes six factors and four segments, and market research teams read consumer preferences off the segments.
Qualitative analysis tools interpret non-numerical information like interviews and open-ended responses. A researcher tags passages with codes, and the software counts, compares and retrieves them. MAXQDA’s Stats module and ATLAS.ti’s code co-occurrence tables are where the two halves meet.
Types of research analytical tools and when each fits
Four groups cover the field, and most research teams own one from the first group and one from another.
- General statistical analysis tools: Stata, SPSS, R and SAS. Full statistical methods from descriptive statistics to predictive modeling.
- Applied and industrial statistics: JMP and Minitab for design of experiments, quality control and control charts; Prism for lab curve fitting.
- Qualitative and mixed methods: MAXQDA, ATLAS.ti and NVivo for coding interviews, focus groups and documents.
- AI and visualization tools: Julius for chat analysis; Tableau for interactive dashboards, ranked on our data analysis tools ranking.
Product analytics tools are a fifth, adjacent group. They use event tracking, funnel analysis to identify drop-off points, and heatmaps to visualize where users interact. Product teams use them to improve product performance and user experience, and they’re covered on the customer analytics tools ranking and the Hotjar review.
Statistical tools versus business analytics tools
Statistical tools and business analytics platforms overlap on charts and split on inference. Statistical tools such as Stata and SPSS estimate a model, report a p-value and let a researcher draw conclusions about a population. Business analytics platforms such as Tableau and Power BI build interactive dashboards and custom reports, so business users can analyze data and identify trends without writing a test.
Tableau’s editions start at $15 per user per month, billed annually.
The line keeps moving, and advanced analytics now sit inside statistical software. SPSS sells advanced analytics such as neural networks in its $79 forecasting add-on, and JMP Pro adds machine learning at $8,820 a year. Data mining on large datasets and complex datasets is its own category, covered on our data mining tools ranking.
A team that needs actionable insights for a weekly meeting gets them from a dashboard, and a team that has to defend a result to a reviewer needs statistical tools.
The five main types of data analysis
Four types of analytics come up in every textbook: descriptive analytics answers what happened using historical data, diagnostic analytics explains why it happened, predictive analytics forecasts future values from historical data, and prescriptive analytics recommends an action.
Inferential statistical analysis is the fifth, and it’s the one research tools and statistical software exist for: the step where researchers draw conclusions about a population from sample data with hypothesis testing.
Exploratory data analysis sits before all five. JMP’s Graph Builder and R’s ggplot2 are built for it: plot first, test second. Researchers who identify patterns in a scatterplot before hypothesis testing catch outliers that would otherwise sink a regression analysis, and a histogram shows if a continuous variable is skewed before the standard deviation gets reported.
Where the data comes from and how collection differs
None of the ten statistical tools above collects data on its own. Researchers collect data in a survey platform, a lab instrument or a field interview, then import it. SPSS reads its own .sav files, Stata reads .dta, all three import Excel workbooks, and MAXQDA reads both Excel and SPSS data sets, which saves a round of data preparation on mixed-methods projects.
Data collection decides which statistical tools a team buys more often than the method does. Teams that collect data in Qualtrics or SurveyMonkey find the survey data lands cleanly in SPSS, which is why the two get bought together. Big data from a lab instrument or a sensor log goes to R or Stata/MP.
Our market research tools ranking covers the collection side and the guide to market research methods covers study design.
Pricing across research analytical tools
Statistical tools range from $0 for R to $8,820 a year for JMP Pro, and the published figures hide three traps.
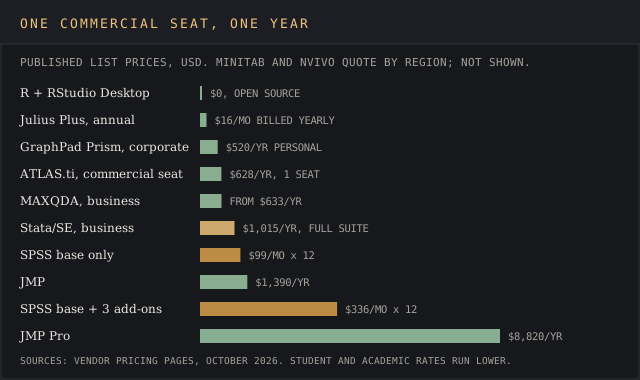
- Modules: SPSS base is $99 a month, but regression add-ons bring a full seat to $336 a month.
- Editions: JMP Pro costs $8,820 against JMP’s $1,390 for machine learning features.
- Renewal terms: JMP gives no partial refunds, and Minitab withdrew shared licences.
Student pricing is where the gap closes. Stata/BE is $94 a year, Prism $142, ATLAS.ti $107, and JMP Student Edition and SAS OnDemand for Academics are free.
Buyers who cut corners by running a student licence on funded commercial work break the licence terms of every vendor here.
Free and open-source research tools and what they can’t do
Free research tools such as R carry 22,976 CRAN packages, and the cost shows up in setup time.
Research tools vary in cost and licence terms, and four routes to free statistical tools exist. R and Python are open source; Python’s pandas and SciPy libraries handle data manipulation and custom data pipelines. SAS OnDemand for Academics is free for learners, with 5GB of cloud storage. JMP Student Edition is free at degree-granting institutions.
Lower-end analytics can run on free tools like R or the free edition of Microsoft SQL Server, but the free routes trade money for time. R and Python have no menus, SAS OnDemand is a teaching environment, and Posit Cloud’s free plan caps at 25 hours a month.
A team of business users without code gets more statistical analysis out of SPSS at $99 a month than R at $0.
Common buying mistakes
The most common mistake is buying for the method and ignoring the reviewer. A journal that wants a replication file wants code, so a team that runs every analysis through menus without saving syntax goes back to square one at revision time.
The second is putting all your eggs in one basket, since researchers who combine various tools cover more ground. Stata or SPSS for statistics plus MAXQDA or ATLAS.ti for coding covers more research methods than any single package. The third is ignoring data privacy and security: Julius keeps SOC 2 Type II, SSO and audit logs for Enterprise customers, so sensitive participant data belongs on a plan that carries them.
How to run an evaluation or trial
Define the research question, then pick the statistical tools to match it. Choosing the right analytical tool depends on research objectives and data types: numeric survey data points to SPSS or Stata, interview transcripts to MAXQDA or ATLAS.ti, process data to Minitab or JMP.
Run the trial by the book, in five steps.
- Pick one finished study with known results and its raw data.
- Rerun it in each trial: Prism and JMP offer trials, and R costs nothing.
- Time the run and check that the output matches the published table.
- Save the script and have a colleague rerun it on new data.
- Document every step; that record is the deliverable when research findings face review.
Researchers must consider their skills when selecting analytical tools, and specific research questions narrow the list fast. A team that can’t code shouldn’t buy R and hope, and a team that already writes Python gets little from Julius.
Stata vs SPSS for academic research
This is the most common head-to-head among statistical tools. Stata costs $1,015 a year for everything; SPSS costs $1,188 a year for base and $4,032 with every add-on. SPSS has 645 Capterra reviews against Stata’s 183, and its menus suit students who run statistical tests a few times a semester.
Among statistical tools, Stata wins in economics, epidemiology and political science, where panel data and replication files are standard. SPSS handles large datasets for advanced statistical modeling too, but the statistical procedures for GLMs and mixed models sit in a $79 add-on.
NVivo vs ATLAS.ti vs MAXQDA
All three now carry AI features, so the split is price, statistical tests and owner. ATLAS.ti publishes $628 a year for a commercial seat. MAXQDA lists $633 and adds the Stats module. NVivo doesn’t publish a US price and rates 3.8 against 4.7 and 4.8. Since 2024 NVivo and ATLAS.ti share an owner, which leaves MAXQDA as the independent choice.
Market context: AI, consolidation and rapid growth
AI and machine learning tools now help researchers analyze relationships and make predictions based on patterns in data. SPSS added its watsonx.ai Output Assistant, NVivo added AURA with 1,000 monthly credits, and MAXQDA sells AI Assist Premium. Julius is the AI-first entrant among statistical tools, with Business at $450 a month.
Automated analysis tools help identify patterns and trends that might not be immediately apparent, but they also hide the steps. The rapid growth of chat analysis makes a scripted record more valuable for anyone who has to defend research findings, since the reviewer still asks what test ran and on which data sets.
Consolidation is the other trend. Lumivero bought ATLAS.ti in September 2024 and sells NVivo, XLSTAT and Citavi. Neighbouring categories cover adjacent buys: data mining tools for SPSS Modeler and SAS, conjoint analysis tools for XLSTAT and Sawtooth, and customer insights platforms for interview research at scale.
Research analytical tools FAQ
What are some common tools used for data analysis?
Common analytical tools include SPSS, R, Python, NVivo and Tableau, plus Excel for basic work. For research, statistical tools like Stata, SPSS and R cover statistical analysis and hypothesis testing, and MAXQDA, ATLAS.ti and NVivo cover qualitative coding.
Is SPSS a data analysis tool?
Yes. IBM SPSS Statistics is a statistical analysis package with a $99-a-month base plan covering descriptive statistics, data preparation, and factor and cluster analysis.
What is quantitative data analysis?
Quantitative data analysis applies statistical methods to numeric data: descriptive statistics to summarize, hypothesis testing to compare groups, and regression to model relationships. It’s how researchers extract meaningful insights from survey data and experiments.
Are there free research analytical tools?
Yes. R, RStudio Desktop and Python are free and open source, SAS OnDemand for Academics is free for learners, and JMP Student Edition is free for eligible students and academic researchers.
Bottom line
Stata is the best research analytical tool for most academic research groups: $1,015 a year buys the whole statistical suite and do-files that rerun it. SPSS is the pick for survey-heavy teams who work through menus, and R is the pick for anyone who codes and wants every method free.
JMP and Minitab belong in engineering and process improvement, Prism in the lab. For qualitative research, MAXQDA wins on mixed methods, ATLAS.ti on published price and rating, and NVivo where an institution already licenses it. Julius is for quick answers that won’t face a reviewer.