Industrial production database rankings: 10 sources for 2026
 By Jan Suski. I go deep on every review, checking every number against its source and digging up details other coverage misses, a habit from six years of SEO and link building for tech companies. Bylines at Surfer, Brand24, and Senuto. How the scoring works.
· Prefer this source on Google
Quick comparison of industrial production data sources
Ten databases with the coverage figure each one publishes, what it costs to start, and the buyer it fits. The table orders tools the same way as the list below; the coverage column is each vendor's own published figure.
| # | Database | Coverage figure | Entry price | Best fit |
|---|---|---|---|---|
| 1 | FRED | 853,000 series from 127 sources; INDPRO back to January 1919 | Free, API key free | Analysts who need U.S. and OECD industrial production with revision history |
| 2 | Federal Reserve G.17 | 297 individual IP series on 2022 NAICS | Free | Industry-level U.S. output and capacity utilization at the source |
| 3 | Eurostat | EU, euro area and member states, 2021=100 | Free | EU industrial output by country and main industrial grouping |
| 4 | Haver Analytics | 290+ databases from 2,500 sources | Quote only | Economists who need a series within minutes of release |
| 5 | Macrobond | 300M+ series, 150M+ point-in-time | Quote only | Backtests on data as first reported |
| 6 | CEIC | 4.2M+ series, 14 industrial sectors | Quote only | Emerging-market and China industrial detail |
| 7 | Trading Economics | 196 countries, 20M indicators | $199 a month | One analyst comparing industrial production by country |
| 8 | Moody's Analytics Data Buffet | 540M+ series, 180+ countries | Quote only | Forecast scenarios out to 30 years |
| 9 | UNIDO IIP | ISIC Rev. 4 at 2-digit level, base 2015 | Free | Cross-country manufacturing by industry |
| 10 | DBnomics | 94 providers behind one API | Free | Developers pulling many agencies' series into Python or R |
Every price in this table is the one the vendor publishes itself. No row uses a Vendr median, so no row carries a * marker: Vendr's marketplace holds no buyer data for any of the four quote-only vendors.
Where these figures come from
Coverage counts are each vendor's own published figure, read in October 2026. The U.S. index values come from the Federal Reserve Board's 18 September 2026 G.17 release and the EU values from Eurostat's 15 October 2026 release. Haver, Macrobond, CEIC and Moody's publish no list price, Macrobond publishes no update speed or country count, and Haver and CEIC publish no API quota, so no row claims one.
This page ranks sources for one indicator family. For broader statistics libraries, the market database ranking covers Statista, Euromonitor and IBISWorld. For terminals and market feeds, see the financial data providers ranking, which covers LSEG (LSEG review) and Bloomberg, whose terminal pricing sits far above anything here.
Moody's Analytics holds an entry on that financial data providers ranking too. That page scores it as a financial data vendor; this one scores its Data Buffet on lag, vintages and price for one series family, and the two orders differ for that reason.
An industrial production database stores the monthly index that tracks real output in factories, mines and power plants, plus the industry detail underneath it. The U.S. headline number comes from the Federal Reserve Board's G.17 release, which put total industrial production at 103.1 percent of its 2017 average in August 2026, unchanged on the month and 1.4 percent above August 2025.
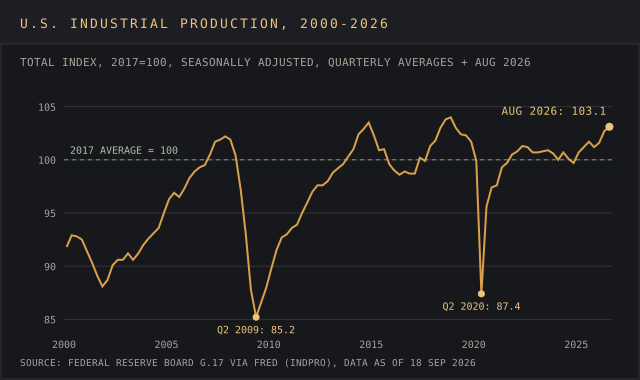
This ranking covers ten databases, five free and five commercial, for analysts who need a monthly read on the economy in a spreadsheet or model. They differ in speed, history, country coverage, how a machine can pull the series, and price, which runs from $0 to private quotes.
The timing matters this year. The Board moves the index's base year from 2017 to 2022 on 24 November 2026, and its Data Download Program loses its package builder the week of 9 November. Both changes send saved queries back to square one.
Two dates in November 2026 touch every saved U.S. pull: the package builder goes the week of 9 November, and the base year moves to 2022 on 24 November. A level stored at 2017=100 stops matching the published series on that second date.
Evaluation criteria for an industrial production database
Five criteria decide the shortlist, and the ranking below applies them in this order. Each one is a test a buyer can run in an afternoon.
Publication lag in days
This measures speed. Count the days between the end of the reference period and the moment the series lands in the database. The Fed published August 2026 data on 18 September, 18 days after month end. Eurostat published its August figures on 15 October, 45 days out.
Revision history you can query
Industrial production gets revised. Ask for the series as it looked on a past date. A database that stores vintages passes; one that overwrites old values fails, because a backtest run on revised data uses numbers nobody had at the time.
Country and industry coverage in named units
Count countries carrying a monthly industrial production index, then count how many industries carry their own series for one country. A named count passes, and the Fed's 297 series for the U.S. is the benchmark on this page. A "global coverage" claim with no number attached fails.
Machine access with a documented limit
Look for an API with a published rate limit or monthly quota, plus bulk download. FRED documents 120 requests a minute; Trading Economics documents 500 requests a month on its Standard plan.
Published price
A list price on the vendor's own page passes. "Request a demo" fails. Four of the ten databases here fail this test outright.
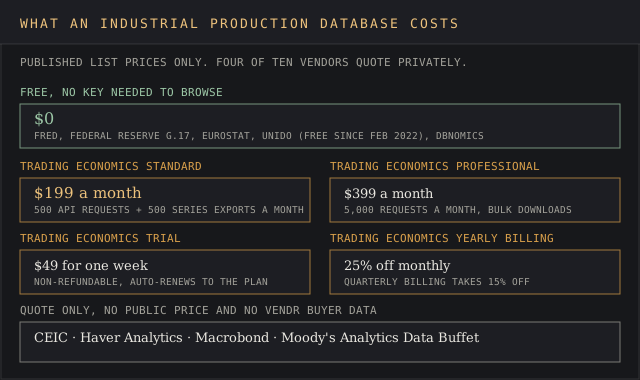
Databases on this page with no public price: Haver Analytics, Macrobond, CEIC and Moody's Analytics Data Buffet. All four route a buyer to a sales conversation.
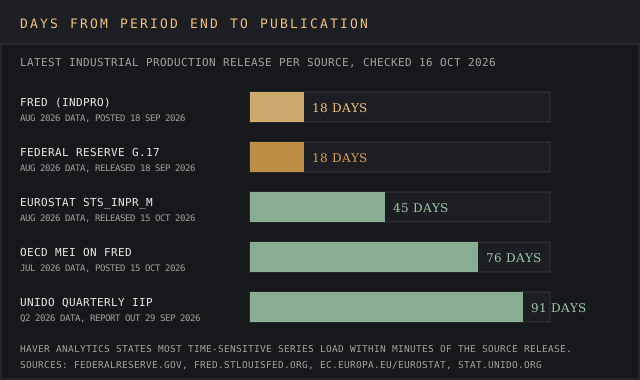
Top industrial production databases, ranked
FRED
Best fit
Analysts who want U.S. industrial production, its sub-indexes and OECD country series in one free API with revision history.
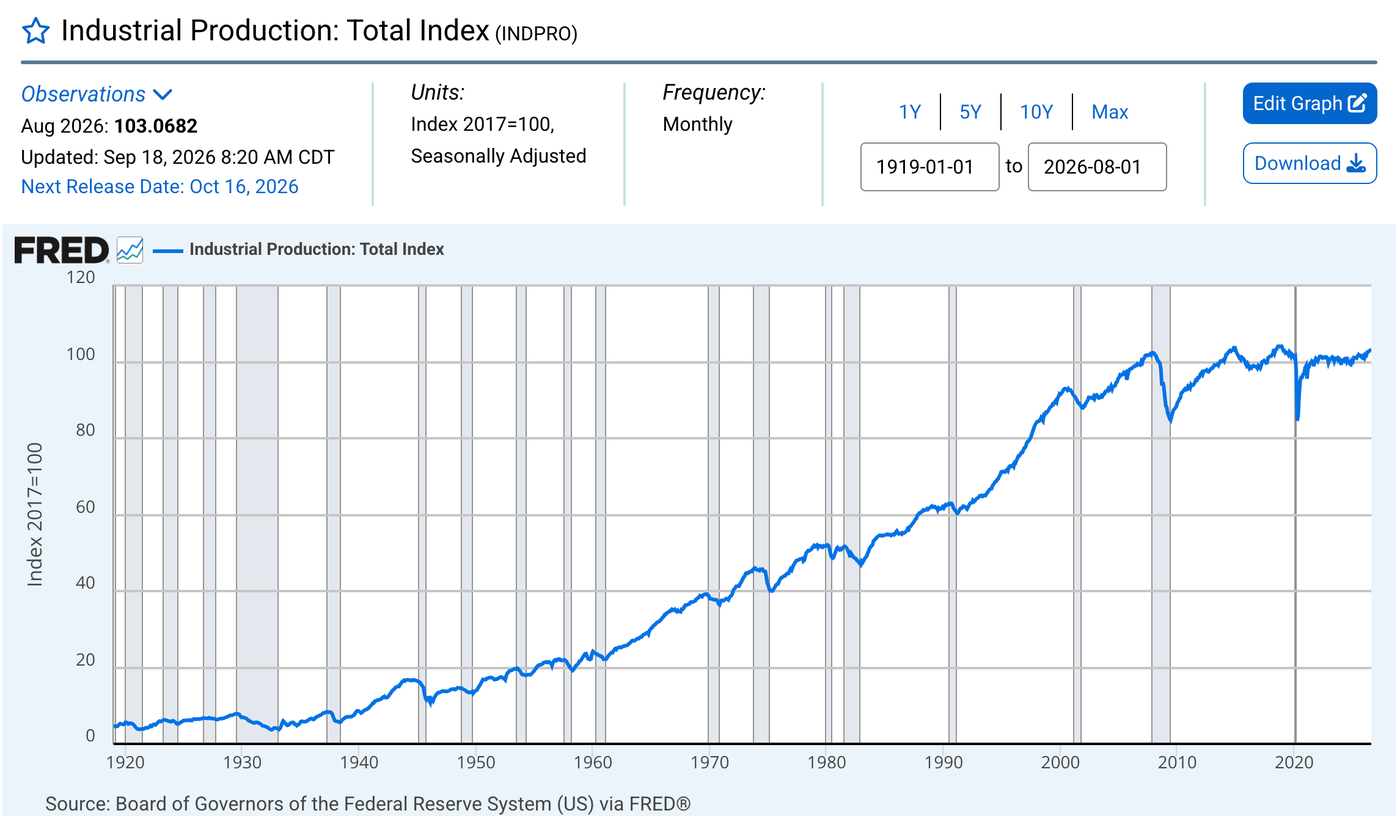
FRED is the database run by the Federal Reserve Bank of St. Louis. It holds 853,000 economic time series from 127 sources, and its total index, INDPRO, runs monthly from January 1919 to August 2026, seasonally adjusted, 2017=100. FRED posted the August value of 103.0682 on 18 September 2026, the day the Board released it.
FRED also carries OECD Main Economic Indicators production series. The OECD total industry growth rate runs from 1976 to July 2026 and was refreshed on 15 October 2026. The Board now points users of its retiring Data Download Program to FRED for expanded download options.
Key features
- INDPRO plus the G.17 market and industry groups, including motor vehicles and durable consumer goods
- ALFRED vintages, queried through the API's fred/series/vintagedates endpoint
- Free API key, 120 requests a minute before a 429 error
- OECD production series for member countries, plus the Board's capacity utilization series (TCU)
- Graph arithmetic and CSV download on every series page
Pricing
Free. The API needs a free key.
Pros
- Same-day updates for U.S. industrial production
- Vintage history for backtests
- Documented rate limit
Cons
- Non-U.S. coverage depends on what the OECD and other agencies feed it
- Throttling beyond 120 requests a minute can bring a temporary block, so keep an eye on loop speed
- INDPRO levels follow the Board's move to a 2022 base on 24 November 2026
Users name the price as the draw. One commenter on r/Economics, October 2023, put it this way: "Unless you want to pay a hefty subscription price for something like Bloomberg or Hager, FRED is absolutely your best go-to." Another, on r/Daytrading in September 2026, wrote that "FRED is free with an API key and covers the US series (NFP, CPI, GDP, rates) including revisions".
Why it’s ranked #1. FRED matches the Fed's 18-day lag and adds queryable vintages plus a documented 120-per-minute API, which the G.17 page lacks. It beats the Fed's own release on revision history, the second criterion.
Federal Reserve Board G.17
Best fit
Economists who need U.S. industrial production and capacity data straight from the horse's mouth, with the industry tables the headline is built from.
The Board of Governors of the Federal Reserve System publishes the Industrial Production and Capacity Utilization (G.17) release around the middle of each month. The index covers manufacturing, mining, and electric and gas utilities, and the Board says "the production index measures real output" and is expressed as a percentage of real output in a base year, currently 2017.
The total is built from 297 individual series on 2022 NAICS codes, covering industries across manufacturing, mining and utilities. For 2024, physical product data covered 54 percent of value added and production-worker hours covered 44 percent. Annual benchmarks draw on the Minerals Yearbook from the U.S. Geological Survey and on publications of the Department of Energy.
Key features
- Total IP plus 297 series classified into industry groups and market groups such as consumer goods, business equipment and materials
- Capacity utilization for manufacturing, mining and utilities, each with a 1972 to 2025 average
- Fisher indexes since 1972, with weights from annual estimates of value added
- Monthly supplement, annual revision tables, PDF, ASCII, RSS and XML formats
- Industrial production and capacity utilization in one release, with a capacity growth column
Pricing
Free.
Pros
- Zero lag: this is the source
- Published source shares tell you how much of each month is measured and how much is estimated
- Capacity utilization ships in the same table as output
Cons
- U.S. only, excluding the territories
- The Data Download Program's package builder disappears the week of 9 November 2026, ahead of the program's retirement
- No vintage query on the release page itself
- The base year changes to 2022 on 24 November 2026, so every saved level shifts
The method draws critics. A Hacker News commenter wrote in February 2010:
"The methodology used by the Industrial Production Index is extremely problematic. Any index that uses Fisher price indexes introduces huge amounts of subjectivity."
Hacker News, bokonist, 28 February 2010
Why it’s ranked #2. The G.17 carries 297 U.S. series at an 18-day lag, beating Eurostat's 45 days. It loses to FRED on the second criterion, since its own pages offer no vintage query or documented API limit.
Eurostat
Best fit
Analysts tracking EU and euro area industrial output by member state and by main industrial grouping.
Eurostat publishes the industrial production (volume) index as dataset sts_inpr_m, base year 2021=100, in calendar-adjusted and seasonally adjusted versions. It describes the index as measuring "monthly changes in the price-adjusted output of industry", with inputs from other branches deducted.
Its 15 October 2026 release showed August industrial production down 0.5 percent in the euro area and 0.3 percent in the EU on the month. On the year, the euro area fell 1.1 percent. Ireland posted the largest annual decrease at 15.0 percent; durable consumer goods rose 0.2 percent in the euro area.
Key features
- Monthly and annual tables (sts_inpr_m, sts_inpr_a)
- Breakdowns for intermediate goods, energy, capital goods, durable and non-durable consumer goods
- Member states plus some EFTA and candidate countries
- Scheduled release calendar; the next one is 16 November 2026
Pricing
Free.
Pros
- Official source for 27 member states in one table
- Main industrial groupings published every month
- Both adjustment types available
Cons
- 45-day lag on August 2026 data
- A different base year (2021) from the U.S. (2017), so levels don't line up
- August numbers are first estimates and move in later releases
Comparing Eurostat with U.S. data takes work. A Hacker News commenter noted in October 2025 that "the statistical details are pretty difficult to compare with the US or Canada, using different methodologies, different terminologies."
Why it’s ranked #3. Eurostat is free and covers 27 member states, which beats Haver's quote-only price on the fifth criterion. It loses to the G.17 on lag: 45 days against 18.
Haver Analytics
Best fit
Bank and central bank economists who need a release in their model within minutes and will pay for it.
Haver lists 290+ time-series databases drawn from 2,500 government and private sources and says data arrive "about one minute" after release, which keeps a desk ahead of the curve. Its data catalogue says U.S. databases run from the early 1900s to the present, and its industrial production database includes electric power use for 285 industries and industry groups.
Key features
- DLX software and the HaverView website
- RESTful API, direct database feeds, cloud delivery
- Forecasts and "As Reported" data stored as of a given date for pre-revision comparison
- Primary-sourced data from the Federal Reserve Board, BEA, BLS, Eurostat, OECD, IMF and the United Nations
Pricing
Quote only. Haver publishes no list price, and Vendr shows no buyer data for it.
Pros
- Updates within minutes of the official release
- As-reported history for revision work
- 45+ years in the business
Cons
- No public price
- Its own pages give two database counts, 290+ and 250+
- No published API quota
Practitioners treat it as standard kit. A self-described practicing economist on r/europe wrote in March 2022 that "I have all of this data at my fingertips (look up Haver DLX)".
Why it’s ranked #4. Haver's one-minute update claim and as-reported history beat Macrobond, which publishes no speed figure. It trails Eurostat because a 2,500-source catalogue still costs an undisclosed quote against Eurostat's $0.
Macrobond
Best fit
Quant and macro research teams backtesting on industrial production as first reported.
Macrobond says it carries 300M+ time series and 150M+ point-in-time series from 2,400+ data sources, with Excel and PowerPoint chart embedding and a Bloomberg integration. G2 lists 51 reviews at 4.7 out of 5.
Key features
- Point-in-time series for revision-free backtests
- Platform with analytics, charting and publication tools
- Data feeds streamed continuously or on demand
- Excel and PowerPoint integration
Pricing
Quote only. The site offers demos, and Vendr's Macrobond page carries no purchase data.
Pros
- 150M+ point-in-time series
- 2,400+ sources
- Chart output built for publishing
Cons
- No list price
- No published update speed
- Country count not stated
Point-in-time data is the reason quants buy it. A commenter on r/algotrading wrote in May 2026:
"Otherwise you end up backtesting on revised data that wasn’t actually known at the time. A lot of quant people use FactSet, Compustat, Refinitiv, Macrobond, Sharadar/Quandl, or FRED ALFRED specifically for that reason."
Reddit, r/algotrading, 21 May 2026
Why it’s ranked #5. Macrobond's 150M+ point-in-time series beat CEIC, which publishes no vintage figure. It loses to Haver, whose one-minute update claim answers the first criterion and Macrobond's pages don't.
CEIC
Best fit
Analysts covering China, India and other emerging markets at the industry level.
CEIC's Global Database holds more than 4.2 million time series, with 14 industrial sectors in detail alongside 18 macroeconomic areas, accessed through the CDMNext platform. Finding one series in 4.2 million can feel like a needle in a haystack, which is what the CDMNext search exists to fix. Its free U.S. industrial production growth page lists a 100-row comparison by country, with monthly data from January 1920.
Key features
- CDMNext for search, charts and reports
- API data feed solutions for client workspaces
- Release alerts and a high-frequency data layer
- Support staff in 20 countries, with 24/7 phone and email support
Pricing
Quote only.
Pros
- 4.2M+ series with emerging-market depth
- 14 industrial sectors
- Complex inquiries resolved within 24 hours
Cons
- The free U.S. page still showed January 2025 as its latest value in October 2026
- No list price
- No published API quota
Two Reddit comments sum up the trade. On r/AskEconomics in April 2020, a user wrote that "if your school has any subscriptions, like with CEIC or OECD, those are pretty easy to use and cleaned up already." On r/Indiastreetbets in December 2024, another noted: "Everything is paid but you can browse CEIC for free for some limited data sets."
Why it’s ranked #6. CEIC's 4.2 million series and 14 industrial sectors beat Trading Economics on coverage depth. It loses to Macrobond on the second criterion: no published point-in-time history against 150M+ series.
Trading Economics
Best fit
A single analyst or small team comparing industrial production by country, with forecasts, on a card payment.
Trading Economics covers 196 countries and 20 million indicators. Its U.S. industrial production page shows 1.40 percent annual growth for August 2026, a 3.44 percent average since 1920, a high of 62.00 percent in July 1933 and a low of -33.70 percent in February 1946, credited to the Federal Reserve. Its models project 1.80 percent for 2027 and 2.80 percent for 2028.
Key features
- Excel add-in and Google Sheets
- API, economic calendar, live streaming
- Forecast export on every plan
- Bulk downloads on Professional
Pricing
Standard is $199 billed monthly with 500 API requests and 500 series exports a month. Professional is $399 billed monthly with 5,000 of each. Quarterly billing takes 15 percent off and yearly takes 25 percent off. A one-week trial costs $49, isn't refundable and auto-charges if not cancelled.
Pros
- A published price
- 196 countries on one page format
- Its own forecasts next to the official series
Cons
- 500 API requests a month on Standard
- No refund or credit for unused days
- Trial capped at 100,000 data points and 100 requests
Reviewers split on format and API price. A Hacker News commenter wrote in July 2017 that "Trading economics is probably a bit friendlier for the layperson." A user on r/algorithmictrading wrote in September 2025: "trading economics api is too expensive".
Why it’s ranked #7. A published $199 price and 196 countries beat Moody's quote-only Data Buffet. It loses to CEIC, whose 14 industrial sectors and 4.2 million series go deeper than a 500-request monthly quota allows.
Moody's Analytics Data Buffet
Best fit
Economists who need baseline and alternative forecast scenarios next to the history.
Moody's Analytics says its main databases hold more than 540 million time series across more than 180 countries and jurisdictions, with forecasts for more than 70 and scenarios running 30 years, updated monthly. Its industrial production page showed 103.07 for August 2026 and notes initial figures are revised in each of the following three months. The site's full Moody's Analytics review is in progress.
Key features
- Data Buffet API in C#, Java, Python and R
- Power Tools add-in for Excel, PowerPoint and Word
- Basket delivery by email, FTP or Amazon S3, in 14 file formats
- Baseline plus up to six forecast scenarios per chart
Pricing
Quote only. Moody's says most forecast data is bought through a sales representative.
Pros
- 540M+ series
- 30-year scenario forecasts
- Four API languages
Cons
- No list price
- Support runs Monday to Friday, 9:00 to 5:00 EST
- Forecasts cover 70+ countries against 180+ for history
Buyers pay for the forecasting team and bite the bullet on a private quote to get it. A Hacker News commenter wrote in September 2025:
"Would also recommend the Moody's Talks podcast led by Mark Zandi, the Moody's Analytics chief economist. He's been more or less talking about this for months now and sounded the alarm much earlier than others about this prospect."
Hacker News, pnexk, 9 September 2025
Why it’s ranked #8. Moody's 540 million series and 30-year scenarios beat UNIDO's quarterly reports. It loses to Trading Economics on the fifth criterion: no published price against $199 a month.
UNIDO Indices of Industrial Production
Best fit
Researchers comparing manufacturing growth rates across countries by industry.
The UN Industrial Development Organization made all of its databases free, with no registration, in February 2022. Its IIP database uses ISIC Rev. 4 at the 2-digit level, base year 2015, with original and seasonally adjusted indices, built from official data collected directly from national statistical offices.
UNIDO's Q2 2026 report came out on 29 September 2026 and tracks the trend by region and technology level. It found computers and electronics among the main drivers of manufacturing growth over five years, and manufacturing exports up 6.1 percent on the quarter.
Key features
- IIP database with annual, quarterly and monthly production data
- INDSTAT Rev. 4 with annual data from 2005 to 2020 for about 110 economies
- National Accounts Database with manufacturing value added for 210+ economies
- Monthly infographic and working paper series
Pricing
Free, under a Creative Commons license.
Pros
- One classification for every country
- Reuse terms set by a Creative Commons license
- Detail for 2-digit ISIC industries
Cons
- 91 days from quarter end to report
- Base year 2015, a third base on this page
- Country-level IIP coverage count not stated
Critics point out UNIDO repackages national figures. A commenter on r/moderatepolitics wrote in April 2026: "Citing NIST, World Bank, and UNIDO does not provide three independent proofs".
Why it’s ranked #9. UNIDO collects its own figures from national offices on one ISIC Rev. 4 frame, which DBnomics, a pure aggregator of 94 providers, doesn't. It loses to Moody's on coverage: one 2-digit frame against 540 million series and 30-year forecasts.
DBnomics
Best fit
Developers who want one API for many statistical agencies' industrial production series.
DBnomics is run by CEPREMAP and keeps original codes and values as published. Its API lists 94 providers, with Python and R clients and a daily update pipeline. A Treasury testimonial on its home page says the service feeds macroeconomic diagnostics and forecasting for France and other advanced economies.
Key features
- Web API v22 with Python and R clients
- Daily fetchers for each provider
- Open-source platform code
- Provider structures preserved as published
Pricing
Free. DBnomics runs under the radar on a sponsorship budget: €100,000 a year raised against a €200,000 goal.
Pros
- 94 providers, one query format
- Free and open source
- Daily refresh
Cons
- Only as fresh as each upstream provider
- Funding at half its stated goal
- Thin charting
A Hacker News commenter in November 2019 called it "an example of a free & open API to source large volumes of data, in this case economic data. It's also completely open source." The r/Economics commenter quoted under FRED added that sites "like DBnomics as well as the IMF, World Bank etc" have good databases, "but not the same kind of charting functionality etc as FRED."
Why it’s ranked #10. DBnomics puts 94 providers behind one free API with Python and R clients. It trails UNIDO because every figure comes from an upstream provider, so its lag equals each source's lag plus a daily fetch.
Five of the ten cost nothing: FRED, the G.17, Eurostat, UNIDO and DBnomics. Run a paid trial only after the free five fail a named test on this page, such as lag in minutes, emerging-market depth or vintages.
What the industrial production index measures
The industrial production index measures real output, the physical volume of goods produced, across the industries of manufacturing, mining, and electric and gas utilities. Moody's describes output as "the physical quantity of items produced, as distinct from sales value", and notes the index excludes agriculture, construction, services and trade.
The Board explains why the series gets watched in its G.17 notes: the industrial sector, together with construction, "accounts for the bulk of the variation in national output over the course of the business cycle". GDP arrives quarterly. Industrial production arrives monthly, which is why it's a staple in short-term trend work.
Capacity utilization rides along and measures how much of that capacity is in use. The Board has defined the rate as the seasonally adjusted IP index divided by a capacity index, and builds capacity as the greatest output a plant can maintain on a realistic schedule. It aims for a given rate, such as 85 percent, to signal the same degree of tightness in any decade.
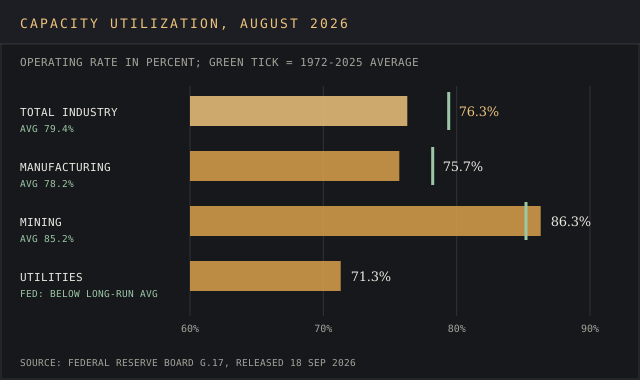
Total U.S. capacity utilization in August 2026, 3.1 percentage points below its 1972 to 2025 average.
August 2026 shows the spread. Manufacturing declined to 75.7 percent, while the mining operating rate rose to 86.3 percent, above its average. Annual FRED averages show how far the rate falls across the business cycle: 68.4 percent in 2009 against 81.6 percent in 2000.
U.S. industrial production in August 2026
The latest G.17, released 18 September 2026, gives these figures, all seasonally adjusted. Hot off the press numbers like these get revised, and the November annual revision rebases the index to 2022 with Census Bureau benchmarks for 2023 and 2024.
- Total industrial production: unchanged on the month, 1.4 percent above August 2025, index 103.1
- Manufacturing output: a 0.3 percent decrease, after seven monthly gains
- Mining output: up 0.1 percent
- Utilities: up 1.8 percent, as electric utilities offset a decline at natural gas utilities
- Durable consumer goods: down, offset by nondurables inside a 0.1 percent consumer goods gain
Data sources and how collection differs
Seven of the ten databases here redistribute figures that national agencies collect. The Fed's 297 series across industries mix physical product counts with production-worker hours, and its source table shows 98 percent of 2024 value added as received data and 2 percent estimated. That kind of transparency is the test for data integrity: a vendor should tell you which numbers were collected and which were modeled.
Classification differs by source, and each system groups industries differently. The Fed uses NAICS, Eurostat uses NACE divisions, and UNIDO uses ISIC Rev. 4. A cross-country table that mixes them needs a concordance, and the devil's in the details: Eurostat builds its index to reflect value added, while the Fed splits its series into market groups of final products and materials.
Seasonal adjustment differs too. Two examples: Eurostat publishes calendar-adjusted and seasonally adjusted series side by side. UNIDO publishes original and seasonally adjusted indices. Pick one and stick with it across countries.
Three base years appear on this page: 2017 at the Fed, 2021 at Eurostat and 2015 at UNIDO. A cross-country chart needs every series rebased to one year first.
Pricing across industrial output data providers
Half the list costs nothing: FRED, the G.17, Eurostat, UNIDO and DBnomics are free. The market data pricing report shows why paid terminals cost an arm and a leg next to them. The hidden costs sit in quotas. Trading Economics' Standard plan allows 500 API requests a month. FRED allows 120 a minute.
One nightly refresh of 30 country series uses 900 Trading Economics requests in a 30-day month, more than the Standard quota.
Trading Economics is the only paid vendor here with a list price: $199 or $399 a month, 25 percent off on yearly billing. CEIC, Haver, Macrobond and Moody's quote privately, which is par for the course in macro data, and Vendr's marketplace holds no buyer data for any of the four.
Reuse regulations differ by source. UNIDO licenses its data under Creative Commons, while redistribution in a newspaper or periodical needs Trading Economics' Enterprise plan, which adds white label and data distribution rights at a custom price billed quarterly or yearly.
Common buying mistakes
- Paying for U.S. data you can get free: the G.17 and FRED carry the published industry detail at no price
- Ignoring the base year: 2017, 2021 and 2015 appear on this page, and the Fed moves to 2022 in November
- Backtesting on revised data without vintages
- Buying a quota sized for a demo, then hitting it in week two
- Comparing NAICS, NACE and ISIC series for the same industries without a concordance
- Skipping reuse regulations: a Creative Commons license and a paid redistribution clause allow different things
For most U.S. and EU work the free sources are the whole job. A paid seat pays off when lag in minutes, emerging-market depth or vintages matter, and the $49 Trading Economics trial is a drop in the bucket next to an enterprise quote.
Related rankings and guides
Supply chain and planning teams use industrial production as an input. The supply chain intelligence ranking and the demand forecasting software ranking cover the tools that consume it. The data providers guide and the alternative data ranking cover the categories beside it.
For method, the secondary market intelligence guide explains how to work with published statistics, and the printing industry statistics report shows a FRED industry series in use. Sector pages for automotive and energy cover two industries the index weights heavily; motor vehicles and parts carry about 5 percent of the Fed's index.
Index data ends at the industry level. For vehicle output by model, MarkLines publishes monthly production for 43 countries on a public price list from $5,100 a year, and our MarkLines review covers what the subscription adds.
Industrial production index FAQ
What is the industrial production index?
It's a monthly index of real output in manufacturing, mining, and electric and gas utilities, expressed as a percentage of output in a base year. It arrives monthly, three times as often as quarterly GDP. The U.S. version is published by the Federal Reserve Board in the G.17 release.
How is the industrial production index calculated?
The Fed calculates Fisher indexes from 297 series covering individual industries, weighted by annual value added. Monthly inputs are physical product data and production-worker hours. Eurostat's index tracks price-adjusted output with inputs from other branches deducted.
Who publishes the index of industrial production?
National statistical offices and central banks: the Board of Governors of the Federal Reserve System in the U.S., Eurostat for the EU. UNIDO compiles a cross-country version, and FRED, Haver, CEIC, Macrobond, Trading Economics and Moody's redistribute them.
Is industrial production released every month?
Yes. The Fed publishes around the middle of each month, Eurostat about 45 days after the reference month ends, and UNIDO reports quarterly with monthly infographics.
What is the current rate of industrial production growth in the U.S.?
Total industrial production was 1.4 percent above its level in the same month of the previous year in August 2026, per the 18 September 2026 G.17.
Is U.S. manufacturing going up or down?
Manufacturing output fell 0.3 percent in August 2026 after seven monthly increases, and stood 0.9 percent above August 2025, so the factory side of the economy is flat to slightly up over a year.
Bottom line
FRED wins for most buyers: free, same-day U.S. data, OECD series, vintages and a documented API. Go to the G.17 for capacity utilization and the industry tables, and to Eurostat for the EU.
Pay only for a gap the free tier can't fill. Haver fits a desk that needs a release in minutes, Macrobond fits backtests on as-first-reported data, CEIC fits emerging markets, Trading Economics fits a solo analyst who wants a published price, and Moody's earns its quote with scenario forecasts. UNIDO and DBnomics round out the free tier.