Market data pricing in 2026: exchange fees, vendor plans and what firms pay
 By Jan Suski. I go deep on every review, checking every number against its source and digging up details other coverage misses, a habit from six years of SEO and link building for tech companies. Bylines at Surfer, Brand24, and Senuto. How the scoring works.
The numbers Market data fees and industry spend, checked 6 October 2026
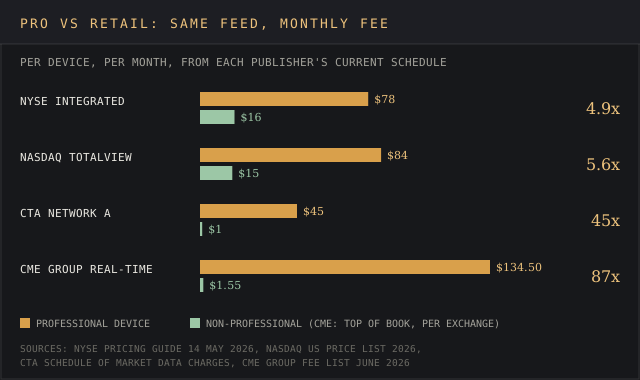
Professional status moves a monthly quote bill by a factor of 4.9 to 87 on the same feed, so user classification is the first line of any market data budget.
A trading firm taking direct order book data from four US stock exchanges starts above $1.3 million a year in market data fees before it buys a single terminal.
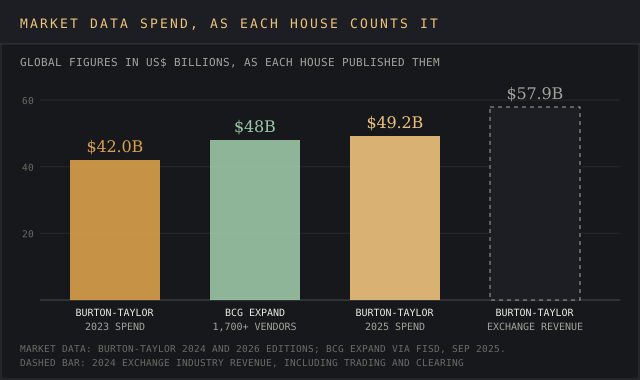
The two research houses that size the industry land within $1.2 billion of each other, near $48 billion to $49 billion, while counting different sets of vendors.
A retail trader pays $1.50 a month for New York Stock Exchange Level 1 quotes through Interactive Brokers. A professional pays $45 for the same real-time feed. Market data pricing runs on that split, and on four lines of fees that every stock exchange charges the firms that touch its real-time data: access, display, non-display and redistribution.
This report prices the whole stack from published rate cards: stock exchange fee schedules from the New York Stock Exchange, Nasdaq, the CTA plan and CME Group, broker pass-through fees, market data API plans and terminal contracts. Industry spend comes from Burton-Taylor, BCG Expand and Coalition Greenwich, and each of the three measures something different. Each figure links to the exchange or data provider that published it.
It's written for traders weighing a data bill against commissions, developers pricing an API, and market data managers at financial institutions who license display and non-display use across dozens of feeds. Every figure was checked against its publisher's own page on 6 October 2026.
What market data pricing covers
Market data pricing is the set of fees exchanges and data vendors charge for feeds from stock, options, futures and bond markets: quotes, trades, order book depth, values for indices and the historical data built from them. Investors use it to make informed decisions on what to buy and when to exit. Users range from a person checking stocks on a phone to a bank running 10,000 display devices around the world.
Regulation sets part of what that data contains. The SEC's market data infrastructure rule, adopted 9 December 2020, expanded consolidated equity data to carry quotation sizes at five price levels beyond the national best bid and offer, odd-lot quotes, and auction information. The SEC's Brett Redfearn said core data had "lagged meaningfully behind" proprietary products, which exchanges price with their own access, user and non-display fees.
Level 1, Level 2 and Level 3 data
Level 1 is the best bid, the highest price buyers are posting, and the best offer, the lowest price sellers are posting, with their sizes and the last sale. The bid ask spread on a quote screen is the gap between those two prices. Level 2 adds the depth of orders at each price level, so traders can see size resting below the bid and above the offer on the stocks they follow.
Databento defines Level 3 as every individual buy and sell order at every price level, with each add, modify, cancel and fill recorded as its own event. Resting orders can be cancelled at any moment, so Level 2 depth changes between refreshes. The name comes from Nasdaq's old Level 3 service, which let registered market makers enter, modify and cancel quotes and confirm trades. In a nutshell, Level 3 is the full book, event by event.
Real-time, delayed and snapshot quotes
Real-time data reaches the subscriber as the exchanges publish it, and real-time quotes on US stocks update tick by tick. Delayed data from most exchanges runs on a lag that Interactive Brokers puts at "usually 10-20 minutes" behind real-time quotes, and it's free at the major retail brokers and charting tools. TradingView's data coverage table lists CME Group data at a 10-minute delay and Hong Kong Futures Exchange data at 15 minutes.
Snapshot quotes sit between the two, the best of both worlds for a light user. A snapshot is one static reading taken at the point of order entry, and Interactive Brokers charges $0.01 per request for US-listed stocks and ETFs and $0.03 for other securities. Every account gets a $1.00 monthly waiver, worth 100 US equity snapshots. If a client's snapshot fees in a month reach the price of the real-time streaming service, the account moves to streaming automatically.
Consolidated data shows the National Best Bid and Offer by combining real-time quotes from all US exchanges. A US equity snapshot carries size, quantity and market identifiers for the NBBO and the last sale from Consolidated Tapes A, B and C. Non-consolidated real-time data comes from a subset of exchanges and shows no NBBO, and TradingView's Nasdaq and NYSE rows offer free "limited real-time" quotes via Cboe One.
The four fees on every exchange schedule
Stock exchanges price their real-time products on four lines, and the publishers' own PDFs carry the figures below. Exegy's April 2026 guide to market data fees defines them, and every stock exchange schedule checked for this report uses the same four. Access fees are billed per feed, so internal teams pay once for each product they receive:
- Access fees: a flat monthly charge for receiving a given data feed at all. The NYSE Integrated feed carries $8,400 a month in access fees.
- User or display fees: charged per display, meaning per screen or device that shows the data, at a professional or retail rate.
- Non-display fees: charged for machine use of the feed, including execution algorithms, smart order routers and market making engines. They vary by exchange, by how the feed is used and by how many systems consume it.
- Redistribution fees: paid to move the data, display or non-display, to a system, person or business outside the firm that bought it.
The table compares those fees across five US equity products, taken from the NYSE Market Data Pricing guide dated 14 May 2026, the Nasdaq US Equities Price List 2025-2027 and the CTA schedule of market data charges. All fees are paid monthly, and every number is a published list price for real-time service.
| Real-time product | Access or distributor fees | Professional device | Retail device | Non-display fees | Redistribution fees |
|---|---|---|---|---|---|
| NYSE Integrated (real-time depth) | $8,400 | $78 | $16 | $22,400 per category, Category 3 capped at $67,200 | $4,400 |
| NYSE OpenBook (real-time depth) | $5,000 | $60 | $15 | $6,000 per category, capped at $18,000 | $3,000 |
| NYSE BBO (real-time top of book) | $1,500 | $4 | $0.20 | $1,500 per category, capped at $4,500 | No line, $25,000 enterprise fee |
| Nasdaq TotalView (real-time depth) | $1,690 internal, $4,230 external distributor | $84 (2026) | $15 | $412 per subscriber at 1 to 39, firm cap $75,000 | Within external distributor fees |
| CTA Network A (real-time consolidated tape) | $1,750 direct access, bid-ask | $45 at 1 to 2 devices | $1 | $2,000 (quotation) | $1,000 |
Every figure in this table is a published fee-schedule figure, monthly, from the NYSE Market Data Pricing guide (14 May 2026), the Nasdaq US Equities Price List 2025-2027 and the CTA schedule of market data charges, checked 6 October 2026.
Non-display fees grow the bill fastest. The New York Stock Exchange charges $22,400 a month for each of three non-display categories on its Integrated feed, so a firm using the data in all three pays up to the $67,200 cap. Nasdaq counts non-display by subscriber, at $412 each for the first 39, up to $75,000 per firm. Market data fees on this line cost an arm and a leg next to display fees.
Access fees are flat no matter how many users read the feed. Nasdaq prices internal and external distribution separately: $1,690 a month for internal use by a firm keeping the data inside its walls, and $4,230 for one that sends it to outside customers or clients. The CTA plan prices direct access to the Network A bid-ask feed at $1,750 a month and indirect access through a vendor at $1,250.
Exegy added the lines up in a worked example that gives the clearest insight into a firm-level bill. Its comparison of minimum fees for real-time order book feeds across NYSE, Nasdaq, Cboe and IEX, at 20 devices and one non-display category, totals $111,020 a month, or $1,332,240 a year. IEX charges $0 on every line. Exegy notes the table isn't an exact representation of any firm's bill, because account managers and fee updates move the numbers.
Professional and non-professional subscriber pricing
The professional rate is the largest single multiplier in market data cost across exchanges and markets. On the four real-time products below, the professional device fee runs from 4.9 times to 87 times the retail rate for the same quotes. The difference on CME Group futures is $132.95 a month per device.
Interactive Brokers defines a non-professional as an individual who isn't registered with financial regulatory bodies, isn't acting as an investment adviser, and isn't employed by financial institutions to perform registration-exempt functions. Exegy's shorter test is a person who receives market data solely for non-business use. Anyone who fails the test pays the professional rate, and the devil's in the details of each exchange's wording.
The split dates to at least 2001. A 28 March 2001 memo from the Financial Information Services Division to the SEC's advisory committee on market information described the professional and non-professional distinction as the basis for fee determination. It listed four units of count used to bill users: device-based, user-based, location-based and identification-based.
Volume discounts on display fees exist on the professional side only. The CTA plan charges $45 a device a month for one or two devices, $27 for 3 to 999, $23 for 1,000 to 9,999 and $19 above 10,000. Retail subscribers pay $1 on Network A and $1 on Network B at any count. Large organizations with internal desks around the world gain the most from those tiers.
Prices and fees also move on a published timetable. Nasdaq's three-year price list raises the TotalView professional fee from $80.50 in 2025 to $84.00 in 2026 and $86.00 in 2027, while the retail fee stays at $15.00 in all three years. CME Group's June 2026 fee list sets the professional real-time device at $134.50 a month, against $1.55 per exchange for retail top of book and $12.10 for retail depth on futures markets.
What retail traders pay through a broker
Retail investors and clients gain access to data from exchanges through a broker or charting platform, which signs the exchange contract, collects the market data fees on its own bill and adds a margin or a bundle on top for its customers. Interactive Brokers publishes the whole nine yards of its pass-through table across exchanges in more than a dozen markets, which makes it the cleanest example among retail brokers for customers comparing costs.
Its US Securities Snapshot and Futures Value Bundle costs a $10.00 monthly base that's waived for trading activity, plus $0.01 per snapshot. The US Equity and Options Add-On Streaming Bundle costs $4.50 for retail clients and $125.00 for professionals. Single real-time networks run $1.50 each at the retail rate for NYSE (Network A), the NYSE American, Cboe, Arca and IEX group (Network B) and Nasdaq (Network C), against $45, $25 and $25 for professionals.
Depth data costs more, and the business case rests on how many stocks a trader watches. Nasdaq TotalView-OpenView runs $16.50 a month at the retail rate and $90.00 for professionals at Interactive Brokers, a package that adds OpenView to the TotalView feed Nasdaq lists at $15 and $84. OPRA options quotes cost $1.50 and $32.75. CME real-time Level 1 runs $1.55 and Level 2 $12.10 for retail traders on futures markets.
Subscription fees start from the day of subscription and are billed within the first three business days of each following month. They aren't pro-rated, so a subscription opened on the 28th costs a full month, and a client who unsubscribes mid-month pays the full month too. Individual accounts need at least $500 in equity to subscribe, a detail that flies under the radar for new accounts.
Level 2 is rationed by quote lines as well as by price, set out in the broker's own pricing notes for clients. Every client starts with 100 concurrent lines of real-time data for stocks, options or indices, and for every 100 lines a client can view Level 2 depth for one symbol, with a minimum of 3 and a maximum of 60 symbols at a time.
Asian markets add residency rules to stock data. Interactive Brokers splits its Shanghai Stock Exchange and Shenzhen Stock Exchange packages into versions for mainland China residents and for non-mainland China residents, so eligibility follows the trader's home country. It also sells a Shanghai Stock Exchange 5-second snapshot and a Shenzhen Stock Exchange 3-second snapshot routed through HKEX.
TradingView sells add-ons per exchange on top of its plans. Its table lists the real-time US Stock Markets bundle at $9.95 a month, Nasdaq and New York Stock Exchange data at $3.00 each, and the China Financial Futures Exchange, a mainland China futures venue, at $26.00. Cboe One quotes are free, the Abu Dhabi Securities Exchange is free after sign up, and the National Stock Exchange of India lists stocks, bonds and indices at no real-time fee.
Market data API pricing
API vendors bundle exchange licences into a monthly subscription and meter usage by credits, calls or bytes. Each data provider in the table meters a different unit. Real-time stocks on retail API plans are restricted to non-professional users, and commercial redistribution needs a separate contract. The market intelligence API rankings cover the wider field of data APIs and the tools built on them.
| Vendor and plan | Monthly price | Usage limit | Data depth | Real-time stocks |
|---|---|---|---|---|
| Market Data Starter | $30 ($12 billed yearly) | 10,000 daily API credits | 5 years | Real-time, retail only |
| Market Data Trader | $75 ($30 billed yearly) | 100,000 daily API credits | No limit | Real-time stocks and options |
| Massive Stocks Developer | $79 | Unlimited calls | 10 years | 15-minute delayed |
| Massive Stocks Advanced | $199 | Unlimited calls | 20+ years | Real-time, retail only |
| Databento Standard | $199 | Personal use, up to 2 devices | Usage-based, per byte | Real-time, licence fees passed through |
| Databento Plus | $1,750 in licence fees | Annual contract | Usage-based | Real-time |
| Alpha Vantage premium | $49.99 to $249.99 | 75 to 1,200 requests per minute | Plan card silent | Real-time after a separate entitlement step |
Every price in this table is a published list price from the vendor's own pricing page, checked 6 October 2026.
Market Data's pricing page starts real-time stock data at $30 a month, or $12 billed yearly, so developers on a budget can zero in on that Starter plan. The free tier gives 100 daily API credits, and the 30-day trial needs no card at sign up. Quant and Prime run $125 and $250 a month for 10,000 and 100,000 credits per minute. The Commercial plan is custom, permits redistribution, and says real-time commercial quotes require exchange licensing.
Massive gates real-time data behind its top plan, and only that plan supports live quotes on stocks. Stocks Basic is free at 5 calls a minute with 2 years of end-of-day data for US stocks. Starter at $29 and Developer at $79 serve 15-minute delayed data with 5 and 10 years, and Advanced at $199 delivers real-time data and 20+ years, for retail users only.
Databento bills historical data per outbound byte and gives $125 in free credits to new users at sign up. Its live data plans, which deliver real-time data from exchanges, run $199 a month for Standard, and $1,750 and $4,500 a month in licence fees for Plus and Unlimited on annual contracts. The page states it passes exchange licence fees through "with no upcharge."
Alpha Vantage gives 25 free API requests a day and sells premium plans from $49.99 a month for 75 requests a minute to $249.99 for 1,200. Real-time and 15-minute delayed US market data need a separate entitlement process in its Alpha X Terminal on top of the plan. API credit rules differ across all four vendors, and each one sets a request limit, so read the usage limit and the support terms before the price.
Historical tick data from exchanges is priced by volume, and it's the raw material for backtesting trading strategies. Databento's per-byte billing means a backtest across years of order book events costs more as depth and date range grow, which turns storage and transfer into budget lines. The 2025 Coalition Greenwich study for SIX found more than three-quarters of buy-side respondents looking for additional sources of historical tick data.
Terminal and desktop pricing
Terminals bundle real-time data from exchanges, news, analytics and messaging into one seat price, with access to stocks, bonds, cash and derivatives markets on one screen. NeuGroup reported on 9 October 2024 that a single Bloomberg terminal renews at $31,980 a year from 1 January 2025, with firms holding two or more paying $2,360 a month, or $28,320 a year, up from $26,580. The Bloomberg terminal pricing report tracks that seat in detail.
For FactSet, LSEG and S&P Global, each data provider prices on request, so procurement data supplies the figure. Vendr's tracked contracts put the median at $25,160 a year for FactSet, $4,752 for LSEG and $61,800 for S&P Global, each a contract total that can cover several seats and modules. Each quote starts with a request to sales, and the price depends on seats, modules and the indices and credit data included.
| Data provider | Annual figure | Range | Source |
|---|---|---|---|
| Bloomberg terminal | $31,980 single seat, $28,320 per seat at 2+ | Published renewal rate | NeuGroup, 9 Oct 2024 |
| FactSet | $25,160* median contract | $4,200* to $28,179* | Vendr |
| LSEG (Refinitiv) | $4,752* median contract, 35 deals | $1,161* to $20,190* | Vendr |
| S&P Global | $61,800* median contract, 60 purchases | $13,900* to $215,000* | Vendr |
Figures marked * are Vendr tracked contract values from anonymized purchase data, checked 6 October 2026. The Bloomberg row is a press-reported renewal rate from NeuGroup, 9 October 2024.
The FactSet pricing teardown breaks down that $25,160 median, and the FactSet vs Bloomberg comparison sets the two desks side by side, so a buyer can explore the business case for each in more detail. LSEG Workspace is the product Refinitiv became after the London Stock Exchange Group closed its purchase, covered in the LSEG acquisition report and the LSEG review.
S&P Global customers report 8% average savings in Vendr's data. Firms on the fence between desktops can explore content as well as price, starting with the financial data providers ranking and the investment research platforms ranking, which compare coverage of stocks, bonds, credit, indices and other securities provider by provider, along with support and service terms.
Market data cost from a retail seat to a trading firm
Annual market data cost spans five orders of magnitude between a hobby account trading a few stocks and a trading firm connected to every US exchange. Lined up on a log scale, the published prices in this report fall into three bands: retail real-time quotes under $500 a year, API and desktop seats from about $2,000 to $62,000, and direct real-time feeds from exchanges above $1 million.
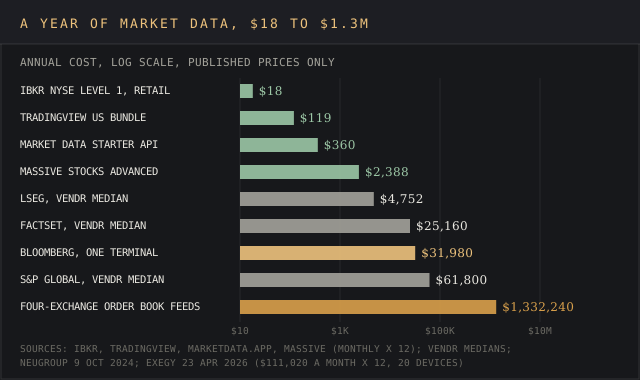
Annualised, one IBKR network costs $18, TradingView's US bundle $119.40, Market Data's Starter API $360 and Massive's Advanced plan $2,388. An $18 feed costs virtually nothing beside a $31,980 terminal, a drop in the bucket for any desk. At the top of the ladder, the FISD's 2001 description of market data administration as "substantial and costly to all participants" applies in full, since every device and every non-display use has to be counted and reported.
Global market data spend
Financial institutions spent a record $49.2 billion on financial market data and analysis in 2025, up 6.5%, according to Burton-Taylor's Financial Market Data/Analysis: Global Share & Segment Sizing 2026, published in March 2026 by the TP ICAP-owned research house. Its 2024 edition, published 4 April 2024, put 2023 spending at $42.0 billion after 12.4% growth.
BCG Expand sized the same industry at $48 billion in a September 2025 announcement published by FISD, covering more than 1,700 vendors. It attributed $11 billion of that value to specialist and smaller vendors it described as previously underrepresented, a model that gives more insight into the long tail of data vendors.
Budgets at financial organizations point the same way. The Coalition Greenwich study for SIX, run in mid-2025 across US, UK and European asset managers, wealth managers and private banks, found almost 70% expecting a market data budget increase of 1% to 5%. 65% used real-time data throughout the trading day, 63% received data through public cloud against 30% in 2023, and 80% of asset managers named AI as a driver of data use.
Stock exchanges sit underneath all of it as the source of real-time prices, and their feeds of stocks, bonds and indices reach customers through every vendor in this report. Burton-Taylor's Exchange Global Share & Segment Sizing 2025 put global exchange industry revenue at $57.9 billion in 2024, up 7.5%, a total that includes trading and clearing along with data sales.
Why the published estimates diverge
The three sizing figures in this report span $42.0 billion to $57.9 billion, and each one answers a different question about a different scope. Reading between the lines of each release explains most of the gap and gives more insight than any single figure, since each covers a different slice of the world's data business.
Vendor count is the first reason. BCG Expand's model counts more than 1,700 vendors and assigns $11 billion to specialist and smaller ones, so a house that tracks a shorter list of large vendors reports a different base for the same year. Each extra data provider counted adds revenue to the total.
The year is the second. Burton-Taylor's $42.0 billion is a 2023 figure and its $49.2 billion is 2025, while BCG Expand's $48 billion came with a September 2025 announcement. Burton-Taylor's own 6.5% growth rate implies a 2024 base of about $46.2 billion, which puts BCG Expand's figure between the two Burton-Taylor years.
The measure is the third. Burton-Taylor's exchange benchmark counts total exchange revenue, including trading and clearing fees, so its $57.9 billion covers the whole exchange business. Coalition Greenwich measures budget intent across buy-side firms and publishes percentages of respondents.
Taken straight from the horse's mouth, Burton-Taylor's latest count puts spend just under $50 billion and growing 6.5% a year, with BCG Expand's $48 billion $1.2 billion below it. The financial market intelligence guide maps the vendors behind that total. Market data customers fund it through the access, display and non-display fees on every schedule above.
What drives a market data quote
Exchange fee schedules and vendor quotes move on the same handful of variables, and each one below is visible in a published price on this page:
- Latency and granularity. The New York Stock Exchange's BBO, a top-of-book feed, carries $1,500 in access fees, while its Integrated depth feed carries $8,400. Ultra-low latency depth feeds carry the highest access fees on the NYSE schedule, and delayed data sits at $0.
- Coverage. Brokers price stock exchange by stock exchange, so each added venue stacks another monthly line, leading to bigger bills as coverage widens. Broad coverage of markets across cash equities, options, futures, indices and bonds means one subscription per venue at Interactive Brokers, which lists separate packages for US, Chinese and Hong Kong exchanges.
- User classification and count. Professional status multiplies the device fee by 4.9 to 87, and CTA's tiers cut the professional rate from $45 to $19 above 10,000 devices.
- Usage. Non-display use for algorithms, risk systems or market making carries its own category fees, $22,400 each at the New York Stock Exchange for the Integrated feed.
- Distribution and licence type. Nasdaq charges $1,690 for internal distribution and $4,230 for external distribution, and redistribution to outside customers or clients carries its own line of fees.
- Data depth. Massive's stock plans step from 2 years of price history to 20+ years as the price moves from $0 to $199 a month.
Granularity and its price have been argued at the SEC for years. Chairman Jay Clayton's statement on market data fees and market structure, published 16 October 2018, noted that trading algorithms depend on market data, often accessed in microseconds or nanoseconds, a race against time that the priciest feeds are built for. Real-time data at that speed underpins high-frequency trading strategies, risk systems and the decisions an execution desk makes on every order.
Costs outside the fee schedule
Market data fees on the schedule are the visible part of the bill. The 2001 FISD memo stated that the administrative burdens of managing and using market data are substantial and costly, and it described a job market data managers still do, tracking which user has which entitlement, on which device, under which unit of count. Risk and compliance teams carry that support work.
Infrastructure adds a second layer of fees around the world's exchange feeds. Exegy notes that vendors sourcing feeds on a client's behalf manage switches, server rack space, electricity and non-recurring engineering, then deliver those costs to customers through their service fees, along with the data itself. A firm taking direct access to real-time feeds from exchanges carries those costs on its own internal system, along with the staff who support it.
Compliance administration is the third. Every schedule above carries a professional and a retail rate, so organizations classify each user, count internal users and devices and report both to the stock exchange or data provider. Strategy and treasury teams use the same quotes for competitive intelligence and risk management, covered in the market intelligence data guide, and Exegy's non-business test puts those users on the professional rate.
How regulators have treated market data fees
The SEC set aside challenged market data fees from NYSE Arca and Nasdaq in October 2018 and remanded about 400 other fee challenges to the exchanges for reconsideration. Clayton's statement said the exchanges "had not met their statutory obligation" to show the fees were consistent with the Exchange Act. The challengers were customers of that exchange data, led by the securities industry group SIFMA.
Two years later, the December 2020 infrastructure rule for US equity markets replaced the exclusive securities information processor model with competing consolidators registered under new Rule 614. The rule defines depth, odd lots and auction data as part of core data. Fee schedules dated 2025 to June 2026 still carry the four-line structure that predates both actions. Nasdaq's list already sets TotalView's 2027 price, so no schedule here is set in stone.
How to budget for market data and minimize risk
Start with classification, the biggest lever on the bill. Decide who needs real-time data at all. A retail trader should confirm their status with broker support before subscribing, since the professional rate costs 4.9 to 87 times more, the largest risk in a retail data budget. A firm should audit every user against each stock exchange's definition once a year and track the dated price lists, such as Nasdaq's schedule through 2027.
Count the snapshot break-even next, since snapshot fees and real-time fees sit on the same bill. At $0.01 a snapshot, Interactive Brokers' $1.00 waiver covers 100 US equity quotes, and the account moves to streaming automatically once snapshot fees match the streaming price. Light users can stay on snapshots, and a penny saved is a penny earned. The $1.00 waiver works like a credit on the monthly bill.
For a firm, price direct access against a vendor feed and decide which benefits outweigh the extra infrastructure. Exegy's guide sets the exchanges' access fees plus a firm's own hardware on one side and a vendor's service fees on the other. The benefits and the operational risk differ by business, so request both prices in writing.
For example, a firm taking the New York Stock Exchange's Integrated feed directly pays $8,400 a month in access fees before its first device, and 20 professional devices add $1,560. A vendor feed folds the access fees into its own price, plus the infrastructure margin Exegy describes, and the vendor's support desk handles the system.
Developers should test on free tiers before they purchase, and explore what each plan supports for stocks, options and indices. Market Data offers a 30-day trial with no card and 100 daily credits on its free tier. Databento gives $125 in credits, and Alpha Vantage gives 25 requests a day, a cash-free way to confirm a pipeline works. Check the data depth on each plan before signing, since that limit sets the backtest you can run.
For terminal seats, bite the bullet and request three quotes, one per data provider, and compare the benefits each seat includes for the business. Bloomberg's $31,980 renewal and the Vendr medians for FactSet, LSEG and S&P Global give a buyer a clearer view of the range than any single sales call, and that insight comes from published figures.
Frequently asked questions
Is IBKR market data subscription free?
Delayed data is free at Interactive Brokers. Real-time data is a monthly subscription, paid monthly per exchange or bundle: the US Securities Snapshot and Futures Value Bundle carries a $10.00 base that's waived for trading activity, plus $0.01 per snapshot, and single real-time networks covering several exchanges start at $1.50 a month for retail clients.
How much does it cost to pay for market data?
A retail trader can get real-time quotes on US stocks for $1.50 to $9.95 a month through a broker or charting platform, and an API with real-time stocks starts at $30. A professional terminal seat runs from a $4,752 Vendr median for LSEG to $31,980 for Bloomberg, and direct real-time feeds from exchanges for a trading firm start above $1.3 million a year in fees.
What exactly is market data?
Market data is the real-time and historical price and order information exchanges publish for stocks, bonds, options, futures and indices: bids, offers, trades, order book depth, index values and auction results, plus reference and historical data built from them. It's sold real-time, delayed or as snapshots, and exchanges charge separate fees for each form, so traders make informed decisions on which form they need.
What is L1, L2 and L3 market data?
Level 1 is the best bid and offer with sizes and the last sale. Level 2 adds the depth of orders at each price level. Level 3 shows every individual order, with each add, modify and cancel as a separate event. Each level carries its own real-time fees on exchange schedules.
Where can I get market data?
Retail traders get it through a broker such as Interactive Brokers or charting tools such as TradingView, with real-time stocks and indices for a monthly fee. Developers buy it from API vendors such as Market Data, Massive, Databento and Alpha Vantage. Firms license it from terminal vendors or directly from each stock exchange, and the alternative data providers ranking covers sources outside exchange feeds.
How much does market research cost?
Market research is a separate purchase from market data. The market research cost report prices it across 27 vendors, from survey panels to syndicated reports, and explores what business clients pay for each.
Bottom line
Market data cost comes down to four lines of market data fees multiplied by user status, device count and usage. A retail trader pays a dollar or two a month per stock exchange, a professional pays tens of dollars per device, and a trading firm pays six figures a month once non-display and access fees stack across venues.
The published schedules make most of that market data cost predictable for business users and retail investors alike. Classification, device counts and the choice between a direct feed and a vendor feed set the rest, so the ball is in the buyer's court. The industry total sits just under $50 billion by both research houses that size it.
How these fee schedules were sourced, and which desks keep their rate cards private
Every fee, plan price and contract figure on this page was checked against its publisher's own page on 6 October 2026, and each source is linked where it's first cited.
Origin domains in order of first use: interactivebrokers.com, sec.gov, databento.com, tradingview.com, exegy.com, nyse.com, nasdaqtrader.com, ctaplan.com, cmegroup.com, marketdata.app, massive.com, alphavantage.co, six-group.com, connect.neugroup.com, vendr.com, tpicap.com and fisd.net.
Fee schedules and guides, with their dates: the NYSE Market Data Pricing guide (14 May 2026), the Nasdaq US Equities Price List 2025-2027, CME Group's June 2026 market data fee list and Exegy's guide to market data fees (23 April 2026).
Research documents: Burton-Taylor's Financial Market Data/Analysis 2026 (March 2026) and its 2024 edition (4 April 2024), BCG Expand's market sizing announcement on fisd.net (September 2025), the Coalition Greenwich study for SIX (September 2025) and NeuGroup's Bloomberg terminal renewal report (9 October 2024).
The regulatory record cited here is Chairman Clayton's SEC statement on market data fees (16 October 2018), the SEC market data infrastructure rule (9 December 2020) and the FISD memo to the SEC's advisory committee on market information (28 March 2001). Tracked-contract figures are the header stat blocks on vendr.com/marketplace for FactSet, Refinitiv and S&P Global.
Bloomberg, FactSet, LSEG and S&P Global publish no terminal rate card on their own sites, and the CTA schedule of market data charges carries no effective date.