Customer retention statistics for 2026: banking, insurance, B2B and where the numbers split
 By Jan Suski. I go deep on every review, checking every number against its source and digging up details other coverage misses, a habit from six years of SEO and link building for tech companies. Bylines at Surfer, Brand24, and Senuto. How the scoring works.
Bain & Company research puts the profit gain from a 5% rise in customer retention at more than 25% in financial services. Harvard Business Review cites the same Bain work at 25% to 95% across industries, and adds that acquiring new customers costs five to 25 times more than keeping existing customers. Those three customer retention statistics are quoted widely, usually with no link to the publication behind them.
This report traces every figure to the body that published it: Bain, J.D. Power, LexisNexis Risk Solutions, SaaS Capital, PwC, Qualtrics, McKinsey and Zendesk. It covers bank customer retention statistics, insurance customer retention statistics and B2B customer retention statistics in their own sections, plus a section on where the publishers disagree about how many customers a business keeps.
It's written for analysts, product teams and any business owner who needs a sourced number for a board slide. Every figure below links to its source on first use, with the study name and date.
The numbers Customer retention, checked 4 October 2026
A B2B software business keeps 91 cents of every revenue dollar from existing customers before upsells, and the median one grows that back to $1.01 with them.
Only 8% of bank customers changed primary bank in 2024, and one in five moved money out of their primary bank inside three months in 2026.
Almost half of all U.S. auto policies get shopped every year, so an insurer's retention rate is renegotiated with its customers at every renewal.
What acquiring new customers costs against retaining existing customers
The five-to-25-times range comes from Amy Gallo's 2014 HBR article, which says the multiple depends on "which study you believe, and what industry you're in." HBR doesn't pin it to one dataset, so treat it as a range of published estimates on customer acquisition. The same article credits Frederick Reichheld of Bain with the finding that raising customer retention rates by 5% lifts profits by 25% to 95%.
Reichheld's own 2001 Bain brief, straight from the horse's mouth, is narrower. It states that in financial services "a 5% increase in customer retention produces more than a 25% increase in profit." That's the documented floor, and it's specific to one sector. Even a small increase in retention compounds in a financial services business, because retained customers carry no fresh acquisition costs and each new customer acquisition starts the payback clock again.
Reichheld's customer-centric example in that brief was Vanguard: its flagship S&P 500 index fund cost 0.20% of assets in 1996 and 0.18% by 1999, a 10% cut. Chick-fil-A, his second example, gave about 10% of profits to charity while paying store operators double or triple the industry average.
Bain's earlier online retail study with Mainspring priced the payback period for lasting relationships. Its December 1999 survey of 2,116 web shoppers found:
- An online apparel seller had to keep new customers for 12 months to break even on what it spent acquiring them.
- Online grocers spent upwards of $80 in acquisition costs per customer and needed 18 months to break even.
- In apparel, the average repeat customer spent 67% more in months 31 to 36 of the relationship than in months 0 to 6.
That 67% is the source of the claim that existing customers spend more over time, and it's the most quoted of all repeat customer statistics. It describes online apparel purchases in 1999 and 2000, made by repeat customers of dot-com era web stores. Applying it to a 2026 subscription app is a long shot, since the sector, channel and decade all differ.
The retail industry statistics report carries current U.S. sales data for anyone sizing repeat purchases today.
Why published customer retention statistics disagree
Publishers disagree on retention because they measure different things about customers and call all of them retention. The devil's in the details: a bank can lose 8% of its primary customers and see 20% of its customers move money in the same period, and each number is a correct retention figure. The table below shows how the same segment returns different readings by publisher.
| Segment | Measure | Figure | Publisher |
|---|---|---|---|
| U.S. retail banking | Customers who changed primary bank, 2024 | 8% (5% in 2018) | J.D. Power, March 2024 |
| U.S. retail banking | Customers likely to switch in the next 12 months, 2024 | 13% | J.D. Power, March 2024 |
| U.S. retail banking | Customers who moved money from the primary bank in 3 months, 2026 | 20% | J.D. Power, March 2026 |
| U.S. auto insurance | Customers who shopped for auto insurance in the past year | 53% (57% a year earlier) | J.D. Power, June 2026 |
| U.S. auto insurance | Policies-in-force shopped in the prior 12 months, Q2 2026 | 47.2% | LexisNexis, August 2026 |
| B2B SaaS | Median gross revenue retention | 91% | SaaS Capital, 2025 |
| B2B SaaS | Median net revenue retention | 101% | SaaS Capital, 2025 |
The insurance pair shows the effect. J.D. Power counts the share of customers who shopped, and LexisNexis counts the share of policies-in-force that got shopped. A household with two cars and one quote request moves the two figures differently, which accounts for part of the 5.8-point gap.
The profit claims split the same way. Bain's 2001 brief gives a floor of 25% for financial services. HBR's 2014 summary gives a 25% to 95% range across different industries. Both trace to Reichheld, and the wider range carries the wider scope.
Software adds a third layer. SaaS Capital's 1,000-plus companies report a 91% median gross revenue retention and a 101% median net revenue retention, from the same companies in the same year. A churn rate counted by logos, by seats or by revenue gives three more readings. Any average retention rate quoted without its denominator is a red flag for any business case.
Average customer retention rates by industry
Customer retention rates by industry come from industry trackers and survey publishers, each measuring its own customers with its own definition, so every industry gets its own yardstick. Here's what the primary publishers report for the segments with the most retention data.
| Industry | Retention measure | Figure | Publisher and date |
|---|---|---|---|
| B2B SaaS, contracts above $250,000 | Median gross revenue retention | 95% | SaaS Capital, 2025 |
| B2B SaaS, contracts under $12,000 | Median gross revenue retention | 90% | SaaS Capital, 2025 |
| U.S. retail banking | Customers who kept their primary bank, 2024 | 92% | J.D. Power, 2024 (8% switched) |
| U.S. auto insurance | Policies-in-force left unshopped for 12 months | 52.8% | LexisNexis, Q2 2026 (47.2% shopped) |
| Software subscriptions | Median churn rate on Recurly's network | 3.04% | Recurly, July 2026 data |
| Business and professional services | Median churn rate on Recurly's network | 3.21% | Recurly, July 2026 data |
| Digital media subscriptions | Voluntary and involuntary churn rate | 2.55% and 1.59% | Recurly, July 2026 data |
Recurly's software industry figure carries a top-quartile benchmark of 1.78% or below across its network of subscription services.
Recurly attributes the lower churn among B2B businesses and professional services firms to longer contracts, higher switching costs and multi-seat accounts. Its digital media figure splits churn into cancellations (2.55%) and failed payments (1.59%), so media companies lose close to two customers to cancellation for every one they lose to a declined card.
That split matters for the media industry, where a payment-recovery fix wins back customers who never chose to leave. In a nutshell, comparing customer retention rates across sectors only works when the measure, the denominator and the period match. Mobile apps, subscription services and banks all publish retention by cohort, and each defines the cohort its own way.
Bank customer retention statistics
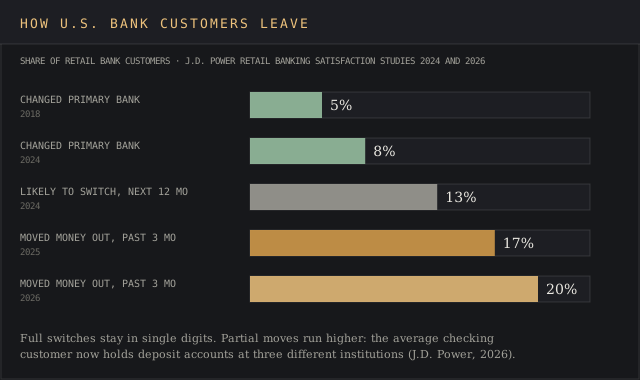
J.D. Power's 2026 U.S. Retail Banking Satisfaction Study, released 25 March 2026, scored overall customer satisfaction at 657 on a 1,000-point scale, up 2 points. The figures on customers leaving sit under that headline. The average checking customer now holds deposit accounts at three different institutions, and 20% of retail bank customers moved money away from their primary bank within the past 3 months, against 17% a year earlier.
J.D. Power calls this soft switching: customers open accounts elsewhere and keep the existing ones while the balance drains under the radar and banking services spread across institutions. The bank customers moving money most often:
- Affluent and mass affluent customers: 25%
- Financially healthy customers: 24%
- Customers under age 40: 23%
The full switch is rarer. In the 2024 edition, 8% of retail bank customers said they'd changed their primary bank, up from 5% in 2018, and 13% said they'd probably switch within 12 months. Fees were the last straw for 29% of those likely switchers, who cited too many or too-high charges, and 26% blamed a poor service experience.
Problem resolution is the part of the customer experience where banks win or lose those customers. J.D. Power's 2026 study puts problem-resolution satisfaction at 587 for national banks, up 49 points from 2024, and 548 for midsize banks, down 27 points.
Poor customer service at the moment a problem lands is a short road to losing customers' deposits, and 26% of likely switchers named it. The financial market intelligence guide covers the data sources banks use to track deposit flows across financial services providers.
Insurance customer retention statistics
Auto insurance retention is set at every renewal, and almost half of customers' policies face a competing quote each year. LexisNexis Risk Solutions, whose Demand Meter covers close to 90% of U.S. insurance shopping activity, reported that 47.2% of auto policies-in-force had been shopped at least once in the 12 months to the end of Q2 2026. Shopping growth slowed to 1.4% year over year from 3.2% in Q1, and new-policy growth fell to 3.3%.
Heavy shopping has been par for the course since 2022. A February 2024 LexisNexis release reported that insurer retention levels had dropped three percentage points since Q1 2022 as customers shopped and switched at higher rates.
J.D. Power's 2026 U.S. Insurance Shopping Study, released 4 June 2026, found the share of customers shopping for auto insurance fell to 53% from 57%. Its other findings on which customers leave and how:
- 48% of new auto policy purchases now happen digitally, up from 36% five years earlier, and shoppers download mobile apps from competing carriers just to compare rates.
- 45% of active auto shoppers hold a homeowners policy, and only 20% received a homeowners quote while shopping for auto, leaving bundled services off the table for most of them.
- 20% of all customers use usage-based insurance, rising to 34% among customers buying from a new insurer.
- Oklahoma, Mississippi and Texas are high-shop, high-switch states. Drivers in New Hampshire and Vermont stay loyal and tend to pay lower premiums.
Price triggers the exit for customers in the auto insurance business. J.D. Power's 2026 U.S. Auto Insurance Study held overall satisfaction at 644, with 30% of customers reporting an insurer-initiated premium increase. When that happens, satisfaction with price falls 155 points to 486.
Customer experience decides renewal too: customers forced to switch channels for a single inquiry (21% of them) are less likely to renew, and agents resolve 91% of those inquiries against 66% on insurer websites.
AI adoption is the newest variable. J.D. Power found 32% of auto shoppers used AI tools, and those users were more than 1.3 times as likely to switch insurers. Only 58% of customers say they completely understand their policy, down 4 points from 2025. The insurance statistics report sizes premiums and coverage gaps across the U.S. market for insurance services.
B2B customer retention statistics
SaaS Capital's 2025 B2B SaaS Retention Benchmarks draw on its 14th annual survey, with more than 1,000 private B2B SaaS companies responding in Q1 2025 and companies under $1 million ARR excluded. The median net revenue retention is 101% and the median gross revenue retention is 91%. Contract size, meaning what customers pay a year, moves both:
- Under $12,000 annual contract value: 98% net, 90% gross
- $12,000 to $25,000: 103% net, 91% gross
- $25,000 to $50,000: 102% net, 91% gross
- $50,000 to $100,000: 104% net, 90% gross
- $100,000 to $250,000: 102% net, 91% gross
- Above $250,000: 106% net, 95% gross
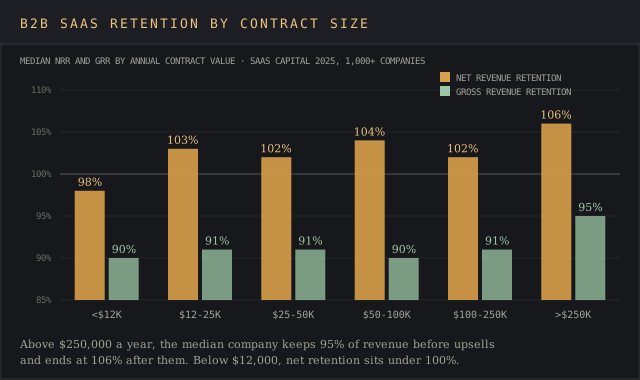
Retention is the strong point of the high-priced software business. SaaS Capital ties it to longer sales cycles, in-depth implementation, and dedicated support & account management. SaaS businesses below $12,000 are the only band where the median company shrinks its installed base of customers before upsells are counted.
SaaS Capital found a strong, exponential correlation between net retention and growth, and little correlation for gross retention.
The survey's median growth rate was 24%, and moving net retention from the 100% to 110% band into the 110% to 120% band added 9 percentage points of growth. Companies with the highest net retention reported growth double the population median, the clearest mark of a successful business in this sample. The Rule of 40 calculator shows how that growth trades against margin for a software business.
Five of the six contract bands post median gross retention of 90% or 91%, so a 95% figure puts a vendor in the top band. The 10-point gap between 91% and 101% measures selling to existing customers: expansion revenue from each current customer through upsells and cross-sells. The SaaS market intelligence and B2B market intelligence guides list the tools sellers use to keep an eye on accounts for expansion and churn signals.
Customer experience and service statistics tied to churn
PwC's 2025 Customer Experience Survey of 5,511 U.S. consumers and 406 executives, fielded 21 May to 30 June 2025, found 52% of consumers stopped buying from a brand after a bad experience with its products or services. Another 29% of those customers stopped after poor customer experience online or in person. For a brand or any business, 52% is the measured cost of a broken buying experience.
Zendesk's Customer Experience Trends Report 2020, a study of what drives customer loyalty, measured the tolerance: half of customers switch to a competitor after one poor experience, and 80% leave after several. Once bitten, twice shy. Those two numbers put a price on excellent customer service, because a second failure costs a company another 30% of its customers.
Qualtrics' 2025 Consumer Experience Trends report, published 15 October 2024 from nearly 24,000 consumers in 23 countries, ranked what goes wrong for customers in a bad experience:
- Service delivery issues: 46%
- Communication problems: 45%
- Employee interactions: 39%
- Pricing concerns: 37%
- Product quality or failure: 35%
- Post-purchase support: 21%
Product quality and reliability sit fifth on that list, behind four failures in how services are delivered. Qualtrics also reports that trust is highly correlated with customer loyalty, and that feedback has fallen to a new low, positive comments included, as customers stay silent about good and bad experiences. Customer feedback that never reaches the company can't flag churn, so teams watch social media, review sites and support logs for the signal.
The customer feedback analysis tools ranking compares platforms that turn surveys, tickets and social media posts into actionable insights, and the Medallia vs Qualtrics comparison covers the two largest survey vendors. Social media listening shows why customers complain, and billing data shows which ones left. A business owner without a CRM can still count customers from invoices and spot unhappy customers on social media.
Humans still close the loop. PwC found 86% of consumers say human interaction is moderately or highly important in their brand experience, and 70% of executives say customer expectations are outpacing their company's ability to adapt. A customer journey map template lays out each hand-off where customers can drop.
Loyalty program and personalization statistics
Customer loyalty programs are everywhere and half-used. Bond's Loyalty Report 2023, produced with Visa, found U.S. consumers belong to 18 loyalty programs on average and actively take part in 50% of them. Canadian consumers hold about 15 memberships with 57% active. Bond's dataset tracks a quarter-million consumers and more than 750 brands across more than 30 countries.
Executives doubt the retention strategies they're funding. PwC's 2025 survey found 57% of executives say their loyalty systems aren't delivering the outcomes they need, and 46% expect their current loyalty program to be irrelevant within three years. Meanwhile 84% have raised loyalty spending, and 83% admit they need better tools to measure what drives purchases.
Money doesn't grow on trees, and a program nobody can measure is business spend without retention data behind it.
McKinsey ties personalization to repeat purchases directly. Its November 2021 personalization research found:
- 71% of consumers expect personalized interactions, and 76% get frustrated when they don't get them.
- 78% said personalized communications made them more likely to repurchase, the clearest data on repeat purchases based on targeting.
- Personalization most often drives increased revenue of 10% to 15%, with company-specific lift from 5% to 25%.
Brands that create content for one customer at a time need data to do it, and customers ration it. Qualtrics found 64% prefer companies that tailor personalized experiences, and 27% are comfortable with organizations using unsolicited data. PwC found 53% will share personal information for a smoother buying experience with a brand, while 93% say a brand that mishandles it loses their trust.
Salesforce's State of the AI Connected Customer report, the closest published measure of customers feeling understood, found 73% of customers say companies treat them as individuals, up from 39% in 2023, and 71% of customers feel increasingly protective of their personal information.
The customer data intelligence platforms ranking covers the tools that unify that data, and the customer engagement strategy template turns it into a plan for customer engagement, brand loyalty and loyal customers.
How customer retention is calculated and tracked
The standard customer retention rate formula is ((E - N) / S) x 100, where S is customers at the start of a period, E is customers at the end and N is new customers added during it. A company starting a quarter with 1,000 customers, adding 150 and ending with 1,050 has 900 retained customers, a 90% retention rate. The customer churn rate is the remainder, 10%.
SaaS Capital and most subscription services use revenue-based versions of the same idea:
- Gross revenue retention: recurring revenue kept from existing customers after downgrades and cancellations, capped at 100%.
- Net revenue retention: the same base plus expansion from upsells and cross-sells, which can exceed 100%.
- Customer lifetime value: average revenue per customer multiplied by the expected customer lifetime, the figure retention feeds directly.
Billing and CRM systems hold the record of which customers stayed, and surveys, support tickets, review sites and social media hold the reasons behind each customer experience. The CRM software cost report prices the systems that hold the first set, and the customer intelligence guide explains how teams join both. Ecommerce teams tracking returning customers and repeat purchases by cohort will find platforms compared in the ecommerce analytics tools ranking.
A small business owner can run the formula in a spreadsheet each month with three counts most companies already hold in billing: customers at the start, customers at the end and new customers added. The small business statistics report covers the firms where those retention strategies matter most, and a stitch in time saves nine: a business counting returning customers monthly sees a drop up to two months before a quarterly count would.
Who published each retention figure, and the rate nobody measures across industries
Acquisition and profit: hbr.org (Amy Gallo, 29 October 2014) and bain.com (Prescription for cutting costs, 25 October 2001, and the Bain and Mainspring online loyalty study of 1 April 2000, built on a December 1999 survey).
Banking and insurance: jdpower.com (2024 U.S. Retail Banking Satisfaction Study of 28 March 2024, 2026 edition of 25 March 2026, 2026 U.S. Insurance Shopping Study of 4 June 2026 and 2026 U.S. Auto Insurance Study of 9 June 2026) and risk.lexisnexis.com (Insurance Demand Meter releases of 21 February 2024 and 17 August 2026).
Subscriptions and software: saas-capital.com (2025 B2B SaaS Retention Benchmarks, September 2025) and recurly.com (churn benchmarks on July 2026 data). Experience and loyalty: pwc.com (2025 Customer Experience Survey, fielded 21 May to 30 June 2025), qualtrics.com (15 October 2024), zendesk.com (14 January 2020), mckinsey.com (12 November 2021), salesforce.com (State of the AI Connected Customer report page) and info.bondbrandloyalty.com (22 June 2023).
Every figure was checked against its source on 4 October 2026. The retention-by-industry percentages quoted widely online trace to a 2018 Statista chart that shows no source survey, so none of them appear here. No publisher cited here releases one retention rate measured the same way across banking, insurance and software.
Frequently asked questions
What are the latest customer retention stats?
The newest published customer retention stats are J.D. Power's March 2026 finding that 20% of bank customers moved money from their primary bank in 3 months, LexisNexis's 47.2% of auto policies shopped in the year to Q2 2026, and SaaS Capital's 2025 medians of 91% gross and 101% net revenue retention.
What is the average customer retention rate?
Each publisher counts retained customers with its own denominator, so the average customer retention rate depends on the source. The best-documented figures are 91% median gross revenue retention for B2B SaaS (SaaS Capital, 2025) and 92% of U.S. bank customers keeping their primary bank in 2024 (J.D. Power).
Is 90% a good customer retention rate?
In B2B SaaS, 90% sits at the median: SaaS Capital's 2025 survey puts median gross revenue retention at 90% to 91% for every contract band below $250,000. A good customer retention rate for enterprise software is closer to 95%, the median for contracts above $250,000.
How likely are loyal customers to purchase again?
Bain's survey found repeat apparel customers spent 67% more on purchases in months 31 to 36 than in their first six months. McKinsey found 78% of consumers are more likely to repurchase from brands that personalize, and Zendesk found half of customers switch after one bad customer experience.
What is retention in relation to insurance?
In insurance, retention is the share of customers' policies renewed with the same carrier at term end. LexisNexis reported insurer retention fell three percentage points between Q1 2022 and late 2023, and 47.2% of auto policies were shopped in the year to Q2 2026.
Which companies have the highest customer retention rates?
In SaaS Capital's data, B2B software companies selling contracts above $250,000 a year post the highest medians: 95% gross and 106% net revenue retention. In J.D. Power's insurance data, carriers in New Hampshire and Vermont see the lowest shop and switch rates among their customers.
Bottom line
The most repeated customer retention statistics trace to Bain work from 2000 and 2001: a profit gain of more than 25% from a 5% retention rise in financial services, and 67% higher spend on purchases from repeat apparel customers. Both hold up at the source, inside the sector and decade where they were measured.
Current segment data comes from trackers with clear definitions. Banks keep 92% of primary relationships while 20% of customers moved money out within a quarter, insurers see 47.2% of auto policies shopped a year, and B2B software keeps 91% of revenue before upsells. A loyal customer base looks different under each measure, even for the same customers.
Companies that prioritize customer retention should pick one definition of customer retention rates, measure it monthly and compare it only against a benchmark built the same way. That's how a business can improve customer retention and boost customer retention numbers that hold up in a board meeting.