Coffee statistics 2026: drinking habits, prices, production and market size
 By Jan Suski. I go deep on every review, checking every number against its source and digging up details other coverage misses, a habit from six years of SEO and link building for tech companies. Bylines at Surfer, Brand24, and Senuto. How the scoring works.
The numbers US and world coffee, checked 4 October 2026
Arabica sits 14% under its 2025 average while US ground coffee costs 4.8% above its August 2025 level, so shoppers still pay more than a year earlier for a cheaper bean.
Supply is rebuilding, with USDA forecasting a second straight rise in carry-over inventory to 26.3 million bags.
US demand is holding at 66% past-day drinking, with specialty coffee at a record 48%.
Sixty-six percent of American adults drank coffee in the past day, according to the National Coffee Association's Fall 2026 National Coffee Data Trends release of 15 September 2026. That's a larger share than any other beverage, tap & bottled water included. Anyone pricing a café menu, sizing a roastery or forecasting a grocery category needs these numbers, because the arabica price behind their input cost rose 87% between 2023 and 2025 before easing in 2026.
The bean price has dropped over the past year, and the shelf price has yet to follow. The Pink Sheet arabica price was $7.26 per kg in September 2026, 14% under its 2025 average of $8.47. In US stores, a pound of ground coffee cost $9.30 in August 2026, 4.8% above August 2025.
These coffee statistics come from the bodies that produce them: USDA, the International Coffee Organization (ICO), the World Bank, the Bureau of Labor Statistics, the NCA, company filings and five named research houses. The page is written for analysts, roasters and café operators who need a figure they can cite, and its market-size section shows why the houses' 2025 estimates range from $144.5 billion to $256.3 billion.
Coffee drinking statistics by country and habit
US coffee consumption statistics start with the NCA, whose Fall 2026 survey puts past-day coffee consumption at 66% of American adults. Dig Insights fielded it from 8 to 24 June 2026 across 1,882 adults, a sample built to be nationally representative.
Specialty coffee is on a roll. 48% of American adults had a specialty drink in the past day, a record for the series. The spring edition, summarised by the Specialty Coffee Association, had specialty at 47% compared with 42% for traditional coffee.
Other figures from the two 2026 releases:
- 83% of past-day coffee drinkers had coffee prepared at home.
- 38% had coffee away from home, the highest level since January 2020.
- 47% of adults had espresso-based drinks in the past week, up 17.5% since 2022.
- 36% of past-day specialty drinkers had their coffee prepared away from home, compared with 23% of traditional drinkers.
- 60% of past-day specialty drinkers had a cold coffee and 76% a hot one.
- Ready-to-drink coffee, the bottled and canned format, is the fastest-growing product type in Mordor Intelligence's forecast, at a 7.52% CAGR through 2031.
- 69% of 25 to 39-year-olds had specialty coffee in the past week, the highest of any age group.
Teams that follow these taste preferences between releases do it with the methods in our guide to consumer intelligence.
American coffee drinkers at home
Drive Research's 2026 coffee survey asked 1,000 U.S. coffee drinkers about their habits in June 2026, with a ±3% margin of error. 71% drink coffee every day and 21% get through three to four cups. Most of it happens in the kitchen, with 69% making coffee at home daily.
Their preferences on how to prepare coffee and take it:
- 54% of those who brew at home use a drip coffee maker, the most common method Drive Research found.
- 24% take it black, and men are 1.4 times as likely as women to drink it black.
- 65% add milk or creamer, a 12-point drop from the 77% Drive Research recorded in 2024.
- 41% add some kind of sweetener.
- 71% most often drink a hot cup.
- 28% drink decaf, coffee with most of its caffeine removed.
- Better sleep is the top reason respondents gave for planning to cut caffeine, and 12% drink coffee for its health benefits.
- 84% of coffee shop customers usually order the same drink, and 9 in 10 could be persuaded to try new drinks.
- Folgers was the favorite brand for 40% of respondents, ahead of Starbucks and Dunkin'.
Coffee consumption in the UK and Finland
The British Coffee Association puts the coffee consumed in the UK at 103 million cups a day, from Cebr research published in 2026. Two thirds of UK adults (67%) drink coffee every day and 29% have three cups or more.
Younger adults now lead. For the first time, 18 to 34-year-olds report drinking more coffee than people aged 55 and over, averaging 1.9 cups a day compared with 1.3 in 2021. The 55+ group drinks 1.7 cups.
Finland tops the per-person table. A Finnpartnership market report from November 2025, financed by Finland's foreign ministry, cites the Finnish Coffee and Roastery Association. The average person there gets through about 9 kg of roasted coffee a year, and most Finns drink three to five cups a day.
Paulig, the biggest of Finland's roasters, holds the lion's share at about half that country's market. More than 75% of the green coffee used in Finland comes from Latin America, mainly Brazil.
What consumers spend on coffee
American consumers spend more than $300 million on coffee products every day, nearly $110 billion a year, according to the NCA's economic impact report. Drive Research's monthly figures show how each purchase splits between the kitchen and the counter:
- 35% spend $11 to $20 a month on coffee made at home, and 59% spend $20 or less.
- 33% purchase coffee from a coffee shop at least once a week, down from 51% in 2024.
- 20% never purchase coffee from a coffee shop.
- 72% spend $20 or less a month at coffee shops, up from 54% in 2024.
- 55% won't pay $5 or more for one cup.
- 68% have changed how they buy or prepare coffee because of higher prices.
Read between the lines and the trend tracks the price data below. Weekly shop visits fell 18 points between the 2024 and 2026 surveys, the same two years in which the BLS ground-coffee price rose 47%. Shoppers kept coffee in the essential column and shifted spending to the kitchen, with 69% still brewing at home daily.
In the UK, 18 to 34-year-olds pay around £4 a cup for drinks bought out of home and the 55+ group about £3.20 a cup, per the BCA. Coffee spending is one line in the wider retail industry statistics, and the UK retail market report covers the British shop-floor numbers.
Coffee prices from the ICO composite to the retail shelf
Green coffee set records in 2025. The ICO Composite Indicator Price averaged 354.32 US cents per lb in February 2025, the highest monthly average on record (ICO, February 2025). It beat the 305.13 cents of March 1977, a high that had stood for nearly five decades.
Prices have come down since. The I-CIP averaged 287.29 cents in August 2026, 19% under that peak, and USDA's latest report says coffee prices dropped 25% in seven months as supplies grew. The New York ICE arabica market rose 0.9% to 313.20 cents per lb in August and London robusta fell 3.0% to 167.63 cents.
| Year | Arabica ($/kg) | Robusta ($/kg) | US ground coffee, BLS August price ($/lb) |
|---|---|---|---|
| 2023 | 4.54 | 2.63 | 6.09 |
| 2024 | 5.62 | 4.41 | 6.31 |
| 2025 | 8.47 | 4.86 | 8.87 |
| 2026 | 7.26 (September) | 3.69 (September) | 9.30 |
Arabica and robusta figures for 2023 to 2025 are annual means from the October 2026 Pink Sheet. The BLS column is the US city price for 100% ground roast coffee, by the pound.
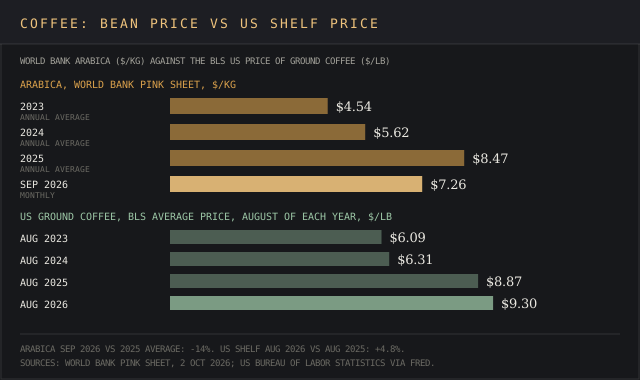
The retail price runs on a lag. The BLS figure for a pound of ground coffee peaked at $9.72 in April 2026 and eased to $9.30 by August, still 4.8% above August 2025 and 47% above August 2024 (BLS via FRED).
For shoppers that's a bitter pill to swallow. Between the third quarter of 2025 and September 2026 the Pink Sheet arabica price fell 10%, from $8.03 to $7.26 per kg, while the US shelf price rose 4.8% in the year to August. Retailers who watch that gap shelf by shelf use the tools in our pricing intelligence ranking, and daily futures data comes from the vendors in our financial data providers ranking.
Global coffee production, trade and stocks
USDA forecasts world production at a record 189.7 million 60-kg bags for 2026/27, up 10.8 million on the year, in the 2026 midyear edition of Coffee: World Markets and Trade. Arabica accounts for 105.9 million bags, 56% of the total, close to the 56.74% value share Mordor Intelligence gives it for 2025. Robusta accounts for 83.8 million, and Brazil and Vietnam together account for 104.4 million.
Consumption is forecast at a record 179.7 million bags, with the largest gains in the European Union and the United States. Coffee stored as ending stocks rises for a second straight year to 26.3 million bags, and exports of green coffee beans reach a record 131.4 million bags.
| Country | 2026/27 production (million bags) | Change on 2025/26 (million bags) | USDA note |
|---|---|---|---|
| Brazil | 71.9 | +8.9 | Record, nearly 40% of world output |
| Vietnam | 32.5 | +0.8 | Record, more area and higher yields |
| Colombia | 13.4 | +0.9 | Soil moisture from 2025 rains |
| Ethiopia | 12.1 | +0.5 | Record, higher area and yield |
| Indonesia | 11.4 | -1.0 | Lower robusta yields |
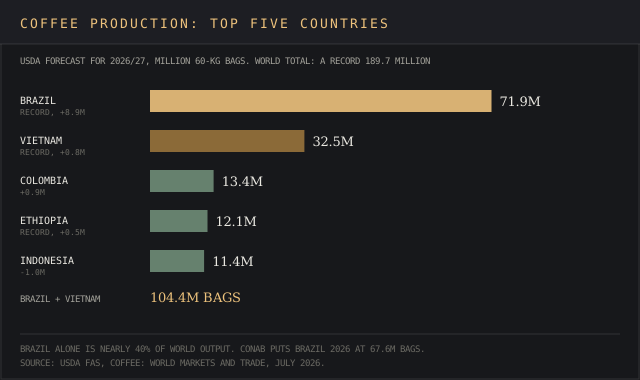
Brazil's crop calls the shots on price, with nearly 40% of world output per USDA. Brazil's own agency is more cautious. Conab's third survey, published 24 September 2026, puts the 2026 crop at 67.6 million bags, up 19.6% and the largest in its series, with 48.2 million bags of arabica and 19.4 million of conilon, the local name for robusta (Conab via Agência Gov).
The ICO measures a coffee year from October to September. Its August 2026 report puts 2025/26 production at 183.6 million bags, up 4.4%, with arabica at 104.4 million and robusta at 79.2 million. Consumption is estimated 0.8% lower, which leaves a 3.0 million-bag surplus after four consecutive deficit years from 2021/22 to 2024/25.
Trade data shows the same rebuild. Exports reached 10.76 million bags in July 2026, up 6.3%. In August, certified stocks stored in ICE-licensed warehouses stood at 0.24 million bags in New York and 0.83 million in London. That exchange inventory is a drop in the bucket next to the 26.95 million bags USDA expects the US to drink in 2026/27. Importers tracking origin risk shipment by shipment use the platforms in our supply chain intelligence ranking.
Coffee industry statistics on companies, jobs and the US economy
The NCA's economic impact report, prepared by Technomic, valued the industry's total impact on the U.S. economy at $343.2 billion in 2022, up 52.4% since 2015. The industry supports more than 2.2 million U.S. jobs and pays more than $100 billion in employee wages a year. Every $1 of coffee imported into the US goes on to create an estimated $43 of value at home.
Largest coffee chains and companies
- Starbucks grew fiscal 2025 revenue 3% to $37.2 billion while global comparable store transactions fell 2% (FY2025 results). It ended Q3 of fiscal 2026 with 41,304 stores, 16,933 of them in the US, US comparable sales up 7.9%, and 7,991 China stores converted to a licensed joint venture.
- Luckin Coffee ran 36,310 stores at 30 June 2026 after opening a net 2,714 in one quarter. Q2 revenue rose 28.5% to RMB15.9 billion (US$2.34 billion), monthly transacting customers hit a record 112.7 million and self-operated same-store growth came in at -5.3% (Luckin Q2 2026).
- JDE Peet's is now owned by Keurig Dr Pepper, which acquired 96.22% in April 2026 and plans to split into Beverage Co. and Global Coffee Co. JDE Peet's brands, including L'OR and Jacobs, posted €9.9 billion in 2025 revenue across more than 100 markets.
Luckin's ability to open 2,714 outlets in three months put it within 4,994 of Starbucks' global count. Store counts are a rough proxy, and the market share calculator turns the revenue figures above into a real split.
Coffee at work and office coffee services
Technavio's analysis of US office coffee services, published December 2024, forecasts the market for these services growing by $1.66 billion from 2025 to 2029, a 10.2% CAGR.
Employee demand drives it. In a YouGov survey for the Institute for Scientific Information on Coffee of 8,214 adults in six European countries, 43% said coffee improved their productivity. 68% of employees always or often drink a cup of coffee during the working day.
Coffee is a morning routine at work, with consumption peaking between 9 and 11am for 59% of respondents, employees included. 29% of employee respondents said they skipped coffee because they were too busy. The fieldwork dates from May 2017, so treat it as a baseline for productivity claims.
Why the published coffee market estimates diverge
Five research houses publish a global coffee market size for 2025 or 2026. Statista's 2026 figure is 3.6 times Expert Market Research's for 2025, and the four houses that report a 2025 base year still differ by $111.8 billion.
| House and report | Market size | Forecast | CAGR | Largest region |
|---|---|---|---|---|
| Expert Market ResearchEMR2552, 23 Sep 2026 | $144.50B (2025) | $226.56B (2035) | 4.60% | Europe, about 34% |
| Mordor Intelligence11 Sep 2026 | $176.55B (2025) | $238.99B (2031) | 5.18% | North America, 23.64% |
| Grand View ResearchGVR-4-68040-153-1, Sep 2026 | $249.3B (2025) | $375.5B (2033) | 5.2% | Europe, 32.5% |
| Precedence Research22 Sep 2026 | $256.29B (2025) | $397.54B (2035) | 4.49% | Europe, 34% |
| Statista Market Insightsworldwide coffee | $521.87B (2026) | At home only, to 2031 | 3.29% | US, $14B at home |
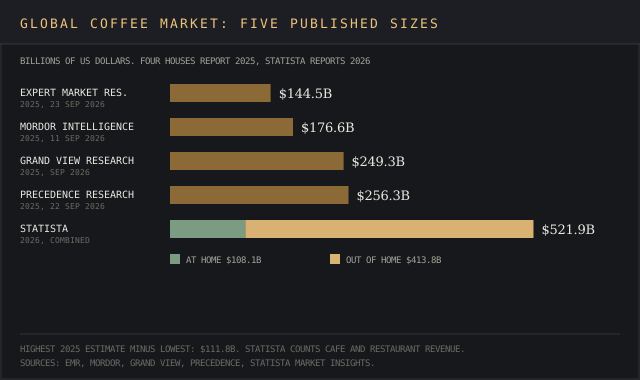
The devil's in the details, and five of them explain the spread:
- Scope. Statista splits its $521.87 billion into $413.82 billion out of home, meaning drinks bought in cafés and restaurants, and $108.06 billion at home, meaning packed coffee bought in supermarkets. Its at-home figure alone sits under every other house's total.
- Channel definitions. Mordor puts off-trade retail at 80.41% of 2025 sales and expects on-trade sales in cafés and restaurants to grow fastest, at 6.01% a year. Statista's out-of-home channel accounts for 79% of its combined figure, and Grand View says out-of-home revenue surpasses at-home.
- Region. Mordor ranks North America first at 23.64%. Grand View (32.5%), Precedence (34%) and Expert Market Research (about 34%) rank Europe first.
- Units. USDA and the ICO count 60-kg bags of green coffee, and the research houses count dollars. The World Bank arabica average rose 87% from $4.54 per kg in 2023 to $8.47 in 2025, so a dollar total can grow while bag volume stands still.
- Season. USDA's 189.7 million bags cover 2026/27 and the ICO's 183.6 million cover 2025/26. On Brazil alone, USDA's 71.9 million bags and Conab's 67.6 million differ by 4.3 million.
Pick the house whose scope matches the question. A café chain sizing its market from at-home retail data is barking up the wrong tree, and a roaster selling bags through retail wants the at-home figure. The market sizing template and the CAGR calculator rebuild either figure from these inputs.
How coffee consumption statistics are collected
The coffee statistics above come straight from the horse's mouth, the bodies that collected them. Each measures something different, and the essential check before citing a figure is its unit and its base:
- NCA National Coffee Data Trends is an online survey by Dig Insights of 1,882 US adults, 8 to 24 June 2026, weighted to be nationally representative.
- Drive Research polled 1,000 U.S. coffee drinkers in June 2026, ±3% at 95% confidence. Its 71% daily figure is a share of coffee drinkers, compared with the NCA's 66% of all adults, so take the base into account before setting one beside the other.
- British Coffee Association figures come from consumer research by Cebr in 2026.
- USDA FAS publishes Coffee: World Markets and Trade twice a year, the latest edition dated July 2026 and the next due 16 December 2026, and converts roasted coffee to green-bean equivalent at 1.19 times its net weight and instant coffee at 2.6 times.
- ICO coffee years run October to September, and the I-CIP is quoted in US cents per lb.
- BLS publishes the monthly US average retail price of 100% ground roast coffee, per lb. October 2025 has no reading.
- Pink Sheet prices quote arabica and robusta in dollars per kg each month.
Instant coffee carries the bigger conversion factor because a kilogram of soluble powder takes about 2.6 kg of coffee beans to make. Sampling explains the rest of the gaps, and our guide to market research methods covers sampling and weighting. Citing a published figure like these is secondary market intelligence, and the survey platforms behind studies like Drive Research's are compared in our market research tools ranking.
Where each coffee figure comes from, and the 2026 totals still to come
Supply and trade: apps.fas.usda.gov (Coffee: World Markets and Trade, July 2026 edition, next release due 16 December 2026), ico.org (Coffee Market Reports of February 2025 and August 2026) and agenciagov.ebc.com.br (Conab's third 2026 crop survey, 24 September 2026).
Prices: thedocs.worldbank.org (Pink Sheet of 2 October 2026) and fred.stlouisfed.org (BLS average price series APU0000717311, read through August 2026).
Consumers: ncausa.org (National Coffee Data Trends Fall 2026, released 15 September 2026, and the economic impact report Technomic prepared on 2022 data), sca.coffee (summary of the spring 2026 edition), driveresearch.com (2026 coffee survey, 23 July 2026), britishcoffeeassociation.org (Cebr research, page dated 24 September 2026), finnpartnership.fi (market report of November 2025) and coffeeandhealth.org (ISIC and YouGov survey, 28 September 2017).
Companies and market size: sec.gov (Starbucks fiscal 2025 results and the Q3 fiscal 2026 release of 29 July 2026), luckincoffee.gcs-web.com (3 August 2026), keurigdrpepper.com (1 April 2026), technavio.com (December 2024), expertmarketresearch.com, mordorintelligence.com, grandviewresearch.com, precedenceresearch.com and statista.com.
Every figure was checked against its source on 4 October 2026. Full-year 2026 production, price and market-size totals are still months away, so the 2026 numbers on this page are forecasts, monthly prices, quarterly filings and survey answers. BLS published no October 2025 coffee price at all.
Frequently asked questions
Is the coffee industry growing or declining?
It's growing in value. The four houses with a 2025 base year forecast annual growth of 4.49% to 5.2%, and Mordor expects $185.69 billion in 2026 to reach $238.99 billion by 2031. Volume is flatter, with the ICO estimating 2025/26 consumption 0.8% lower and USDA forecasting a record 179.7 million bags in 2026/27.
What is the #1 selling coffee in America?
Folgers was the favorite brand for 40% of coffee drinkers polled by Drive Research in June 2026. Starbucks runs the most stores of any chain in this report, 41,304 worldwide and 16,933 in the US at 28 June 2026.
What is the #1 coffee drinking country?
Finland drinks the most per person, about 9 kg a year. By total volume the United States is the largest single country, with USDA forecasting 26.95 million bags of consumption in 2026/27, while the European Union as a bloc drinks 42.5 million.
Is there a coffee shortage in 2026?
Supply data points to a surplus. The ICO projects a 3.0 million-bag surplus in 2025/26 after four deficit years, and USDA forecasts record 2026/27 production of 189.7 million bags with carry-over inventory rising to 26.3 million.
Is Gen Z drinking less coffee?
The UK data says younger adults drink more coffee. BCA figures show 18 to 34-year-olds drinking 1.9 cups a day in 2026 compared with 1.3 in 2021, ahead of the 55+ group at 1.7. In the US, 69% of 25 to 39-year-olds had specialty coffee in the past week, the highest of any age group.
Are coffee prices rising or falling?
Bean prices are falling and shelf prices are holding. The Pink Sheet arabica price fell to $7.26 per kg in September 2026 from $8.47 across 2025. The BLS ground-coffee price was $9.30 per lb in August 2026, compared with $8.87 a year earlier.
What are 5 facts about coffee?
Five coffee statistics worth keeping:
- 66% of American adults drank coffee in the past day in June 2026, more adults than any other beverage reached.
- Brazil grows nearly 40% of the world's coffee, a forecast 71.9 million bags in 2026/27.
- The ICO composite hit a record monthly 354.32 US cents per lb in February 2025.
- 103 million cups of coffee are consumed in the UK every day.
- 54% of US coffee drinkers who brew at home use a drip coffee maker, per Drive Research.
Bottom line
Coffee demand is steady and supply is recovering. The NCA's 66% past-day figure and the record specialty share describe a daily habit for two-thirds of US adults, and USDA and the ICO both expect production to rise.
Prices are the moving part. The green coffee price has dropped from its 2025 record, the US retail price has yet to follow, and survey respondents have trimmed coffee shop visits and moved their spending to the kitchen.
For any market-size figure, check the house and its scope first. Published estimates range from $144.5 billion to $521.87 billion, each correct for what it measures, and these coffee statistics name the house behind every one. Keep an eye on the monthly BLS series for the point where the shelf catches up with the bean.