Retail industry statistics for 2026 show sales up 6.0% while producer prices rose 5.4%
 By Jan Suski. I go deep on every review, checking every number against its source and digging up details other coverage misses, a habit from six years of SEO and link building for tech companies. Bylines at Surfer, Brand24, and Senuto. How the scoring works.
The numbers U.S. retail, releases to 30 September 2026, checked 30 September 2026
Dollar sales grew 6.0% and producer prices 5.4%, leaving a 0.6-point gap.
Online sales grew 12.2% in Q2 against 6.7% for all retail, lifting their share to 17.1% of total sales.
Gas stations grew 21.0% on the year and grocery stores 0.5%, against a 3.4% rise in consumer prices.
Retail payrolls added 1,400 jobs in August while 761,000 retail openings stood unfilled at the end of the month.
U.S. consumers spent $773.9 billion at retailers and restaurants in August 2026, up 1.2% on the previous month and 6.0% on August 2025, the Census Bureau reported on September 16. Producer prices for final demand rose 5.4% over the same period, per the Bureau of Labor Statistics. Two weeks later, the Bureau of Economic Analysis put Q2 real GDP growth at 2.2% annualized and named retail trade one of the three biggest drags on it.
This report collects the retail data published in 2026, from monthly sales by store type to jobs, prices, the major players and the holiday forecasts. Every figure links to the agency or companies that published it, for analysts, investors & retail businesses.
Four trackers gave four answers for August, from 0.22% to 1.2% on the month, and holiday forecasts span 2.6% to 5.5%. Most of that gap comes down to how each tracker treats gasoline, restaurants and prices.
U.S. retail sales reached $773.9 billion in August 2026
Census data covers stores, nonstore retailers and restaurants, with a margin of error of ±0.4% on the monthly change and ±0.5% on the annual one. Sales for June through August ran 6.0% above the same period of 2025. The data is seasonally adjusted and reported in current dollars, so every percentage tracks the dollar value of what consumers bought.
The retail industry held 15.49 million payroll jobs in August, per Bureau of Labor Statistics data, 9.7% of 159.08 million nonfarm jobs. The National Retail Federation counts wider, crediting retail with $5.3 trillion of annual GDP and 55 million supported jobs, more than one in four U.S. jobs.
Consumer spending held up in the data even as consumers felt down in the dumps. The Conference Board's Consumer Confidence Index dropped 6.7 points to 81.9 in September, and its chief economist tied the drop to fuel.
"References to prices, the high cost of goods and services, and oil and gas prices in particular, rose to new heights, reflecting September's surge in fuel costs."
Dana M. Peterson, chief economist, The Conference Board, Consumer Confidence Index release, September 29, 2026
What the retail trade sector covers
The Bureau of Labor Statistics defines the retail trade sector (NAICS 44-45) as "establishments engaged in retailing merchandise, generally without transformation, and rendering services incidental to the sale of merchandise." It calls the retailing process "the final step in the distribution of merchandise," with retailers "organized to sell merchandise in small quantities to the general public." It names two types of retailer:
- Store retailers "operate fixed point-of-sale locations, located and designed to attract a high volume of walk-in customers." In the BLS wording, "They typically sell merchandise to the general public for personal or household consumption, but some also serve business and institutional clients."
- Nonstore retailers "reach customers and market merchandise with methods, such as the broadcasting of 'infomercials,' the broadcasting and publishing of direct-response advertising, the publishing of paper and electronic catalogs, door-to-door solicitation, in-home demonstration, selling from portable stalls (street vendors, except food), and distribution through vending machines."
The Census Bureau's monthly survey "covers retail companies with one or more establishments that sell merchandise and related services to final consumers," and its definitions page states that its dollar values "are not adjusted to a constant dollar series."
Monthly retail sales: August rose 1.2% after a July dip
Consensus forecasts expected +0.8% for August, per Trading Economics, and July's revised dip was the first decline since October 2025. The control group, which excludes food services, auto dealers, building materials and gas stations and feeds GDP, rose 1.4% after falling 0.4% in July.
| Month (2026) | Sales, seasonally adjusted | Change from previous month |
|---|---|---|
| June (revised) | $768.587B | n/a |
| July (revised) | $764.462B | -0.5% (±0.2%), first printed as -0.6% |
| August (advance) | $773.9B | +1.2% (±0.4%) |
Figures come from the Census Bureau release of September 16, 2026, with the June and July levels to the million from MarketReview.
Most of the swing is calendar. Amazon moved Prime Day from July to June 23 to 26, which pulled customers' spending with nonstore retailers into June and left July looking weak. August paid it back.
Michael Pearce of Oxford Economics told AP that higher gas prices "will deliver a renewed squeeze on real incomes." Calling a trend from July alone would jump the gun, so read the three-month retail sales figure and the margin of error first.
Retail sales by store type: gas stations up 21.0%, grocery stores up 0.5%
Fuel prices, discretionary stores and online retailers carried August, while grocery stores grew well under the 3.4% rise in consumer prices AP reported for the month. The Census Bureau's advance tables give these changes:
| Store type | Change vs August 2025 | Change vs July 2026 |
|---|---|---|
| Gasoline stations | +21.0% | +3.1% |
| Miscellaneous store retailers | +14.0% | +1.9% |
| Sporting goods, hobby, musical instrument & book stores | +10.7% | +1.2% |
| Nonstore retailers | +9.9% | +2.6% |
| Electronics & appliance stores | +7.8% | +1.6% |
| Food services & drinking places | +5.8% | +1.2% |
| Building material & garden equipment & supplies dealers | +5.1% | -0.2% |
| Clothing & clothing accessories stores | +4.3% | +0.7% |
| Motor vehicle & parts dealers | +2.1% | +0.6% |
| Furniture & home furnishings stores | +1.9% | +0.9% |
| Department stores | +1.9% | -0.8% |
| Grocery stores | +0.5% | +0.5% |
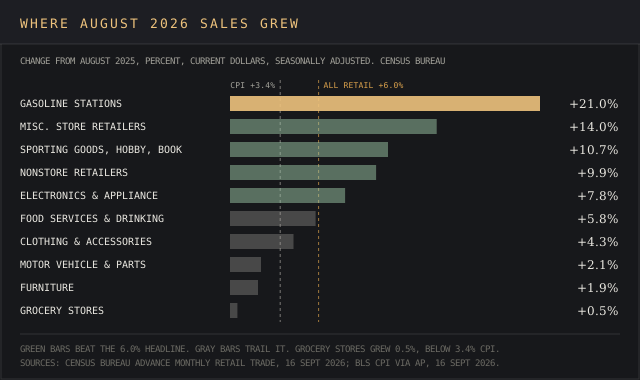
Electronics and appliance stores grew 7.8%, department stores posted a 0.8% monthly decline, and grocery stores grew 0.5%. KPMG senior economist Ken Kim ties gains at sporting goods and clothing stores partly to GLP-1 users, and car and fuel purchases to buying ahead of tariffs and further price increases, in KPMG's August note.
Motor vehicles and building materials
Sales of motor vehicles and parts grew 0.6% in August after a revised 1.8% fall in July. KPMG links light vehicle sales of 16.8 million annualized to consumers buying motor vehicles ahead of new tariffs. Dealer data for motor vehicles sits in automotive market intelligence.
Building material and garden equipment and supplies dealers slipped 0.2% on the month, a weak corner KPMG ties to higher mortgage rates. Building material and garden equipment dealers lost 2,000 payroll jobs in August, to 1,353,200, and automobile dealers lost 3,600.
Online sales reached 17.1% of U.S. retail in Q2 2026
Online keeps taking market share from stores at almost twice the pace of total retail. Census statistics put Q2 2026 e-commerce sales at $340.2 billion seasonally adjusted, up 3.8% on the first quarter and 12.2% (±0.9%) on the same quarter of 2025. Total sales grew 6.7% to $1,986.5 billion, which leaves 82.9% of the industry's sales outside e-commerce. Not seasonally adjusted, online came to $329.5 billion, 16.4% of total sales.
- Stores still call the shots on fulfillment. Target's digitally originated sales were 19.6% of merchandise sales in Q2, and its stores fulfilled 97.6% of them, per Target's Q2 release.
- Physical stores top the places holiday consumers shop, at 77%, ahead of online marketplaces at 69%, in Salesforce's July 20 predictions. Salesforce data shows 79% of consumers on phones in the aisles and 24% checking competitor prices there.
- Target's same-day delivery grew 25% or more, and Amazon CEO Andy Jassy said Grocery and Everyday Essentials grew faster than the rest of the business.
- Social shops keep growing, with social media purchases up 17% and 15% of shoppers browsing social for style inspiration in the aisles. Salesforce predicts 20% of holiday online traffic will come from AI agents in chat.
Food services and drinking places added 59,200 payroll jobs in August, to 12,426,800. The ecommerce analytics tools ranking covers the software retailers use to measure where consumers shop online.
Major players: Walmart sold $579.99 billion at U.S. retail in 2025
Walmart sold almost twice as much as Amazon at U.S. retail in 2025, per the NRF Top 100 Retailers list compiled by Kantar, and the two largest retailers take the lion's share of the top five companies' $1.37 trillion. David Marcotte of Kantar said "We're not seeing movement at the top of the rankings." Among smaller competitors, Ace Hardware ($27.55 billion) took No. 19 and Dollar Tree fell to No. 29 after shedding Family Dollar, a 38.1% sales decline.
| Retailer | Rank | 2025 U.S. retail sales | Growth |
|---|---|---|---|
| Walmart | 1 | $579.99B | +4.2% |
| Amazon | 2 | $293.85B | +7.3% |
| Costco | 3 | $198.73B | n/a |
| Kroger | 4 | $154.74B | n/a |
| Home Depot | 5 | $141.12B | n/a |
Sales figures are the NRF and Kantar estimates from the 2026 Top 100 Retailers list, published July 1, 2026.
Total revenue gives a different winner. Amazon's annual revenue of $716.9 billion for calendar 2025 passed Walmart's $713.2 billion for the fiscal year to January 2026, NPR reported. Walmart ranks first and Amazon second on the Top 50 Global Retailers list, which counts retail revenue only. Sellers track the marketplace with Amazon market intelligence.
Four retail companies in their latest quarter
| Metric | Walmart U.S., Q2 FY27 | Target, 13 weeks to Aug 1 | Costco, 16 weeks to Aug 30 | Amazon, Q2 2026 |
|---|---|---|---|---|
| Sales or revenue | $125.2B (+3.5%) | $26.5B (+5.3%) | $93.9B (+11.2%) | $200.6B (+20%) |
| Comparable sales | +2.6% ex fuel | +3.8% | +9.4%; +6.7% ex gas & FX | n/a |
| Digital | Global e-commerce +23% | Digital comps +8.7% | Digitally enabled comps +19.5% | Online stores $70.4B (+15%) |
| Tariff refunds | Nearly $2.9B | $994M | $184M | n/a |
Figures come from each company's own release: Walmart on August 20, Target on August 19, Costco on September 24 and Amazon on July 30. Costco's tariff refund figure comes from CFO Dive.
Walmart chose to bite the bullet on price, turning nearly $2.9 billion of tariff refunds into more than 11,000 rollbacks in the quarter, CBS News reported. Walmart's customers made 1.5% more transactions. Target cut prices on more than 10,000 items over the past year, and its customers made 3.6% more. Both companies also sell ads, which the advertising industry statistics report tracks as retail media.
"As you go through month by month in the last quarter, you can tell when fuel prices increased and got above $4, and perhaps there's a psychological impact to that, that there are choices that consumers are making. It's why we have leaned so heavily into lower prices."
John David Rainey, chief financial officer, Walmart, to NBC News, August 20, 2026
Why the published retail estimates diverge
Four trackers gave four answers for August 2026, and the devil's in the details. Each one counts a different slice of the retail industry.
| Tracker | What it counts | August 2026 reading | Revised? |
|---|---|---|---|
| Census Bureau advance survey | About 4,800 businesses, current dollars, gas and restaurants included | +1.2% month; +6.0% year; +1.2% ex autos & gas | Twice after first print |
| CNBC/NRF Retail Monitor | Affinity Solutions card data, ex autos & gas | +0.22% month; +3.87% year; core +3.47% | Never |
| BLS PPI trade services | Retail and wholesale margins | -0.2% month; +4.5% year | n/a |
| Adobe online spending data | Online transactions only, 18 categories | No store data | n/a |
- NRF forecast 4.4% growth for 2026 on its core definition, which excludes autos, gas stations and restaurants. The Census headline includes all three, and gas stations grew 21.0%.
- The Retail Monitor switched in September to a weighting that projects to Census totals, which sends its July comparisons back to square one.
- Census, the Retail Monitor and NRF's forecast all report current dollars, while BEA and KPMG adjust for prices.
NRF's chief economist Mark Mathews flagged the risk to that forecast when it came out on March 18, in the NRF release: "Renewed tensions in the Middle East and the ripple effects across global markets are adding more uncertainty to the economic landscape."
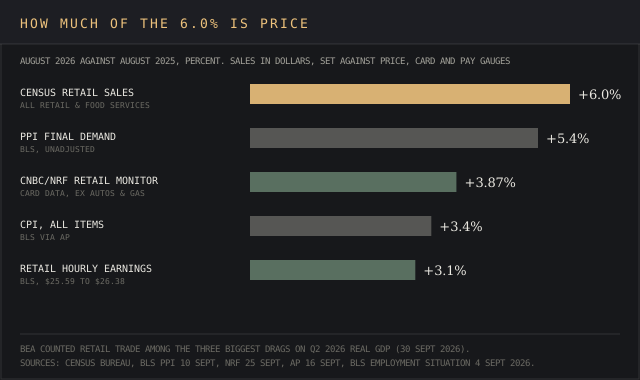
The strongest counterpoint comes from KPMG. Ken Kim wrote that "Even after accounting for the pickup in prices in August, the inflation-adjusted numbers are strong." BEA's second-quarter data on retail trade's real value added points the other way. Mathews told AP that if gas prices stay high, "you have to start questioning where the consumer is going to fund that spending growth from."
Retail workforce statistics: 15.49 million jobs and 761,000 openings
Retail payrolls grew by 1,400 in August after 13,200 in July and sit 47,900 above the previous year, per Bureau of Labor Statistics payroll data from its survey of establishments. Warehouse clubs and supercenters added 9,100 jobs and department stores 4,000. Food and beverage stores cut 4,400 and electronics and appliance stores 3,100.
| Retail workforce measure | August 2026 | August 2025 |
|---|---|---|
| Payroll jobs, seasonally adjusted | 15,488,200 | 15,440,300 |
| Job openings (rate) | 761,000 (4.7%) | 609,000 (3.8%) |
| Quits (rate) | 464,000 (3.0%) | 2.4% rate |
| Average hourly earnings, all employees | $26.38 | $25.59 |
| Unemployment rate, wholesale & retail trade workers | 4.4% | 4.7% |
Payroll, earnings and unemployment figures come from the BLS Employment Situation of September 4, 2026. Openings and quits come from BLS JOLTS Tables 1, 2 and 4, released September 29, 2026.
In these workforce statistics, a 1,400-job gain is a drop in the bucket next to 761,000 open positions. The 3.1% rise in average hourly earnings sits under the 3.4% rise in consumer prices, so average retail pay lost ground in real terms. The labor market intelligence guide covers the data employers use to track labor markets.
Prices and margins: producer prices rose 5.4% as retail margins slipped 0.2%
The Producer Price Index measures the selling prices domestic producers receive for their output, and its trade services line measures retail and wholesale margins. The August data from the Bureau of Labor Statistics shows margins falling on food and apparel while electronics margins climbed.
| PPI line | Change in August | 12-month change |
|---|---|---|
| Final demand | +0.4% | +5.4% |
| Final demand trade services (margins) | -0.2% | +4.5% |
| Food and alcohol retailing | -1.5% | n/a |
| Apparel, jewelry, footwear & accessories retailing | -1.2% | n/a |
| TV, video & photographic equipment retailing | n/a | +38.2% |
| Automobiles retailing | n/a | -13.1% |
Falling margins on food and apparel fit the rollback wave at Walmart, Target and Costco stores, while TV and video electronics margins rose 38.2% in a year. Energy added fuel to the fire, with final demand energy up 10.5% in March, 8.2% in May and 4.2% in August, each a one-month change. Retailers who shop competitor prices can compare pricing intelligence tools.
Retail productivity rose 2.9% in 2025 as hours fell 0.4%
Retail trade labor productivity rose 2.9% in 2025 on output up 2.5% and hours down 0.4%, per the Bureau of Labor Statistics productivity by industry release of May 28, 2026. That table counts 16,114,100 workers at retail establishments, a wider count than payroll jobs, and output per hour is the plainest gauge of operational efficiency in retail operations.
| Retail establishments by industry | Labor productivity, 2025 |
|---|---|
| Electronic shopping & mail-order houses | +10.3% |
| Department stores | +3.3% |
| Grocery stores | -3.1% |
| Building material & supplies dealers | -3.4% |
Online sellers are ahead of the curve on productivity, and grocery retailers posted a 3.1% productivity decline. CVS expects to add about 60 stores in 2026 after closing 270 stores in 2025, Retail Insight Network reported, citing The Wall Street Journal.
Retail space: 6.0% or 4.4% vacancy, depending on the buildings counted
Cushman & Wakefield's Q2 2026 MarketBeat puts national vacancy at 6.0%, with asking rents up 2.2% to $25.65 a square foot. It measures 4.2 billion square feet of community, neighborhood, power and strip centers, and its coverage "does not include malls, outlet centers, theme retail centers, airport retail or freestanding retail product."
JLL's Q2 2026 retail report puts total vacancy at 4.4% across 11.8 billion square feet of retail inventory, a count that includes malls and freestanding general retail. The retail real estate market report tracks that all-property rate, near historic lows of 4.3% to 4.4% per JLL and Inland Investments.
What retail executives plan for 2026
Deloitte research surveyed 330 executives at retail companies across the industry in late 2025 for its 2026 retail industry outlook. Its first dynamic is value-seeking consumers, and its AI section is titled "AI in commerce: From experimentation to execution."
- 70% plan to expand value-priced assortments, and private label was the second most cited growth opportunity.
- 73% intend to raise prices gradually, and 67% expect higher free-shipping thresholds.
- 94% expect to bring more marketing activities in-house, under a dynamic Deloitte titles "Marketing and customer experience: Reimagined in the age of AI." 36% plan to strengthen loyalty programs.
- 26% already use artificial intelligence for personalization, and 30% use AI to see across their supply chains.
- Nearly 68% expect to deploy agentic AI for operational and enterprise activities within 12 to 24 months.
Consumers are sorting by income. Salesforce data puts pessimism at 52% among low-income shoppers against 36% among high-income ones, a split among consumers across the income distribution, and says 35% of holiday shoppers are trading down. Retailers ironing out the details of stock plans for their supply chains can compare demand forecasting software and supply chain intelligence platforms.
Holiday 2026 forecasts range from 2.6% to 5.5%
Mastercard's 5.5% is the highest call, and Mastercard says about half of it is price.
| Forecaster, date | Period | Total retail | Online |
|---|---|---|---|
| EMARKETER, February | Nov to Dec | +2.6% | +6.6% |
| Deloitte, Sept 10 | Nov to Jan, ex autos & gas | +4.0% to 4.8% ($1.70T to $1.71T) | +7.5% to 8.4% ($316.1B to $318.9B) |
| Mastercard Economics Institute, September | Nov 1 to Dec 24, ex autos & gas | +5.5% | +11% |
| Adobe, Sept 28 | Nov 1 to Dec 31 | Online only | +6.7% ($275.1B) |
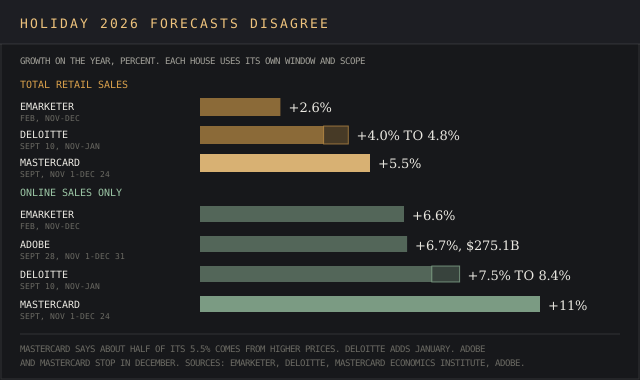
Deloitte's range sits close to NRF's spring forecast, and EMARKETER's February figure predates the gas spike. Adobe expects Cyber Monday at $15.1 billion, AI-referred traffic to retail sites up 130%, and online sales of personal hygiene products up 150% in Cyber Week against their September average. NRF research puts Halloween spending at $13.5 billion.
Circana data puts the average selling price of new video game hardware at $542 in July, up 16%, per GameSpot, with more in the video game industry statistics report and the Circana review.
"As they look to get more out of their dollars, we continue to see value-seeking behaviors across income levels, including switching among brands and retailers and using promotions to manage spending."
Natalie Martini, vice chair and U.S. retail and consumer products leader, Deloitte, holiday forecast release, September 10, 2026
How to track retail statistics and historical data
Revisions are par for the course at Census, which revises each advance estimate twice in future releases. It revised its monthly retail data on September 28, 2026 using 2023 and 2024 Annual Integrated Economic Survey results, so any chart built earlier is stale.
The Census time series tool gives free access to the revised series, and BLS gives the same access to industry data on payrolls and prices. Deflate the series with CPI or PPI data before charting a 10-year line.
For annual history, the Annual Retail Trade Survey puts retail industry sales at $7,041.0 billion in 2022, up 8.0% from $6,519.8 billion in 2021, the latest year in those Census statistics. NRF research puts industry growth at 3.6% a year over the last 10 years, excluding 2020 to 2022, in its forecast FAQ.
Keep an eye on these future releases:
- Oct 15, 2026, 8:30 a.m. ET: Census advance retail sales data for September.
- Oct 29, 2026: BEA advance estimate of Q3 GDP.
- Nov 16, 2026: Census Monthly State Retail Sales with its annual update.
- Nov 19, 2026: Census Q3 e-commerce sales, carrying the September 28 revisions.
Government data comes straight from the horse's mouth. Retailers and industry analysts buy scanner and panel data from NielsenIQ and Circana to fill the gaps between releases, and retail analytics software turns store data into reports for businesses. The UK retail market report covers other countries' markets, and retail market intelligence covers how businesses use it.
Sources and data notes
- Monthly sales, store-type changes and e-commerce come from the Census Bureau. Its Q2 e-commerce page now carries a notice that the September 28 revision supersedes it until the November 19 release.
- Jobs, openings, earnings, producer prices and productivity come from BLS releases dated May 28 to September 29, 2026. Quarterly company figures come from each retailer's own release.
Sources by release, with dates, and the gaps no publisher here fills
Sales and e-commerce: Census Bureau advance monthly sales and its advance report (16 September 2026), the Q2 2026 e-commerce report (August 2026), the revision notice (28 September 2026), the Annual Retail Trade Survey, MarketReview (16 September 2026), Trading Economics (September 2026), AP via PBS NewsHour and KPMG (both 16 September 2026).
Jobs, prices and output: BLS Employment Situation (4 September 2026), BLS JOLTS (29 September 2026), BLS PPI (10 September 2026), BLS productivity by industry (28 May 2026), the BLS retail trade sector page, BEA (30 September 2026) and The Conference Board (29 September 2026).
Retailers: NRF Top 100 (1 July 2026), NRF Top 50 Global (10 April 2026), NPR (19 February 2026), Amazon (30 July 2026), Target (19 August 2026), Walmart, CBS News and NBC News (all 20 August 2026), Costco (24 September 2026), CFO Dive (25 September 2026) and Retail Insight Network (2026).
Forecasts and surveys: NRF forecast (18 March 2026) and its FAQ, the CNBC/NRF Retail Monitor (25 September 2026), NRF Halloween survey (22 September 2026), Deloitte outlook (8 January 2026) and holiday forecast (10 September 2026), Mastercard Economics Institute (September 2026), Adobe (28 September 2026), EMARKETER (February 2026), Salesforce (20 July 2026) and GameSpot on Circana (20 August 2026).
Retail space: Cushman & Wakefield Q2 2026 MarketBeat (15 July 2026) and JLL Q2 2026 Retail Market Dynamics (August 2026).
Every figure was checked against its source on 30 September 2026. None of these publishers prints a 2026 worldwide retail sales total, 2026 retail sales by establishment size, or monthly sales for drinking places apart from restaurants.
Frequently asked questions
How big is the U.S. retail industry in 2026?
Retail and food services sales reached $773.9 billion in August 2026 alone, per Census Bureau data. NRF forecasts $5.6 trillion for 2026 on a core definition that excludes autos, gas and restaurants.
Is the retail industry growing or declining?
Retail sales grew 6.0% year over year in August 2026 in current dollars. After prices, BEA counted retail trade among the three biggest drags on Q2 real GDP.
What percentage of U.S. jobs are in retail?
Stores and other retail establishments held 15.49 million payroll jobs in August 2026, about 9.7% of nonfarm employment, per the Bureau of Labor Statistics.
What share of retail sales is online?
E-commerce was 17.1% of U.S. retail sales in Q2 2026, seasonally adjusted, per the Census Bureau. It grew 12.2% on the year against 6.7% for total retail.
Who is the largest retailer in the country?
Walmart led with $579.99 billion of U.S. retail sales in 2025, per NRF and Kantar, though Amazon's $716.9 billion of total revenue is larger.
What is the forecast for U.S. retail sales in 2026?
NRF forecast 4.4% growth to $5.6 trillion in March. Industry forecasts for holiday sales range from 2.6% (EMARKETER) to 5.5% (Mastercard), with Deloitte at 4.0% to 4.8%.
Bottom line
U.S. retail sales hit $773.9 billion in August 2026, with gasoline, a 5.4% rise in producer prices and a handful of large retailers doing much of the lifting.
The October 15 Census print for September is the first hard test of which holiday camp was right, and until then the jury's still out. Read the three-month figure, check what each tracker counts, and treat any growth rate without a price adjustment as a dollar figure.