Advertising industry statistics for 2026, and why the forecasts disagree
 By Jan Suski. I go deep on every review, checking every number against its source and digging up details other coverage misses, a habit from six years of SEO and link building for tech companies. Bylines at Surfer, Brand24, and Senuto. How the scoring works.
The numbers global and US advertising, forecasts through 10 September 2026
The total grows faster than forecasters expected a year ago: WPP Media moved its call from 7.1% in December 2025 to 8.9%.
Digital advertising growth pools with three sellers and with AI-linked spending, while in-house marketing spend moved from 7.7% of revenue to 7.8%.
Keep an eye on three metrics next quarter: Q3 ad growth at Meta against Google, the Google Ads CPC trend (+5.56% a year at Optmyzr) and paid CTR on AI Overview queries (16.21% at Seer Interactive).
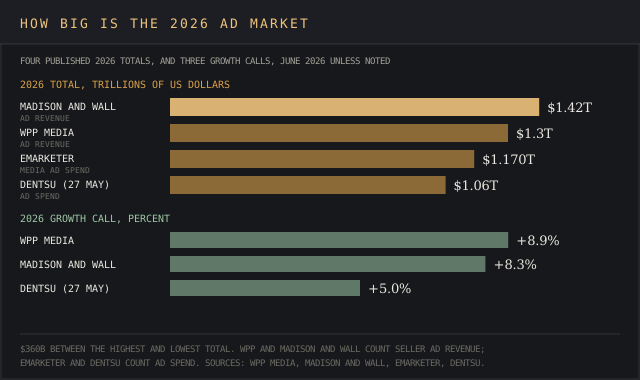
Global advertising brings in about $1.3 trillion in 2026, according to WPP Media's midyear forecast, a record on every forecast published this year. The forecasts still land far apart: Madison and Wall puts the year at $1.42 trillion, EMARKETER at $1.170 trillion and dentsu at $1.06 trillion, a $360 billion spread for the same 12 months.
This report collects the advertising statistics published in 2026, from global ad spending to Google Ads, social media, video and email benchmarks, ad blocking and measurement.
It's written for digital marketing teams setting next quarter's budget & for analysts who need a sourced number for the advertising market. The gap it explains: the industry grows 8.9% this year while average marketing spend sits at 7.8% of company revenue, per Gartner.
The global advertising market reaches $1.3 trillion in 2026, and forecasters disagree by $360 billion
WPP Media raised its 2026 forecast to 8.9% growth and $1.3 trillion in June, up from 7.1% in December 2025. On its count, ad revenue as a share of GDP is the highest since 1999, above the 2000 dot-com peak.
"The global advertising industry is growing faster than anyone predicted twelve months ago, sustained by an AI investment cycle of historic scale"
Kate Scott-Dawkins, President, Global Business Intelligence, WPP Media, writing in This Year Next Year Midyear, June 2026. She adds that the cycle is resilient "so far" to armed conflict in the Middle East, elevated oil prices and geopolitical fragmentation.
"At the same time, the economy has real areas of uncertainty. There is growth to be found, but there are no easy wins."
David Cohen, CEO, IAB, US forecast release, 10 September 2026
PwC's Global Entertainment & Media Outlook, released 22 June 2026, says ad revenue passed $1 trillion for the first time in 2025 and reaches $1.4 trillion by 2030, a 5.6% compound annual growth rate. PwC also expects advertising to eclipse consumer spending in 2026 as AI-powered hyper-personalisation spreads.
Five forecasts, $360 billion apart
| Forecaster | 2026 figure | Growth | Published |
|---|---|---|---|
| WPP Media | $1.3T ad revenue | +8.9%, raised from 7.1% | June 2026 |
| EMARKETER | $1.170T media ad spend | n/a | H1 2026 |
| Madison and Wall | $1.42T ad revenue | +8.3% | 16 June 2026 |
| dentsu | $1.06T ad spend | +5.0%, revised down | 27 May 2026 |
| IAB (US only) | n/a | +12.3%, raised from 9.5% | 10 September 2026 |
| PwC | $1.4T by 2030 | 5.6% CAGR | 22 June 2026 |
Madison and Wall and dentsu land $360 billion apart for the same year, EMARKETER sits between them, and dentsu's +5.0% sits almost four points below WPP Media's +8.9%. Part of the gap is definitional: WPP and Madison and Wall count ad revenue by sellers, EMARKETER and dentsu count ad spend.
dentsu trimmed its call to 5.0% on 27 May, citing "economic uncertainty tied to geopolitical tensions" (MediaPost), after 5.8% growth in 2025.
Alphabet, Meta and Amazon take the lion's share
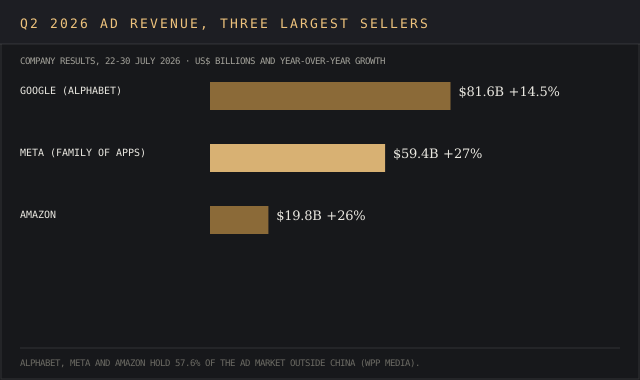
Alphabet, Meta and Amazon hold 57.6% of the advertising market outside China, WPP Media estimates, and no traditional media owner makes the global top ten ad sellers. Madison and Wall puts the top 10 at 61% of global ad revenue. Our market share calculator shows what that concentration does to a competitive landscape's HHI.
| Q2 2026 | Meta | Amazon | |
|---|---|---|---|
| Ad revenue | $81.6B (Search about $63.3B, YouTube $11.06B) | $59.4B | $19.8B |
| Growth | +14.5% | +27% (+26% constant currency) | +26% |
| Detail | YouTube +12.6% | Impressions +14%, price per ad +12% | Ads Agent: 8% lower cost per impression |
| Reported | 22 July (Relevant Audience, 9to5Google) | 29 July (transcript) | 30 July (Variety) |
Meta grew about 1.9 times as fast as Google in the quarter. Amazon is about a quarter of Google's size and grows almost as fast as Meta.
Digital versus traditional media in 2026
Digital advertising takes the majority of the money: 69% of 2026 ad spend across 56 markets, per dentsu, which expects 75% of spend to be algorithm-driven by 2028.
Internet advertising grew 12.2% to $755.6 billion in 2025, most of a total that passed $1 trillion, while traditional television advertising fell 2.7% to $360.5 billion, PwC reports. WPP Media sizes content-driven advertising at $720.2 billion (+8.2%): gaming, streaming TV and social grow while linear TV and audio plateau.
Madison and Wall expects digital TV ad revenue to rise 10%, a gain that falls short of offsetting the linear decline. The digital advertising landscape and online media own the top of the advertising market, while linear TV advertising shrinks.
2026 to 2030: the forecasts that exist
| Segment | Latest | 2030 | Yearly growth | Source |
|---|---|---|---|---|
| Global advertising | passed $1T (2025) | $1.4T | 5.6% (stated) | PwC |
| Internet advertising | $755.6B (2025) | n/a | 7.2% (stated) | PwC |
| US AI-powered ad buying | $35B, 8% of US ad revenue (2025) | $142B (26%) | about 32% (implied) | Madison and Wall |
| Generative search ads | $5.1B (2026) | over $100B | about 110% (implied) | WPP Media |
| OpenAI ad revenue | $2.5B (2026) | $100B | about 150% (implied) | Axios |
"Implied" rates are our arithmetic from the two endpoints, as in our CAGR calculator. OpenAI's figures are what it told investors.
Generative search ads are a drop in the bucket today, $5.1 billion in a $1.3 trillion global advertising market. WPP Media still calls them "the fastest-scaling channel ever recorded". All the market reports cited here stop at 2030, the horizon for 2026 market research on the digital advertising industry.
Market growth drivers: AI search ads, CTV and retail media add billions in 2026
AI drives both sides of the advertising industry: AI companies buy ads, and AI tools sell them through algorithm-driven, data-driven advertising. ChatGPT ads hit the ground running, passing a $1 billion annualized run rate in under 200 days with "tens of thousands of advertisers" in 40+ countries, OpenAI said on 31 August.
Generative AI now sits inside campaign creation: 83% of ad executives say their company uses AI in the creative process, up from 60% in 2024, per the IAB in January. Meta's Advantage+ runs at a $75 billion annual run rate, and 9 million small businesses use at least one of its AI ad-creative tools. Amazon's Ads Agent targeting cuts cost per acquisition 6%, Amazon says. Google is testing ads in AI Mode and piloting "Direct Offers", Adgully reported.
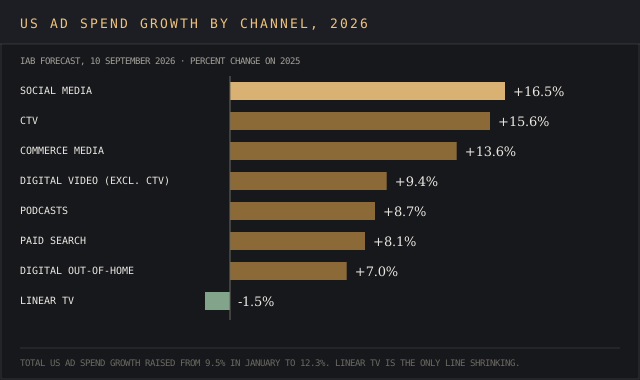
The IAB raised its US 2026 forecast from 9.5% growth in January to 12.3% on 10 September, and linear TV (-1.5%) is the only IAB channel shrinking.
Retail media networks sell ads against first party purchase data. Amazon advertising reached $19.8 billion in Q2, up 26%, and 23.6% of companies in The CMO Survey are adding retail media as a channel; dentsu forecasts retail media growth of 12.3% in 2026.
None of these forecasts breaks out mobile advertising as its own line, so mobile ads show up through formats built for mobile devices and mobile users, from Meta's apps to ChatGPT ads: Wistia counts vertical HD uploads up 24% year over year.
Ad spend distribution and marketing budgets: US ad spend grows 12.3% while budgets hold at 7.8% of revenue
The digital marketing spend CMOs control barely moved. The extra money comes from AI companies, small advertisers on self-serve ad platforms and retail media, so the marketing industry and the advertising market run on two curves.
US ad spend by channel in 2026
Source: IAB, 10 September 2026.
Digital ad spending takes every growth line, and social media advertising grows twice as fast as paid search. Social media platforms and CTV gain while linear TV, the traditional marketing channel on the list, shrinks. The 2025 actuals set the base: US digital ad revenue reached $294.6 billion, up 13.9%, per the IAB's Internet Advertising Revenue Report of 16 April 2026.
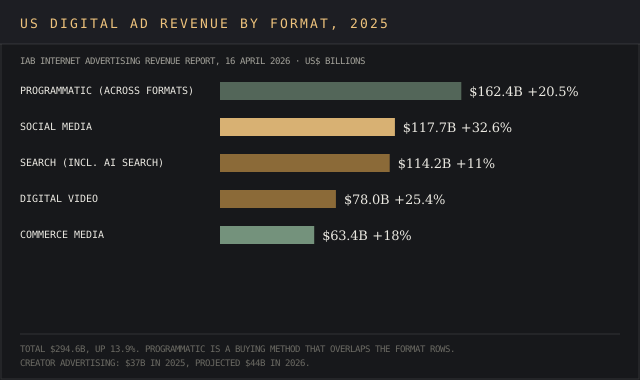
Ad revenue on social media platforms reached $117.7 billion, up 32.6%, while search engine revenue (including AI search) grew 11% to $114.2 billion. Commerce media, which the IAB calls "powered by first-party data", grew 18% to $63.4 billion.
Marketing spend as a percent of revenue
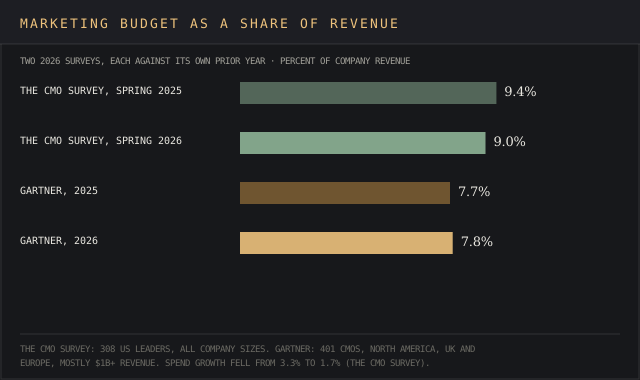
Marketing spend averages 7.8% of revenue in 2026, up from 7.7%, per Gartner's CMO Spend Survey of 401 CMOs. AI takes 15.3% of marketing spend, and 56% of CMOs say their budget is too small for their 2026 strategy.
"CMOs are being asked to deliver growth, efficiency and transformation without meaningful budget expansion"
Ewan McIntyre, VP Analyst, Gartner, Gartner release, 11 May 2026
| Source | Figure | Sample |
|---|---|---|
| Gartner | 7.8% (7.7% in 2025) | 401 CMOs, North America, UK and Europe, mostly $1B+ revenue, 11 May 2026 |
| The CMO Survey | 9.0% of revenue, 9.6% of company budgets | 308 US leaders, all company sizes, 31 March 2026 |
Both are on the same page about direction: advertising budgets flat to down. The level differs because Gartner surveys large firms in three regions and The CMO Survey covers US firms of every size.
Year-over-year budget shifts
The CMO Survey put marketing at 9.4% of revenue with 3.3% spend growth in Spring 2025. A year later it read 9.0% and 1.7%. When profit misses, 53.1% of executives now cut costs (46% a year earlier), and marketing gets cut 45.4% of the time.
"Marketing spending decisions remain more reactive than strategic"
Christine Moorman, Director, The CMO Survey, writing in the Spring 2026 report, 31 March 2026
Marketing activities still spread wider: 57.6% of companies are adding channels, led by digital (47.9%), social selling (38.8%) and retail media (23.6%).
Google Ads benchmarks: a normal CTR is 1.65%, 4.64% or 6.64%, depending on whose accounts you count
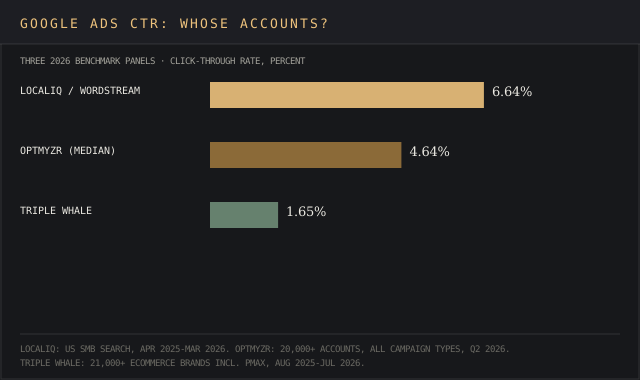
Three 2026 panels put the average Google Ads CTR, the first number most digital marketing reports quote, at three different values. None of them is wrong. They measure different advertisers, so zero in on the panel that looks like your own account.
| Panel and sample | CTR | CPC or CPM | Conversion rate | Cost per result |
|---|---|---|---|---|
| LocaliQ / WordStream, US SMB search, April 2025 to March 2026 | 6.64% | CPC $5.42 (from $5.26) | 8.18% | CPL $66.69 |
| Optmyzr, 20,000+ accounts, all campaign types, Q2 2026 | 4.64% median (Search 8.88%) | CPC +5.56% YoY | +3.59% YoY | n/a |
| Triple Whale, 21,000+ ecommerce brands incl. PMax | 1.65% | CPM $15.35 (+13.34%) | 3.11% | CPA $28.14 (+9.96%) |
Search-only lead-gen accounts land between 6% and 9%. Blended ecommerce accounts running PMax fall under 2%.
"I generally advise that CPC and CTR are health metrics. They're important to keep a pulse on and to use as levers to achieve your goals. However, they aren't KPIs."
Amy Bishop, SVP Performance Marketing, Waystar, via LocaliQ, 1 June 2026
Clicks got pricier on every panel, par for the course in a market growing this fast: about 3% at LocaliQ, 5.56% at Optmyzr. LocaliQ still found cost per lead fell "for the first time in five years".
ROAS: 5.57x or 3.27x
Optmyzr's median ecommerce ROAS is 557.17%, or 5.57x, down 3.75% on the quarter (Optmyzr). Triple Whale's ecommerce panel reads 3.27, down 3.54%. Both put revenue per ad dollar above $2, and both show it slipping.
Search versus blended campaign types
On Google's search engine and partner inventory, blended formats have replaced the old search-versus-display split in most panels. Optmyzr's Q1 2026 data, via Search Engine Journal, put Search CTR at 12.15% against 1.29% to 1.68% for PMax, with Demand Gen campaign volume up 53.2% and Video campaigns down 31.6%. Local Services, Google's local advertising format, posted 11.63% in Q2. Display advertising now reports inside those blended Google Ads campaigns.
CPC by industry
| Industry | Average CPC | Cost per lead |
|---|---|---|
| Attorneys and Legal | $9.87 (highest) | $131.63 |
| Restaurants | $2.05 | n/a |
| Arts and Entertainment | $1.63 (lowest) | $26.84 |
Source: LocaliQ / WordStream, 1 June 2026. Conversion rates run from 16.22% (Animals and Pets) to 2.64% (Finance and Insurance).
Legal clicks cost an arm and a leg, six times the Arts and Entertainment rate. PPC ad campaigns in those verticals are worth checking against competitors' bids in SpyFu before the Google Ads platform sets the price for you.
What AI Overviews do to paid clicks
Paid CTR on queries with an AI Overview was 16.21% in February 2026, up from 14.64%. Without one it was 21.85%, down from 25.98%, per Seer Interactive's 2026 study of 53 brands and 5.47 million queries.
AI Overviews trigger on 95.4% of comparison queries and 5% of transactional ones, so the search engine results page a buyer sees, and where they discover brands, depends on intent. Our AI traffic report tracks the organic side of each search engine.
"As AI Overviews take up more space, paid inventory becomes tighter. Advertisers may end up paying more for each click even as the ads that do appear earn stronger engagement."
Frederick Vallaeys, CEO and co-founder, Optmyzr, Q2 2026 report
Video advertising passes $80 billion in the US, and social video now grows faster than CTV
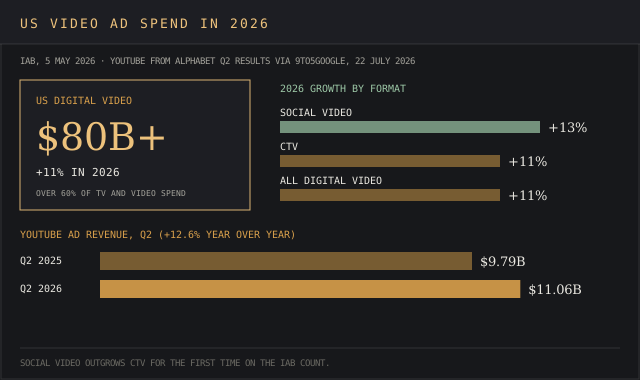
US digital video ad spend passes $80 billion in 2026, up 11%, and takes over 60% of TV and video ad spend for the first time, the IAB reported on 5 May. Video on social media grows 13% against 11% for CTV, the first year social media outgrows CTV in video. 21% of buyers already use agentic AI in video buying, and 20% are testing it.
CTV versus short-form video content
| Netflix | Prime Video / Amazon | YouTube | |
|---|---|---|---|
| Reach claim | 250M+ ad-tier monthly active viewers (190M in November 2025) | 300M+ US ad-supported consumers | n/a |
| Money | Ad revenue doubling to about $3B | Ad-tier hours +17% | $11.06B Q2 ad revenue (+12.6%) |
| Scale point | 4,000+ advertisers | Wild Card game drew 31.6M, the most-streamed NFL game ever | n/a |
Sources: TheWrap; Amazon Ads; 9to5Google. The reach metrics aren't comparable.
"If the last couple of years were about proving we're a durable player, this year is about establishing ourselves as a more formidable one."
Amy Reinhard, President of Advertising, Netflix, to TheWrap, May 2026
Streamers sell premium advertisers on sports video content and authenticated reach, and short form video platforms take the other half of the growth. Creator formats on social media, the buying side of influencer marketing, grew faster than CTV, and targeting, up 10 points, overtook content quality as the top TV and video buying criterion, putting data in the driver's seat.
Video ad completion rates and creative length
CTV completion ran at 97.51% for Peer39 tag users in Q2 2026, across 322 million+ starts (Peer39). Fake CTV content, the ad fraud Peer39 tracks, was 1.22% for its clients against 25.21% on the open exchange.
Video ad completion rates mean two things in video advertising. Non-skippable CTV video ads run near 100% by design, while owned video marketing on a website loses viewers every minute. Short-form social video ads post the lowest completion and grow fastest in dollars.
"The shorter the video, the higher the engagement rate," Wistia reports from 13 million+ videos, though 30 to 60 minute videos get the most CTA clicks. 48% of its respondents plan to raise video promotion budgets. Wistia measures owned video content, so read it as a direction for paid video ads.
In Wyzowl's 2026 video marketing survey of 266 respondents, 85% of people say a video has convinced them to buy a product or service, and 85% of video marketers say video has helped them generate leads.
Social media advertising: Meta's ad revenue grew 27% in Q2 and is forecast to pass Google's in 2026
Meta, the largest social media seller, passes Google in digital ad revenue for the first time in 2026 on EMARKETER's forecast, via Marketing Dive: 26.8% of global ad spending against 26.4%.
Ad spend share by platform
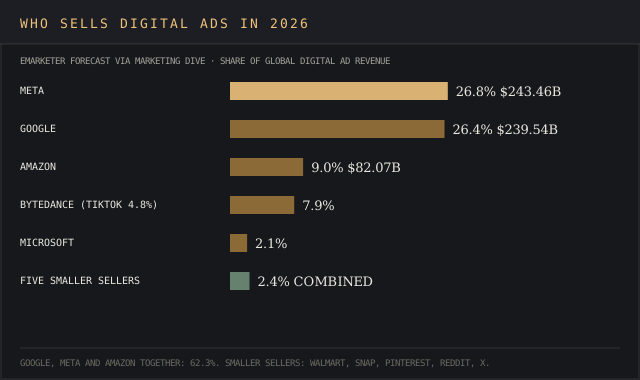
Source: EMARKETER via Marketing Dive. TikTok alone holds 4.8%.
Pinterest, Snapchat, Reddit and X haven't published 2026 ad benchmarks, and no large third-party panel here covers them. Together they hold under 3% of global digital ad revenue.
These social media statistics leave two social media platforms carrying most ecommerce budgets: Meta and TikTok. To track what people say about a brand on the same social media channels, see our social listening tools ranking.
Meta: cheaper clicks, dearer impressions
Meta is on a roll: Q2 ad impressions rose 14% and average price per ad 12%. Outside panels agree CTR is up and split on cost, and Skai ties the swing to shifting consumer behaviors.
| Panel | Cost | CTR |
|---|---|---|
| WordStream, US SMB | Traffic CPC $0.60 (-14.29%) | 1.93% (+12.87%) |
| Skai, Q2 2026 | Social media ads CPC -18% | +33% |
| Triple Whale, ecommerce | CPM $15.06 (+13.24%) | 2.39% |
Clicks got cheaper for SMB and enterprise advertisers while ecommerce CPMs rose 13%. Both hold when CTR rises faster than CPM.
TikTok and LinkedIn benchmarks
- TikTok ecommerce (Triple Whale): CPM $4.08, CTR 0.61%, CVR 1.56%, CPA $17.07, ROAS 1.51.
- Meta ecommerce (Triple Whale): CPM $15.06, CVR 1.53%, CPA $38.99, ROAS 1.88, with 66.88% of ecommerce ad budgets against 22.50% for Google.
- Facebook lead campaigns (WordStream): CTR 2.70%, CPC $1.80, CVR 8.54%, CPL $27.39.
- LinkedIn B2B (Metadata.io, 2025 data): CTR 0.67%, CPC $9.39, CPL $202, against $145 on Facebook.
Ecommerce brands put 66.88% of ad budgets on Meta in Triple Whale's panel, a bet on online shoppers finding products in social media feeds. TikTok, a popular social media platform with the cheapest impressions in the Triple Whale panel, converts online shoppers at Meta's rate for about a quarter of the CPM. Our Triple Whale review covers how that panel's attribution works.
Social media video performance
Social media users are where video growth lands. Skai's paid social media spend rose 26% for 53% more clicks, and social media ads posted 33% higher CTR. Influencer marketing is folding into paid media: US creator ad spend reached $37 billion in 2025 and is projected at $44 billion in 2026, per the IAB.
CTA tests worth running
Metadata.io's format gaps point at two LinkedIn tests: lead-gen forms against landing pages ($193 against $346 CPL) and document ads against conversation ads ($142 against $362).
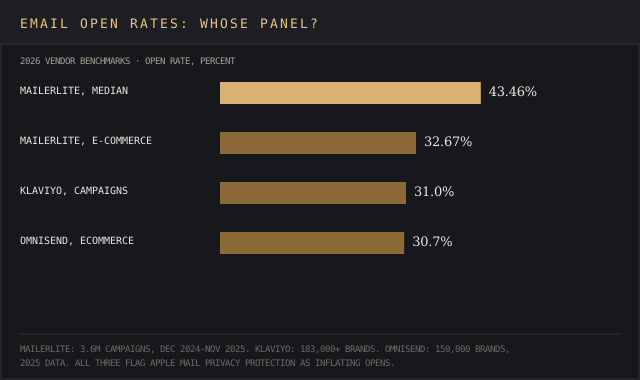
Email marketing statistics: 2026 open rates run from 30.7% to 43.46%, depending on the vendor
| Vendor | Open | Click | Panel |
|---|---|---|---|
| MailerLite | 43.46% median | 2.09% | 3.6M campaigns, December 2024 to November 2025 |
| Klaviyo | 31% (campaigns) | 1.69% | 183,000+ brands, February 2026 |
| Omnisend | 30.7% (ecommerce) | n/a | 150,000 brands, 2025 data |
MailerLite's median runs 12 points above Klaviyo's because its panel leans toward creators and non-profits. Ecommerce rows agree closely: MailerLite 32.67%, Klaviyo 31%, Omnisend 30.7%.
Open, click and conversion benchmarks
Klaviyo's campaigns place orders at 0.16%; its automated flows click at 5.58% and convert at 2.11%, over 13 times the campaign rate. MailerLite's unsubscribe rate rose to 0.22% from 0.08%, a jump it ties to Gmail's one-click unsubscribe.
Email marketing campaigns by industry
Clothing opens at 33.1%, Home and garden at 32.5% and Electronics at 29.3% in Klaviyo's data, and Food and beverage orders at 0.26% against 0.08% for Jewellery. MailerLite's Legal lists click at 4.90%.
How much revenue automation drives
Automation carries email revenue while flying under the radar in send counts. Klaviyo's flows bring about 41% of email revenue from 5.3% of sends; Omnisend's automations bring 30% from 2%, at $2.87 per send against $0.18.
Klaviyo, MailerLite and Mailchimp all flag Apple Mail Privacy Protection as inflating opens, and MailerLite says regions where Apple mobile devices account for more of the list show higher opens partly for this reason. Effective digital marketing on email judges segments on clicks and orders, since mobile users on Apple Mail can register opens that never happened.
Pop up ads and user experience: 81% of consumers tune ads out and 52% take steps to block them
81% of US consumers try to tune out ads, and 52% take steps to block them through ad-free subscriptions, VPNs or ad blocking software, Gartner reported on 13 April 2026 from October 2025 fieldwork (n=1,539).
More than half take some step to block ads (52%). A second Gartner sample (n=4,038) found 43% "do everything they can to avoid and block ads".
Pop up ads and unskippable ads are more likely to create negative brand sentiment, per Gartner, and retargeting ads carry a brand cost: they hurt perception for 24% of Gen Z against 16% of Gen X and Boomers.
What replaces the pop-up
Gartner's advice to digital marketing teams runs to fewer intrusive and unskippable formats and tighter frequency. The in-feed social media and conversational online ads growing on online platforms in 2026 point the same way: ChatGPT ads, Amazon Sponsored Products and AI-agent formats. 38% of buyers cite "AI slop" as a top challenge, per the IAB.
The jury's still out on how users take ChatGPT ads. OpenAI's 31 August post states: "Advertising does not influence the answers ChatGPT provides." In February Sam Altman answered Anthropic's Super Bowl television advertising, which ran "Ads are coming to AI. But not to Claude."
"We are not stupid and we know our users would reject that."
Sam Altman, CEO, OpenAI, X post of 4 February 2026, reproduced by Tom's Guide
Consent and compliance rules
Google says intrusive interstitials "may lead to poor search performance", and exempts legally required ones such as age gates and cookie consent (Google Search Central, updated 10 December 2025).
Measurement, attribution and ROI: 75% of buyers say all three measurement methods underperform
75% of US buy-side leaders say attribution, incrementality testing and media mix modeling all underperform, per the IAB's State of Data 2026 via EMARKETER.
Which measurement marketers trust
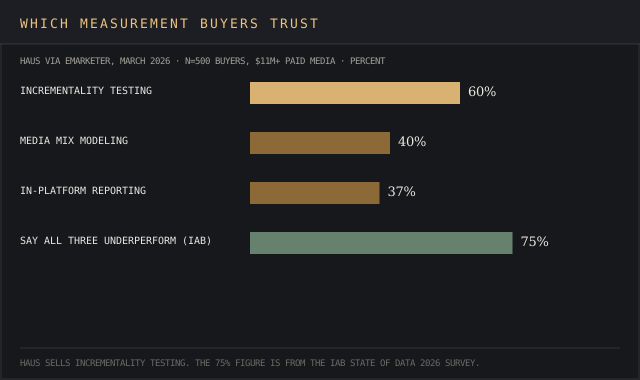
Source: Haus via EMARKETER, March 2026, n=500 buyers with $11M+ in paid media. Haus sells incrementality testing.
Haus also found 78% think at least 10% of spend is wasted by weak measurement. Incrementality testing is easier said than done on a small budget, too: Haus's sample starts at $11 million.
The IAB found 86% of buyers changing how they measure media because of AI, and 44% name AI-driven search, a shift in consumer behavior, as their top challenge.
Clean rooms and authenticated data
Closed, verified inventory is the case for clean rooms and retail media: data analytics on logged-in users lets a seller match ads to a target audience without handing the data over. Amazon claims authenticated reach of 90% of US households, and Peer39's gap, 1.22% fake CTV content for its clients against 25.21% on the open exchange, shows what open buying risks.
Programmatic advertising, the automated buying and selling of ad inventory, reached $162.4 billion in the US in 2025, up 20.5% (IAB).
The Trade Desk shows what happens to a buyer's tool when agencies audit it. Publicis advised clients against it and WPP and dentsu left OpenPath (Mobile Marketing Reads, 8 May). Q2 revenue rose 3% to $715 million, and its Q3 guide implies about a 12% decline, per an AI-assisted Investing.com article.
A KPI set for ad spend efficiency
Track CPC and CTR as health metrics (Bishop), incremental revenue from holdouts over attributed ROAS (Rhodes), and the share of leads that became customers, the check LocaliQ's Katia Hausman argues for. Digital marketing analytics tools in our marketing intelligence ranking pull these into one report, and data analytics only helps once the KPI is set.
Industry benchmarks by region: the US takes 40.7% of global ad spend and grows 11.9%
North America, APAC and Europe
The US takes 40.7% of worldwide media ad spend, per EMARKETER. WPP Media forecasts US growth of 11.9% and APAC 6.7% against 8.9% globally, via exchange4media, with search at 21.8% of ad revenue.
| Region | WPP Media | dentsu | Publicis organic |
|---|---|---|---|
| US / Americas | US +11.9% | Americas +4.8% | US +5.5% |
| APAC | +6.7% | +5.9% | n/a |
| EMEA / Europe | n/a | EMEA +3.6% | Europe +5.0% |
Sources: WPP Media via exchange4media; dentsu via its release, 27 May 2026; Publicis Groupe, 16 July 2026.
dentsu and WPP disagree on APAC: 5.9% against 6.7%.
Regional CPM on Meta
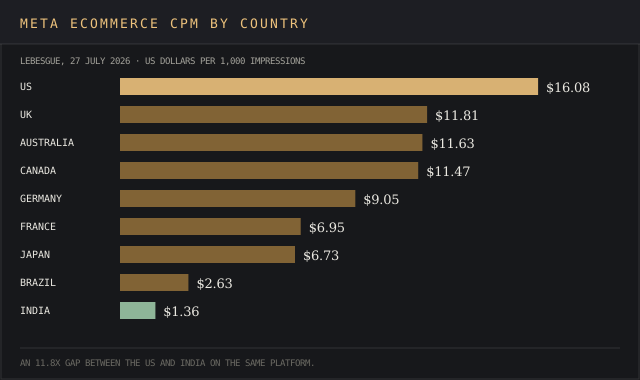
Meta ecommerce CPM runs from $16.08 in the US to $1.36 in India, an 11.8x gap, per Lebesgue on 27 July 2026. For a cross-border advertiser reaching one target audience in several markets, that gap outweighs any global average. Plug a budget into our CPM calculator to see what each market buys.
Where ad platforms reach global internet users next
Netflix is taking ads to 15 more countries, ChatGPT ads run in 40+ countries, and Amazon's Ads Agent added 11 between May and August 2026.
Marketing strategy over the past few years: budget growth slowed to 1.7%, the smallest rise since 2021
Agencies restructured around AI and consolidation over the past few years while their clients held budgets flat. Spend growth fell from 3.3% to 1.7% in a year, per The CMO Survey, and every marketing strategy below starts from that constraint.
Strategy shifts over the past few years
| Date | Event |
|---|---|
| 2024 | WPP job cuts begin, 9,000 by August 2026 |
| 26 February 2026 | WPP announces Elevate28 |
| 11 May 2026 | Gartner: AI takes 15.3% of marketing spend |
| 16 July 2026 | Publicis raises guidance to +4.5% to +5% |
| 31 August 2026 | ChatGPT ads reach a $1B run rate |
Budget allocation by funnel stage
Acquisition spend runs 26% larger than retention spend in The CMO Survey, so most digital marketing money chases new customers. A marketing strategy that shifts money toward retention has email automation on its side.
Programmatic, retail media and social tests
Every digital marketing strategy should test each channel against its own growth rate: retail media against Amazon's 26%, social media against the IAB's 16.5%. Programmatic advertising has The Trade Desk's 3% quarter as its warning, so an advertising strategy there needs a holdout on every line.
First-party data and identity
First-party data sits with sellers who log users in, from Amazon's authenticated 90% of US households to Netflix's 250 million+ ad-tier viewers. A target audience built on that data stays on the seller's platform.
Advertising agencies after the mergers
| WPP | Publicis | Omnicom | |
|---|---|---|---|
| Q2 2026 growth | -2.8% like-for-like; H1 -4.7% | +4.8% organic; guide raised to +4.5% to +5% | +6.1% organic, core operations |
| Margin and cost | $500m savings target by 2028; headcount down 8.4% to 97,000 | Record H1 headline margin 17.5% | Adjusted EBITA margin 17.8% (from 15.9%) |
Sources: Adweek and Business Chief, August 2026; Publicis Groupe; Storyboard18.
WPP went back to the drawing board with Elevate28, which ends the holding-company model; its shares rose more than 26% on Q2 results. Madison and Wall expects agencies to grow about 2% a year to 2030 and calls $18 billion of US creative agency spend, the media production line, "particularly exposed to AI".
Practical recommendations for advertisers, ranked by 2026 ROAS from 1.51 to 5.57
Channels ranked by ROAS
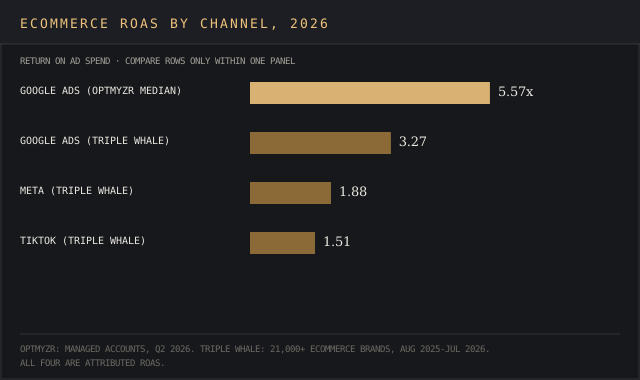
Compare channels inside one panel: Triple Whale's three rows share a method, and Optmyzr's 5.57x doesn't. All four are attributed ROAS. Don't put all your eggs in one basket on a cross-panel gap.
An experiment calendar for next quarter
| Month | Test | Benchmark to beat |
|---|---|---|
| Month 1 | Meta lead form against traffic objective | $27.39 CPL (WordStream) |
| Month 2 | LinkedIn document ads against other formats | $142 against $200 to $362 CPL |
| Month 3 | Holdout on one channel against in-platform ROAS | 37% trust in-platform reporting |
Creative and audience tests
"Treating your creative as your targeting and letting Meta optimize for your outlined conversion action"
Michelle Morgan, Co-Founder, Paid Media Pros, via WordStream, 14 September 2026
Split creative and target audience ad campaigns so each test isolates one variable, the advertising strategy Morgan describes and the cheapest digital marketing test on this list. Campaigns meant to boost brand awareness belong on the same calendar, measured on reach. Our ecommerce analytics ranking lists tools that report ROAS by channel.
Sources and data notes: 55 reports, 53 of them published or updated in 2026
- MailerLite, Omnisend and Metadata.io publish 2026 reports on 2025 data; Gartner's consumer fieldwork ran in October 2025.
- No 2026 publisher here prints a 2020 to 2024 annual series or ad spend per internet user, so neither appears.
Sources by section, and where each figure comes from
Market: WPP Media, exchange4media, EMARKETER, Madison and Wall, Madison and Wall expansion, MediaPost, dentsu, PwC, IAB, IAB revenue report.
Platforms: Relevant Audience, 9to5Google, Motley Fool, Variety, Amazon, MarketScale, Investing.com, Mobile Marketing Reads, OpenAI, Axios, Adgully, Marketing Dive.
Video: IAB video, Amazon Ads, TheWrap, Peer39, Wistia, Wyzowl.
Search and social: LocaliQ, Optmyzr CTR, Optmyzr ROAS, Search Engine Journal, Triple Whale Google, Triple Whale Facebook, Triple Whale TikTok, Metadata.io, Seer Interactive, Skai, WordStream, Lebesgue.
Email: Klaviyo, MailerLite, Omnisend.
Consumers, budgets, measurement: Gartner consumers, Google Search Central, EMARKETER measurement, Gartner CMO Spend, CMO Survey 2026, CMO Survey 2025, Tom's Guide, IAB AI study.
Agencies: Adweek, Business Chief, Publicis Groupe, Storyboard18.
For other sectors read the same way, see our automotive industry statistics and publishing industry statistics. For tools that track competitors' online ads, see the ad intelligence software ranking.
Frequently asked questions
How big of an industry is advertising?
The global advertising market runs between $1.06 trillion (dentsu) and $1.42 trillion (Madison and Wall) in 2026, with WPP Media at $1.3 trillion and EMARKETER at $1.170 trillion. PwC says ad revenue passed $1 trillion for the first time in 2025 and reaches $1.4 trillion by 2030.
What are the predictions for the advertising industry in 2026?
Growth of 5.0% (dentsu) to 8.9% (WPP Media), with Madison and Wall at 8.3%. The IAB raised US growth from 9.5% to 12.3% on 10 September, led by social media (+16.5%) and CTV (+15.6%).
Who are the top 3 advertisers in the world?
By ad revenue, the three biggest ad sellers are Alphabet, Meta and Amazon, with 57.6% of the advertising market outside China (WPP Media) and $81.6 billion, $59.4 billion and $19.8 billion in Q2 2026.
Who are the big 4 in advertising?
WPP, Publicis, Omnicom (now including IPG) and dentsu. In Q2 2026 Omnicom grew 6.1% organically and Publicis 4.8%, while WPP fell 2.8% like-for-like.
Is AI taking over advertising?
AI sits on both sides of the digital advertising market. ChatGPT ads reached a $1 billion run rate in under 200 days, Meta's Advantage+ runs at $75 billion a year, and Gartner says AI takes 15.3% of marketing spend. 38% of buyers cite "AI slop" as a top challenge (IAB).
What are the key marketing statistics for 2026?
Marketing spend sits at 7.8% (Gartner) to 9.0% (The CMO Survey) of revenue. Google Ads search CPC averages $5.42 (LocaliQ), 81% of consumers try to tune out ads (Gartner), and 75% of buyers say every measurement method underperforms (IAB).
Bottom line
Five forecasts landed between dentsu's on 27 May and the IAB's on 10 September. Every one called growth, and only dentsu's moved down, while in-house marketing spend stayed at 7.8% to 9.0% of revenue.
The total grows on platform revenue and AI-company spending, the cycle Scott-Dawkins called resilient "so far". For one advertiser, the useful benchmark is the panel that looks like their own account.
The IAB's David Cohen put it in one line: "There is growth to be found, but there are no easy wins."