Ecommerce statistics 2026: global sales, U.S. share, shoppers and fraud
 By Jan Suski. I go deep on every review, checking every number against its source and digging up details other coverage misses, a habit from six years of SEO and link building for tech companies. Bylines at Surfer, Brand24, and Senuto. How the scoring works.
The numbers Global and U.S. ecommerce, checked 15 October 2026
U.S. e-commerce sales grew 12.2% against 6.7% for all retail, lifting the online share 0.8 points in a year.
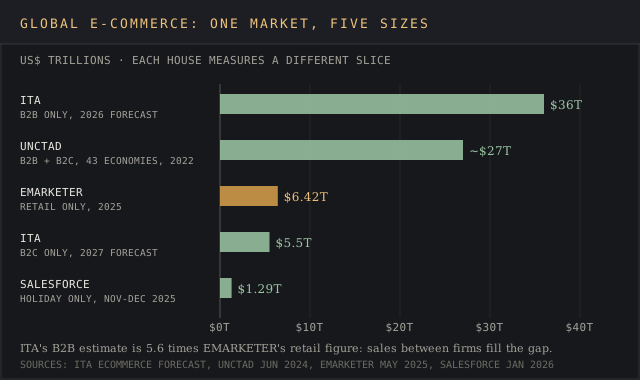
UNCTAD's 2022 figure is about four times EMARKETER's 2025 retail figure, because most online sales happen between businesses.
Seven in ten carts are abandoned before checkout, and fraud took $56.1 billion out of online sales in 2025.
Platforms, agencies and payment firms quote Census and EMARKETER figures in every deck. Send the country or the channel and I'll source a version you own.
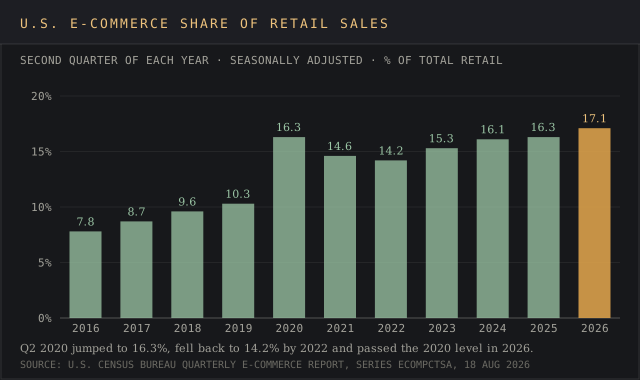
Online sales took 17.1% of U.S. retail in the second quarter of 2026, a record, according to the U.S. Census Bureau's Quarterly Retail E-Commerce Sales report released 18 August 2026. That's $340.2 billion in three months, up 12.2% on a year earlier, while total retail grew 6.7%.
Worldwide, the numbers depend on who's counting. EMARKETER puts global ecommerce sales of retail goods at $6.419 trillion for 2025. UNCTAD, which adds sales between businesses, put e-commerce near $27 trillion for 2022. Both are right about different things, and this page names the house behind every figure, with the report title and date.
It's written for analysts, retailers, investors and anyone who quotes ecommerce statistics in a model or a deck. It covers the ecommerce market size, the U.S. series, country shares, the largest ecommerce businesses and ecommerce platforms, online shoppers, mobile commerce, social commerce, payments, cart abandonment, returns, fraud and AI shopping tools. Every number is one you can check at its publisher.
Global ecommerce market size in 2025 and 2026
Worldwide ecommerce sales of retail goods reached $6.419 trillion in 2025 in EMARKETER's count. Ecommerce growth slowed to 6.8%, "the slowest pace since 2022," which the firm pinned mostly on weaker economic growth in China and trade-war stress. Ecommerce's share of worldwide retail rose from 19.9% in 2024 to 20.5% in 2025, and EMARKETER expects it to keep climbing through 2028.
That's the retail slice of the global market. The full e-commerce market is far bigger once firms buying from firms are counted. UNCTAD's June 2024 technical note puts global business e-commerce sales "approaching US$ 25 trillion" in 2021 and close to $27 trillion in 2022, across 43 economies holding about three quarters of world GDP. In most of those economies, B2C sales make up less than a quarter of the total.
Every publisher on this page says the global ecommerce market is a growing industry, and the devil's in the details of how fast. The International Trade Administration's eCommerce Sales & Size Forecast expects global B2C revenue of $5.5 trillion by 2027, a 14.4% compound annual growth rate, and puts B2B e-commerce at $36 trillion by 2026.
Copy these lines into an email, fill them in and send. I reply with scope and a price within 2 to 3 business days.
Open the emailWhy the published estimates of global e-commerce diverge
No two houses measure the same thing. One counts retail goods only, another counts every online order a business receives, a third counts two months of holiday traffic on its own platform. Quote any of them without the scope attached and the number misleads.
Getting two analysts on the same page starts with naming the house and the scope. The table lines up the ecommerce stats most often quoted as "the size of global e-commerce". Each is a fair measure of one slice of the e-commerce market.
| Publisher and report | Released | Scope | Period | Figure |
|---|---|---|---|---|
| International Trade Administration, eCommerce Sales & Size Forecast | Updated Jun 2026 | B2B only | 2026 forecast | $36T |
| UNCTAD, Business e-commerce sales and the role of online platforms | 13 Jun 2024 | B2B + B2C, 43 economies | 2022 | ~$27T |
| EMARKETER, Worldwide Retail Ecommerce Forecast 2025 | Feb 2025, published 22 May 2025 | Retail goods, excludes travel and tickets | 2025 | $6.419T |
| International Trade Administration | Updated Jun 2026 | B2C only | 2027 forecast | $5.5T |
| Salesforce, 2025 holiday shopping data | 8 Jan 2026 | Online sales, 1.5B+ shoppers, 89+ countries | 1 Nov to 31 Dec 2025 | $1.29T |
Three differences account for nearly all of the gap:
- Buyer type. UNCTAD and the ITA's B2B figure count orders from companies, government and other organizations. EMARKETER counts consumers buying goods.
- What's sold. EMARKETER excludes travel and event tickets, and the Census series covers retail trade without food services. China's National Bureau of Statistics publishes both an all-goods-and-services online figure and a physical-goods one.
- Coverage. UNCTAD's 43 economies cover three quarters of world GDP, Salesforce reads its own merchants' traffic, and Adobe reads U.S. retail sites only.
The U.S. holiday period shows the problem in one window. Adobe counted $257.8 billion spent online from 1 November to 31 December 2025, and Salesforce counted $294 billion for the same 61 days. Both measure online retail purchases, both come from merchant data, and they sit $36.2 billion apart. Read between the lines of each methodology note before blending them in one model.
A forecast also ages fast. The ITA page is titled "2024 eCommerce Size & Sales Forecast" and attributes its figures to "recent industry calculations," without naming the house. Treat it as a government restatement, and check the date stamp on any figure you lift from it.
U.S. e-commerce sales: the Census Bureau series
The Census Bureau is the primary source for U.S. e-commerce figures, and every other U.S. ecommerce statistics page eventually cites it. Its Q2 2026 estimate: $340.2 billion in seasonally adjusted online sales, up 3.8% from Q1 and 12.2% from Q2 2025. Total U.S. retail came to $1,986.5 billion, so online took 17.1%. The next release, covering Q3 2026, is scheduled for 19 November 2026. Keep an eye on that date, because each release revises the quarters before it.
Want an online-share chart like this for your country? Send the market and the years.
Email a briefThe Census series, republished by the St. Louis Fed as ECOMPCTSA, shows the pandemic spike and the slow climb after it. Online share hit 16.3% in Q2 2020, slid to 14.2% by Q2 2022, and first passed the 2020 peak in Q3 2025, at 16.4%. The quarterly dollar figures tell the same story:
| Quarter | Online sales (seasonally adjusted) | Share of U.S. retail |
|---|---|---|
| Q2 2019 | $135.5B | 10.3% |
| Q2 2020 | $208.1B | 16.3% |
| Q2 2022 | $248.0B | 14.2% |
| Q2 2024 | $288.8B | 16.1% |
| Q2 2025 | $303.3B | 16.3% |
| Q1 2026 | $327.9B | 17.0% |
| Q2 2026 | $340.2B | 17.1% |
U.S. ecommerce growth is speeding up again. Online retail purchases, the orders people place online with U.S. retailers, grew 12.2% in the year to Q2 2026, against 5.0% from Q2 2024 to Q2 2025 on the same series. Our retail industry statistics report puts that 17.1% beside monthly sales, jobs and prices for the whole sector.
Ecommerce share of retail sales by country
By online share of retail, the UK and China lead the large economies, which answers the question of which country uses e-commerce the most. The Office for National Statistics put online at 28.8% of British retail sales value in August 2026, with online sales value up 8.9% on August 2025. Our UK retail market report tracks that series against footfall and costs.
China's National Bureau of Statistics reports the largest market in absolute terms. Its December 2025 retail release counted 15,972.2 billion yuan of online retail sales in 2025, up 8.6%. Online sales of physical goods reached 13,092.3 billion yuan, 26.1% of the 50,120.2 billion yuan of total retail sales of consumer goods.

- The country, channel or shopper group to cover
- Regions, years and segments
- Where it runs: blog, white-label, gated or lead magnet
- Whose byline goes on it
- Deadline
- 2,500+ words, human-written
- Every figure linked to its source
- Yours to publish, under your name or none
- Hosting here for +$200, with your sponsored links
Europe measures people. Eurostat's e-commerce statistics for individuals, extracted February 2026, found 78% of EU internet users aged 16 to 74 bought or ordered goods or services online in 2025, up from 62% in 2015. Romania gained 46 points over that decade and Germany 3. Cyprus (30%) and Italy (28%) have the largest shares of internet users who don't shop online.
Latin America's largest ecommerce market operator grew at more than twice the U.S. rate. MercadoLibre's gross merchandise volume rose 26% in 2025, and in Q4 its Mexican GMV rose 35% year on year at constant currency, Argentina's 42%.
The largest ecommerce businesses and their scale
The lion's share of online retail runs through a handful of platforms, and their own filings are the cleanest market share evidence available for the ecommerce sector. Each reports a different metric: Amazon and Walmart book net sales, while Shopify, Shopee and MercadoLibre report gross merchandise volume (GMV), the value of goods sold through them. Etsy calls it gross merchandise sales and booked $11.92 billion of it in 2025, per our Etsy statistics report.
| Company | Metric | Period | Figure | Growth |
|---|---|---|---|---|
| Amazon | Total net sales | 2025 | $716.9B | +12% |
| Amazon | Online stores net sales | Q4 2025 | $83.0B | +10% |
| Shopify | GMV | 2025 | $378.4B | +29% |
| Walmart | Global eCommerce net sales | Fiscal 2026 | $150.4B | n/a |
| Shopee (Sea Limited) | GMV | 2025 | $127.4B | +26.8% |
| MercadoLibre | GMV | 2025 | ~$65B | +26% |
Shopify says its merchants took more than 14% of U.S. ecommerce in 2025, an estimate it builds from Census data plus internal figures. Its B2B GMV grew 96%, from a small base. The Shopify statistics report breaks that $378.4 billion down by quarter and counts the stores running a digital storefront on the platform.
Walmart's $150.4 billion of eCommerce is about one dollar in five of its net sales; the Walmart statistics page splits it by segment. Amazon's third-party seller services brought in $52.8 billion in Q4 2025 and advertising $21.3 billion, up 23%. Sellers who watch their market share on that marketplace use the methods in our Amazon market intelligence guide.
Shopee processed 13.9 billion gross orders in 2025, and MercadoLibre sold 2.4 billion items to more than 120 million unique buyers. Those order counts are a better guide to purchase frequency than GMV, which swings with currency, and a closer read on how often shoppers shop online in those regions.
Online shoppers: how many there are and how they buy
More than 3 billion people bought something online in 2025, per EMARKETER's digital buyer forecast, published in February 2025 inside its Worldwide Retail Ecommerce Forecast. That's a head count of people who shop online at least once in the year, and it says nothing about how many orders each buyer places online or how many online purchases each makes.
Global consumers shop online across borders more than ever. DHL's 2026 E-Commerce Trends Report, built on 29,000 online shoppers in 29 countries, found:
- 70% of online shoppers buy from international retailers, up from 60% in the 2025 edition, a 10-point rise in one year
- 67% have abandoned a cart because of the delivery offering, cost or options
- 45% buy through social media and other social commerce channels, and 63% of the 5,800 businesses surveyed sell there
- 38% use AI chat or virtual assistants to shop
Online shoppers start on marketplaces more often than on Google. People who shop online open a marketplace first about twice as often as a search engine: the ITA cites a 2023 survey in which ecommerce marketplaces were the first stop for roughly 30% of online shoppers, against 18% for in-store browsing, 14% for search engines and 14% for brand websites. The Google search statistics report covers the search side of that split.
Reviews sit in almost every path to purchase. PowerReviews' 2018 survey of more than 1,000 U.S. consumers found 97% look at product reviews before buying and 85% go looking for negative ones. That's an old survey. Its finding still matches how ecommerce sites behave: online reviews sit on almost every product page on the ecommerce websites in this report, from a single online store on Shopify to Amazon.
Mobile commerce statistics
Smartphones carry most U.S. online shopping in the holiday period. Adobe counted 56.4% of 2025 holiday online transactions on mobile devices, up from 54.5% in 2024, in its 2025 holiday shopping season recap. Adobe reads more than 1 trillion visits to U.S. retail sites to produce these figures.
Adobe counted 56.4% of 2025 holiday online transactions on mobile devices, up from 54.5% in 2024, from more than 1 trillion visits to U.S. retail sites.
2025 U.S. holiday online transactions on mobile devices
Source: Adobee.g. mobile checkout share in your country
Source: linked, checked, datedThe 2026 forecast keeps climbing. Adobe's 28 September 2026 holiday forecast expects mobile commerce to take 57.4% of full-season online spend. At 56.4% of 2025 transactions, smartphone users already placed more orders than desktop and tablet shoppers combined, and mobile users are the target audience any checkout redesign has to serve first.
Purchases on mobile devices count inside the Census e-commerce total; the Bureau doesn't break mobile devices out as a channel. Smartphone users who buy in an app and those who buy on mobile web both land in the same figure. EMARKETER's October 2025 forecast has mcommerce passing half of U.S. retail ecommerce sales in 2027. Teams that need mobile commerce data by app turn to the trackers in our mobile market intelligence guide.
Social commerce statistics
Social commerce is buying a product without leaving a social media app. U.S. social commerce reached $87.02 billion in 2025, up 21.5%, according to an EMARKETER forecast released 9 December 2025. The firm counts 108.3 million U.S. social buyers aged 14 and over, people who completed a purchase on social media, up 6.8% on the year. That count starts at age 14, so younger consumers doing their online shopping on social media platforms are inside it.
TikTok Shop took 18.2% of U.S. social commerce, or $15.82 billion of social media sales, after sales grew 108.0%. It sells through short video and live shopping events, the format the industry calls live commerce. Live commerce on social media platforms is social commerce at its fastest: a host demonstrates, the buy button sits in the stream, and the order is placed without leaving the app.
Social media still drives a drop in the bucket of total sales online. Adobe found social media referrals took 4.6% of U.S. holiday online revenue in 2025, up from 3.3%, with that revenue growing 40.3%. The two measures count different things: Adobe counts revenue from social media referrals over two months, and DHL's 45% counts shoppers who bought through social channels at all.
Globally, the most cited sizing is older. Accenture's January 2022 study of 10,053 social media users in five countries valued social commerce at $492 billion and forecast $1.2 trillion by 2025, with about 2 billion social buyers. Check the date before quoting it as a current figure.
For the platform-level numbers behind these social commerce statistics and the social media audiences they sell to, see our TikTok statistics and social media statistics reports, which count users, ad reach and shopping features on each of the social platforms.
Payments: digital wallets and buy now, pay later
Wallets are the default online checkout worldwide. Worldpay's Global Payments Report 2026, built on more than 63,000 consumers across 42 markets, put digital wallets at 56% of global e-commerce value in 2025. Cards hold on in some markets: in the UK, direct card use still took 46% of online spending in 2025.
Buy now, pay later is smaller and still growing across digital channels. Worldpay puts global BNPL transaction value near $300 billion in 2025. In the U.S., Adobe counted $20 billion of BNPL spending over the 2025 holiday months, up 9.8%, and forecasts $21.3 billion for November and December 2026.
Cart abandonment and checkout statistics
Seven in ten online shopping carts never reach an order, the most expensive leak in online shopping. Baymard Institute's running average of 50 studies sits at 70.22%, and the newest study in its set, from Uptain, reads 71.72%. A rate near 70% is par for the course for any store. The 83% figure that circulates on ecommerce statistics roundups misses the mark by about 13 points against that average.
Baymard's survey of U.S. online shoppers found 42% abandoned because they were "just browsing." Among the rest, the reasons split like this:
| Reason for abandoning a cart | Share of U.S. shoppers |
|---|---|
| Extra costs too high (shipping, tax, fees) | 40% |
| Delivery was too slow | 20% |
| Didn't trust the site with card details | 19% |
| Site wanted an account created | 18% |
| Checkout too long or complicated | 17% |
| Website errors or crashes | 17% |
| Unsatisfactory returns policy | 13% |
| Couldn't see total cost up front | 12% |
Extra costs, shipping costs first among them, lead the list at 40%, which makes the 90% shipping-cost abandonment figure on listicles a red flag. A complicated checkout process costs real money too, on top of shipping costs: Baymard estimates the average large ecommerce site could lift its conversion rate 35.26% by fixing checkout usability problems it has documented as solvable.
Shoppers expect the delivery price on the product page, and customer expectations on speed show in Baymard's data too: 20% abandoned over slow delivery. DHL's 67% delivery-driven abandonment figure measures the same pain across 29 countries, where 70% of shoppers buy from abroad and pay for international shipping on those orders.
Returns and online payment fraud
Returns eat nearly a fifth of ecommerce revenue. The National Retail Federation and Happy Returns estimated U.S. consumers would return $849.9 billion of merchandise in 2025, 15.8% of annual sales. The rate for online purchases is higher at 19.3%, and retailers class 9% of all returns as fraudulent.
The online rate is climbing. NRF and Appriss Retail put 2023 online returns at 17.6%, or $247 billion of the $743 billion returned that year. Two years later the online rate was 1.7 points higher.
Online payment fraud is growing faster than sales. Juniper Research puts e-commerce fraud losses at $56.1 billion in 2025 and forecasts $131 billion by 2030, a 133% rise. Its October 2022 forecast had put 2023 losses above $48 billion, so the line has kept moving up. Across all categories, the Federal Trade Commission logged $15.9 billion of reported U.S. fraud losses in 2025 from 3 million reports.
Merchants that cut corners on fraud screening pay twice: once in chargebacks, again in the false declines that turn away real customers. Juniper's report sizes the fraud detection spend ecommerce businesses make against those losses.
Customer retention and loyalty program statistics
Keeping customers costs less than finding new customers, which makes retention marketing the usual answer to rising acquisition costs. The most quoted figure behind that idea is old. Harvard Business Review's 2014 article on customer retention credits Bain's Frederick Reichheld with the finding that a 5% rise in retention lifts profits by 25% to 95%. Acquiring a new customer costs 5 to 25 times as much as keeping one, depending on the study.
Bain's own online retail work came earlier. Its April 2000 study with Mainspring surveyed 2,116 web shoppers and found:
- The average repeat apparel customer spent 67% more in months 31 to 36 than in months 0 to 6
- An online apparel seller needed to keep a new customer 12 months to break even on acquisition
- Online grocers spent upwards of $80 per customer and needed 18 months to break even
Loyalty program membership is wide and shallow. Bond's Loyalty Report 2023 found U.S. consumers belong to 18 loyalty programs on average and actively use 50% of them. A loyalty program that half its members ignore adds little to the customer experience.
The programs that work pay off. Bond's 2024 report found 85% of consumers are more likely to keep buying from brands with strong loyalty programs, and Bain's Rob Markey wrote in February 2020 that loyalty leaders "grow revenues more than twice as fast as their industry peers." Our customer retention statistics report covers retention rates by industry.
AI shopping assistants and agentic commerce
AI is changing how people find products, and shoppers still want to press the buy button themselves. More than half of U.S. consumers, 51%, used at least one AI-powered shopping tool in the past month, per NielsenIQ's 24 September 2026 release. AI product recommendations reached 20% of consumers and AI personal shopping assistants 16%.
Trust stops short of checkout, as consumers report to Gartner. A Gartner survey published 27 May 2026 found at most 11% of U.S. consumers would let AI make the purchase decision, even for household supplies. Among consumers who used generative AI for a recent purchase, 54% had to double-check all the information it gave them. The jury's still out on checkout by AI agent.
Traffic is moving anyway. Adobe measured visits from AI tools to U.S. retail sites up 693.4% in the 2025 holiday season, and forecasts a further 130% rise in 2026. Salesforce attributed $262 billion of global holiday revenue, 20% of retail sales, to AI and agents, and found shoppers referred from AI search converted nine times more often than those arriving from social media feeds. Our AI traffic report measures that referral channel directly.
Holiday shopping season ecommerce sales
The holiday shopping season is where online retail peaks every year. Adobe counted $257.8 billion spent online in the U.S. from 1 November to 31 December 2025, up 6.8%. Cyber Monday alone took $14.25 billion and Black Friday $11.8 billion. Consumer electronics was the largest category at $59.8 billion, up 8.2%, with discounts peaking at 30.9% off list price. Adobe's 2026 forecast is $275.1 billion, up 6.7%, with Cyber Monday at $15.1 billion.
Salesforce sees a wider window: $1.29 trillion of online sales globally in November and December 2025, up 7%, and $294 billion in the U.S., up 4%. The Black Friday statistics report breaks out the five days from Thanksgiving to Cyber Monday, house by house.
How ecommerce sales are tracked
Official series come from surveys of retailers, straight from the horse's mouth. The Census Bureau samples U.S. retail firms each quarter and counts a sale as e-commerce when the buyer places the order or agrees the price online, including through a mobile app; payment can happen anywhere. The ONS and NBS run similar monthly surveys. Census publishes its margins: the Q2 2026 growth figure carries plus or minus 0.9 points.
Private houses read transaction data. Adobe and Salesforce measure checkout events, conversion, average order value and social media traffic on the ecommerce sites that use their software, and Worldpay reads payments it processes. That's digital commerce measured at the checkout. Those figures arrive within days of a sales event, so they're the ones news desks quote, and they cover only each vendor's own clients.
Brands tracking their own ecommerce websites across multiple channels use web analytics, panel and scraping tools. Our ecommerce analytics tools ranking compares 12 platforms, the pricing intelligence ranking covers competitor price tracking, and the retail market intelligence guide explains where each data source fits.
What the ecommerce forecasts leave out
Most headline figures skip three things:
- The line between channels. An order placed online and collected in one of the retailer's physical stores counts as e-commerce in the Census series, so a chain that books click-and-collect as store sales reports a lower online share than Census would count.
- Services and travel, which EMARKETER and Census leave out of retail totals. The subscription economy of streaming and software sits outside retail series altogether.
- B2B, the largest part of the e-commerce market in UNCTAD's data and absent from most consumer forecasts.
Small sellers are under the radar as well. Census samples firms, marketplaces report GMV across millions of sellers, neither Census nor ONS publishes a line for sales through social media storefronts, and few series isolate the small business share. Our small business statistics report covers the firm counts and survival rates behind that long tail.
Delivered for your site and your byline. Hosting here is optional.
Frequently asked questions
What are the latest statistics on global e-commerce?
EMARKETER puts worldwide retail ecommerce sales at $6.419 trillion in 2025, 20.5% of all retail. UNCTAD put total business e-commerce, B2B included, near $27 trillion in 2022. More than 3 billion people shopped online in 2025.
How much does ecommerce make per year?
Global ecommerce sales of retail goods reached $6.419 trillion in 2025 per EMARKETER. In the U.S., the Census Bureau counted $340.2 billion in Q2 2026 alone, an annualized pace above $1.3 trillion.
How big of an industry is ecommerce?
Counted as retail only, about a fifth of everything sold in shops and online worldwide, per EMARKETER's ecommerce stats. Counted with B2B, UNCTAD's figure for 2022 was around four times the 2025 retail total.
Which country uses e-commerce the most?
China has the largest e-commerce market, 15,972.2 billion yuan of online retail sales in 2025. By share of retail, the UK leads large economies at 28.8% in August 2026, ahead of China's 26.1%.
Is ecommerce increasing or decreasing?
Increasing. U.S. e-commerce sales rose 12.2% in the year to Q2 2026, China's online retail sales rose 8.6% in 2025, and UK online sales value rose 8.9% in the year to August 2026.
Is e-commerce still profitable in 2026?
The largest platforms are still growing fast: Amazon's net sales rose 12% to $716.9 billion in 2025 and Shopify's GMV rose 29%. For individual stores, returns at 19.3% of online sales and $56.1 billion of global fraud losses come straight out of margins.
Will AI replace e-commerce?
Current evidence says no. 51% of U.S. consumers used an AI shopping tool in a month, per NielsenIQ, but at most 11% would let AI make the purchase decision, per Gartner.
Bottom line
E-commerce took 17.1% of U.S. retail and 20.5% of global retail in the latest counts, and it's still growing faster than retail as a whole. The UK and China sit higher, near 29% and 26%. Any figure for the size of global e-commerce needs its scope attached, because the published numbers run from $1.29 trillion to $36 trillion depending on what's counted.
The costs sit underneath the growth. Seven in ten carts are abandoned, a fifth of online purchases come back, and fraud losses are rising faster than sales. Mobile commerce, social media and AI assistants are where the next share points come from, and the official statistics offices are the place to check every one of them.
Ecommerce platforms, agencies and payment providers publish reports like this one as link bait and client briefs.
A report on your topic for a blog page, gated content or a lead magnet.
Written for your client and published under their brand, with my name left off.
Your report on marketintelligencetools.com, with 2 to 3 CTAs carrying your sponsored links.
Default terms: the report is yours to publish, and I keep the right to republish it on this site behind a gate, outside Google's index.
The statistics offices, filings and trackers behind each ecommerce figure, and the totals still to come
Official series: census.gov (Quarterly Retail E-Commerce Sales, Q2 2026, 18 August 2026), fred.stlouisfed.org (Census series ECOMPCTSA), ons.gov.uk (retail sales, August 2026), stats.gov.cn (December 2025 retail release), ec.europa.eu (Eurostat e-commerce statistics for individuals), unctad.org (Business e-commerce sales and the role of online platforms, 13 June 2024), trade.gov (eCommerce Sales & Size Forecast) and ftc.gov (fraud testimony, March 2026).
Company filings: businesswire.com (Amazon fourth-quarter 2025 results; MercadoLibre 2025 results), sec.gov (Shopify fourth-quarter 2025 release; Walmart fiscal 2026 Form 10-K) and cdn.sea.com (Sea Limited 2025 results).
Research houses and trackers: emarketer.com (Worldwide Retail Ecommerce Forecast 2025; digital buyers; U.S. social commerce, 9 December 2025), news.adobe.com (2025 holiday recap and 2026 forecast), salesforce.com (2025 holiday data), worldpay.com (Global Payments Report 2026), juniperresearch.com (E-commerce Fraud Prevention 2025-2030), dhl.com (2026 E-Commerce Trends Report), baymard.com (cart abandonment list).
AI shopping: nielseniq.com (24 September 2026), gartner.com (27 May 2026) and newsroom.accenture.com (January 2022).
Returns and loyalty: nrf.com (returns reports for 2023 and 2025), hbr.org (October 2014), bain.com (2000 and 2020) and info.bondbrandloyalty.com (Loyalty Reports 2023 and 2024).
Every figure was checked against its source on 15 October 2026. The Census Bureau reports Q3 2026 on 19 November 2026, and its historical quarterly tables were read through FRED's republication of the same series.