Instagram statistics 2026: 3 billion monthly users, 2 billion daily and Reels on half the ads
 By Jan Suski. I go deep on every review, checking every number against its source and digging up details other coverage misses, a habit from six years of SEO and link building for tech companies. Bylines at Surfer, Brand24, and Senuto. How the scoring works.
The numbers Instagram users, usage, ads and engagement, checked 1 October 2026
Meta's 2 billion daily count from July 2026 equals two-thirds of the 3 billion monthly count the company gave in September 2025.
Reels took 46% of US Instagram time and more than half of its ads in 2025, so every other placement, Feed and Stories included, now shares the smaller half of ad inventory.
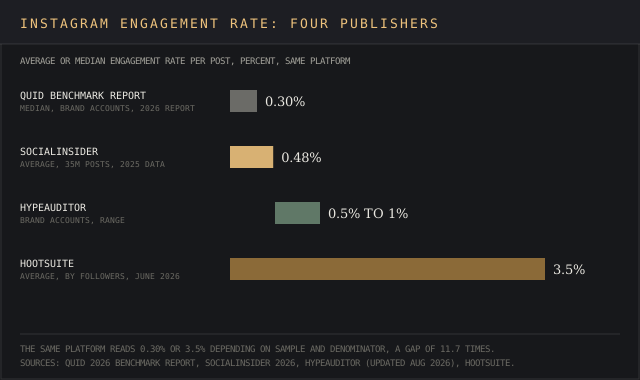
Engagement stats differ 11.7-fold between publishers, so compare an account's rate only against a benchmark built on the same denominator.
Instagram reached 2 billion daily actives in the second quarter of 2026, Meta said on its Q2 2026 earnings call on 29 July. Ten months earlier, Mark Zuckerberg and Adam Mosseri put monthly active users at 3 billion, per TechCrunch. Both numbers come straight from the horse's mouth. Only Meta can audit them.
The independent trackers measure narrower things. Pew Research Center counts 50% of US adults on the app, DataReportal counts 481 million Instagram users reachable with ads in India alone, and four engagement benchmarks put the same platform anywhere from 0.30% to 3.5%. Each publisher draws its data from a different base, so the stats rarely line up.
These are the Instagram statistics published between January 2025 and September 2026, each with its publisher and date, for marketers planning budgets, agencies reporting to clients and analysts sizing Instagram's user base against other social media platforms. Stats checked 1 October 2026.
How many people use Instagram in 2026
Meta reported 3 billion monthly active users on 24 September 2025, triple the 1 billion it announced in June 2018, per Axios. Mosseri told TechCrunch that "almost all of our growth has been driven by DMs, Reels, and recommendations." The platform has added 2 billion Instagram users in seven years. CNBC reported the 2 billion mark in December 2021 from internal data, which Meta declined to confirm.
The daily number came hot off the press on 29 July 2026: Instagram "reached 2 billion daily actives." Across Facebook, Instagram, WhatsApp and Messenger, 3.6 billion people used at least one of the company's apps each day.
On the same call, Meta said Instagram's global time spent grew double digits year over year on Feed and Reels recommendations, and that every public piece of Instagram content in Reels and Feed now runs through a large language model. Threads, Instagram's text-based social network, crossed 500 million monthly actives.
Instagram active users against other social media platforms
Survey data puts the platform third among social media platforms. DataReportal's Digital 2026 Mid-Year Global Update found 54.6% of internet users aged 16 and over used Instagram in the past month, behind Facebook at 56.3% and YouTube at 55.3%. Leave out China and Russia and Instagram moves to second, at 71.4%. The world had 6.12 billion internet users at the time.
Pew's 2025 survey of 5,022 US adults ranks the social network third of the social media platforms it tracks: YouTube 84%, Facebook 71%, Instagram 50%, TikTok 37% and WhatsApp 32%, per Pew Research Center. Instagram's share was 40% in 2021, a 10-point rise in four years.
Instagram users by country: India leads with 481 million
India has the most Instagram users. Meta's ad tools reached 481 million users there in October 2025, up 89.5 million (+22.9%) in a year and equal to 32.8% of the population, per DataReportal's Digital 2026 India report. India's audience is growing ahead of the curve: no other top-four market added more than 16 million.
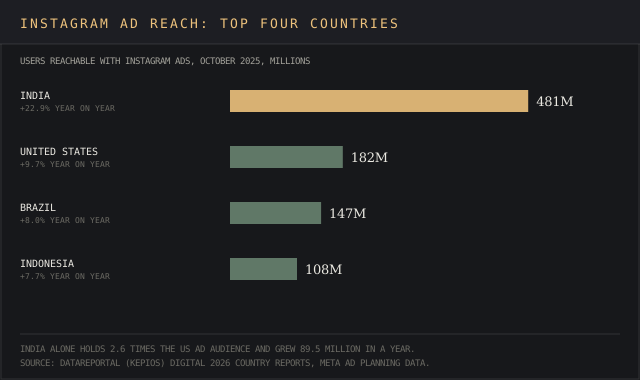
Instagram ad audiences in millions, October 2025, from DataReportal's tracking of Meta's ad tools:
- India: 481 million, +22.9%
- United States: 182 million, +9.7%, per DataReportal's US report
- Brazil: 147 million, +8.0%, per DataReportal's Brazil report
- Indonesia: 108 million, +7.7%, per DataReportal's Indonesia report
Most Instagram users live outside the US. In January 2025 the US held 172 million of the 1.74 billion users in Instagram's global ad audience, per DataReportal's Instagram stats page, so 90.1% of reachable accounts sat elsewhere. Ad reach counts the accounts businesses can access through Meta's ad tools, a narrower base than the 3 billion monthly active users.
Instagram demographics: age, gender distribution and Gen Z
The platform's audience skews young, and age is the sharpest split in the data. Of adult Instagram users reachable with ads in January 2025, 31.6% were 18 to 24 and 33.0% were 25 to 34, per DataReportal, so 81.9% of the adult ad audience was under 45. The 18 to 34 age range made up 64.6%, and just 8.5% was 55 or older. Marketers should check those splits against their target audience before they pick the platform for a campaign.
Gender distribution flips by market. Worldwide, the ad audience was 52.7% male and 47.3% female in January 2025. In the US, 54.5% of the adult ad audience is female, while in India 69.7% is male, per DataReportal's country reports.
Gen Z and younger audiences in the US
Eight in ten US adults aged 18 to 29 are Instagram users, against 19% in the 65-plus age group, Pew found. Women are likelier users than men (55% to 44%), and Hispanic (62%), Asian (58%) and Black adults (54%) likelier than White adults (45%).
A majority of Gen Z teens in the 13 to 17 age group use it daily. Pew's December 2025 survey of 1,458 Americans aged 13 to 17 found about six in ten are Instagram users and 55% use it every day, including 31% several times a day and 12% almost constantly.
20% of US adults regularly get news on Instagram, per Pew's social media and news fact sheet, from an August 2025 survey. Marketers building segments from these age and gender cuts can follow the method in our guide to demographic market segmentation.
Instagram usage: time spent, Instagram Reels and Instagram Stories
Reels accounted for 46% of the time US users spent in the Instagram app in 2025, up from 37% in 2024, per Sensor Tower's app tracking data reported by CNBC in January 2026. More than half of Instagram's ads ran in Reels in 2025, against 35% the year before.
eMarketer's July 2026 social users and time spent forecast puts US adult Instagram users at 25 minutes a day watching video content on the app in 2026. Prime Video viewers spend 24 minutes a day on that streaming service, which eMarketer places behind Instagram.
Short-form video is also how Instagram content travels across the app. For Instagram Reels, Zuckerberg said on the Q4 2024 call that "Reels are already reshared over 4.5 billion times a day." In October 2025 he put Reels' annual revenue run rate at over $50 billion across Meta's apps, per Tubefilter.
Instagram Stories
Instagram Stories passed 500 million daily users in January 2019, the last daily figure Meta has published for the format, per Neowin. The format has run under the radar since, but Stories still earned 24.6% of Instagram's worldwide ad revenue in 2024. Feed took the lion's share, 53.7%, more than double Stories, per eMarketer.
Instagram posts, photos and hashtags
Brands post fewer photos and more video. Socialinsider counted 7 single-image Instagram posts a month per brand account in 2025, down from 10 in 2024, while Reels posts rose from 6 to 8 and carousel posts from 4 to 5, per its tracking of 447,613 pages. Instagram also capped hashtags at five per post in December 2025, and Mosseri said a few specific tags beat a long generic list, per TechBuzz.
Instagram engagement rate benchmarks run from 0.30% to 3.5%
Four publishers measure the average engagement rate on Instagram and land 11.7 times apart. Hootsuite, for one, divides likes, comments, shares and saves by followers. The gap comes from what each one divides by and whose accounts it samples, so two publishers are rarely on the same page. Brand posts, creator posts and influencers' posts each produce a different average, so marketers should match the benchmark to the account type.
| Publisher | Engagement rate | Sample and method |
|---|---|---|
| Quid 2026 report | 0.30% median per post (0.36% a year earlier) | 150 companies per industry |
| Socialinsider 2026 | 0.48% average (0.60% in 2025) | 35 million posts from 447,613 pages, 2025 data |
| HypeAuditor updated August 2026 | 0.5% to 1% | Brand accounts |
| Hootsuite June 2026 | 3.5% (Reels 2.8%) | Likes, comments, shares and saves divided by followers |
Carousels lead by format. Socialinsider's 2026 data puts carousels at 0.55%, Reels at 0.52% and single photos at 0.37%, with images down 17% year over year. That gives Reels 1.4 times the engagement rate of a single image in Socialinsider's statistics. A carousel stacks several visually appealing frames in one post, and on the same business accounts it beat single photos by 0.18 percentage points.
Brands are also creating less, and fewer posts mean fewer chances at reach. Quid's median brand posts 3.69 times a week, the second straight annual decline, so a brand creating fewer posts with more frames per post matches what the data rewards.
Audience growth by follower count
Smaller accounts grow faster, which matters for influencers creating a following from scratch. Socialinsider measured 2025 follower growth of 22% for accounts with 1,000 to 5,000 followers and 11.25% for accounts with 100,000 to 1 million, down from 38% and 27% in 2024. Audience growth slowed in every tier.
Instagram influencers and the most-followed Instagram account
Instagram influencers with small followings post the highest engagement. HypeAuditor's benchmarks for Instagram influencers by follower tier:
- Nano, 1,000 to 5,000 followers: 4% to 5%
- Micro, 5,000 to 50,000: about 2.5% to 3.5%
- Mid-tier, 50,000 to 500,000: about 2% to 2.5%
- Macro and mega, 500,000 and up: about 1% to 2%
A 0.5% to 1% rate is par for the course for a brand's Instagram account on the same data, a fraction of what a nano content creator earns per post. Marketers comparing influencers for a brand deal should read rates against the tier, since a 2% rate is weak for a nano account and strong for a mega one. Brands that jump on the bandwagon of deals with influencers are buying that gap.
US influencer marketing spend across all platforms reached $10.52 billion in 2025, per an eMarketer forecast.
Cristiano Ronaldo and the celebrities with the most followers
| Instagram account | Followers, 1 October 2026 |
|---|---|
| 686,595,952 | |
| @cristiano (Cristiano Ronaldo) | 679,191,890 |
| @leomessi (Lionel Messi) | 516,905,463 |
| @selenagomez (Selena Gomez) | 403,024,674 |
Instagram's own account leads, and Cristiano Ronaldo has the highest follower count of any person, 7.4 million behind @instagram. Each figure, in the hundreds of millions, was read from the profile page on 1 October 2026.
Instagram revenue and advertising statistics
Meta doesn't report Instagram revenue separately. The last worldwide figures came from Meta's own filing in the FTC antitrust case: $17.9 billion in ad revenue in 2019, $22 billion in 2020 and $32.4 billion in 2021, per Social Media Today. That's 81% growth in two years.
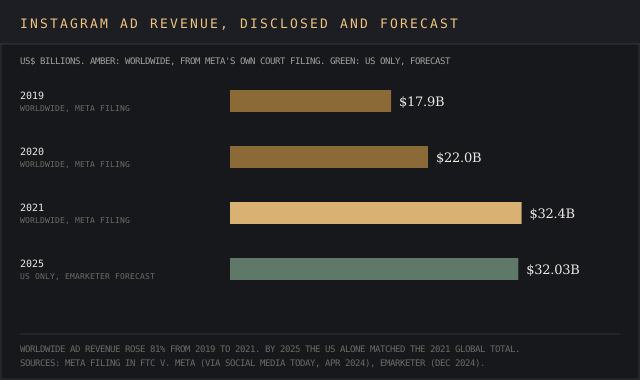
eMarketer forecast Instagram US ad revenue at $32.03 billion for 2025, up 24.4%, which makes it 50.3% of Meta's US ad revenue against 7.7% in 2015, per its December 2024 forecast. It put ad revenue per US user at $223 on Instagram, $191 on Facebook and $109 on TikTok.
Shopping sits further down the app's priorities. Instagram removed the Shop tab from its home screen in February 2023, per TechCrunch, in the same redesign that moved Reels out of the center spot in the navigation bar.
Advertising prices are rising across Meta's apps. In Q2 2026, ad impressions grew 14% and the average price per ad 12% year over year, on total revenue of $60.8 billion. For the wider market, see our advertising industry statistics and search engine marketing statistics. Analytics platforms for tracking rivals' Instagram ads are ranked in our ad intelligence software list.
How to see Instagram statistics: Instagram insights and the official Instagram API
Instagram offers insights to any public Instagram account, personal or professional, for any period within the past 90 days, per the Instagram Help Center. On instagram.com, select Dashboard, then Insights for a professional account or Your dashboard for a personal one, and choose Account or Content. Insights give access to account statistics in aggregate or one post at a time.
Insights date range and access rules
- Preset date range options cover the last 7, 14, 30 or 90 days.
- A custom range needs start and end dates at least 1 day apart, inside the past 90 days.
- Audience demographics in insights need a preset timeframe and over 100 viewers reached or engaged.
- Switching to a private account removes access to insights; switching back within 90 days restores the history.
The official Instagram API needs a business account
Software access to Instagram insights runs through the official Instagram API, which serves business and creator accounts and is the route analytics tools use to read those accounts. Meta shut the Instagram Basic Display API, the route third-party apps used to access personal accounts, on 4 December 2024, per its developer blog.
Any analytics dashboard pulling data from the official Instagram API needs a professional account, a business or creator profile, on the other end. Agencies onboarding clients should convert personal accounts to business accounts before connecting a tracking tool.
Agencies tracking clients' accounts against competitors, and the visibility of each brand in Reels, usually buy a social suite with an analytics dashboard.
Access to history matters most, and each service sets its own backfill. Brand24 and Sprout Social backfill 30 days by default, and Mention's historical add-on excludes Instagram and LinkedIn, per our social listening pricing report. Plan costs per service are broken down in Sprout Social pricing, Brandwatch pricing, Brand24 pricing and Sprinklr pricing.
For a shortlist, the social listening tools ranking scores the field, and Brandwatch vs Sprout Social compares seat costs and contract terms for two of the suites.
Frequently asked questions
Is Instagram gaining or losing popularity?
Gaining, on Meta's counts: 3 billion monthly Instagram users in September 2025, 2 billion daily in Q2 2026 and double-digit growth in time spent. New installs slowed, though. Downloads fell 19.0% in 2025 to 762.3 million, per AppTweak's download tracking.
How many times was Instagram downloaded in 2025?
762.3 million times across iOS and Android, second behind ChatGPT's 845.3 million and ahead of TikTok's 545.8 million, per AppTweak's download statistics. ChatGPT's rise is tracked in our AI statistics.
Who has the most followers on Instagram?
The @instagram account, with 686.6 million followers on 1 October 2026. Cristiano Ronaldo, at 679.2 million, is the most-followed person.
Bottom line
Instagram's scale statistics come from the company itself and keep rising: 3 billion monthly Instagram users, 2 billion daily, and Reels at 46% of US time spent. Independent tracking firms agree on the direction and split on rates, with engagement benchmarks spread from 0.30% to 3.5% and Instagram influencers posting 1% to 5% by tier. Survey data still ranks it third among the world's social media platforms, behind Facebook and YouTube.
Read between the lines of these stats before marketers use them in a plan for clients. Engagement rates depend on the denominator, audience size on the ad-reach base, and gender split on the country. India's 481 million reachable users and the US's $32.03 billion in forecast ad revenue point to different plans, one built for reach and one for spend.
Sources by publisher, and the Instagram figures Meta last published years ago
User and usage counts are Meta's: the Q2 2026 earnings call (29 July 2026), the Q4 2024 call, and the 3 billion announcement of 24 September 2025 reported by TechCrunch. Instagram ad revenue for 2019 to 2021 is Meta's own FTC filing, via Social Media Today. Country reach, age and gender splits are DataReportal's (Kepios): the Digital 2026 India, United States, Brazil and Indonesia reports, the Digital 2026 Mid-Year Global Update and its Instagram stats page.
US survey data is Pew Research Center's: adults (20 November 2025), teens (9 December 2025) and the social media and news fact sheet (August 2025 survey).
Time spent and ad placement are Sensor Tower's via CNBC (20 January 2026) and eMarketer's (December 2024 ad revenue forecast, July 2026 time spent forecast). Engagement benchmarks are Quid's 2026 report, Socialinsider's 2026 benchmarks, HypeAuditor's (updated August 2026) and Hootsuite's (June 2026); download counts are AppTweak's.
Follower counts were read from each profile on 1 October 2026, and every figure on this page was checked that day. Meta's last Instagram revenue figure covers 2021, from the FTC case, and its last daily Stories count dates from January 2019.