Streaming statistics 2026: 49% of US TV time and 2.24 billion subscriptions
 By Jan Suski. I go deep on every review, checking every number against its source and digging up details other coverage misses, a habit from six years of SEO and link building for tech companies. Bylines at Surfer, Brand24, and Senuto. How the scoring works.
The numbers US and global streaming, checked 4 October 2026
The free platform's 14.2% of US TV time beats Netflix (7.8%) and Disney's streaming apps (4.7%) combined.
Omdia's subscriptions grew 17.6% in 2025 while revenue grew 13.5%, because cheap ad tiers and telco bundles drove much of the growth.
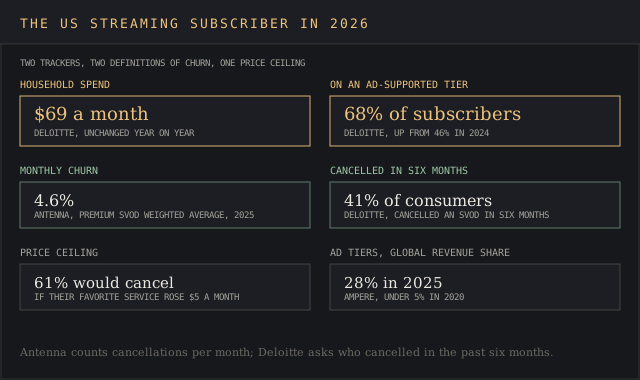
With 68% of subscribers on an ad tier and 61% ready to cancel a favorite service over a $5 rise, price increases have little room left.
Streaming took 49.0% of all US television viewing in July 2026, a record in Nielsen's July 2026 Gauge, released on 10 September. YouTube alone held 14.2%. Broadcast and cable together held 38.2%.
Worldwide, Omdia counted 2.24 billion online video subscriptions at the end of 2025, and online video revenue of $176 billion passed pay TV's $170 billion for the first time. Subscriber data got thinner in the same stretch: Netflix stopped publishing member counts in 2025, and Disney followed for Disney+ and Hulu.
This page covers video streaming data on viewing share, subscribers, revenue, ad tiers, prices and churn, plus music and live game streaming. Every figure carries a direct link to the body that published it, with its date, and one section shows where Nielsen, Antenna, Deloitte and five research houses disagree.
How big the streaming industry is in 2026
Omdia's June 2026 data puts online video revenue at $176 billion, up 13.5%, against $170 billion for pay TV, down 4%; both cover subscriptions and rentals and exclude advertising. Online video holds 68.4% of 3.3 billion TV and video subscriptions worldwide. Omdia adds that platforms now try to maximize revenue from the customers they already have.
Ampere Analysis sizes the video industry from the subscription side, in data published by Broadband TV News on 30 March 2026:
- $157.1 billion in subscription revenue in 2025, up 14%, from $50 billion in 2020.
- $177 billion once streaming advertising is added.
- Half of all subscription revenue earned in the United States.
- Over $200 billion forecast for 2030.
PwC's Global Entertainment & Media Outlook 2026-30 projects $4.2 trillion in entertainment and media revenue by 2030, growing 3.4% a year. Video games add $213.9 billion in 2026 from 3.70 billion players on Newzoo's count; our video game industry statistics cover those players in depth.
Share of US TV time: streaming reaches 49.0%
Nielsen's Gauge charts measure each platform's share of all TV viewing in US homes from panel samples plus big data from smart TVs, with monthly charts back to January 2025. In July, streaming usage rose 3.4% on June and its share reached 49.0%. Broadcast held 19.5% and cable 18.7%, leaving 12.8% for other uses of the screen, such as games that viewers play on a console. The charts on this page set those shares against each other.
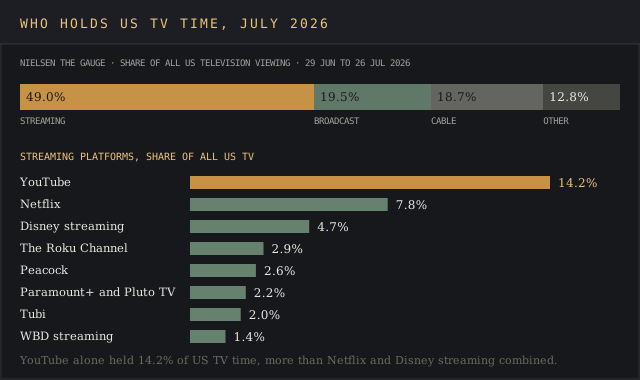
The platform took the lion's share, up from 13.8% in June and 12.8% in June 2025 per Nielsen's June Gauge. Our YouTube statistics cover its revenue, creator channels and audience engagement in depth.
The Media Distributor Gauge rolls all of a company's channels and apps into one number:
| Media distributor | Share of US TV, July 2026 | Of which streaming |
|---|---|---|
| YouTube | 14.2% | 14.2% |
| NBCUniversal and Versant | 9.2% | 2.6% (Peacock) |
| Disney | 8.9% | 4.7% |
| Netflix | 7.8% | 7.8% |
| Fox | 7.8% | 2.0% (Tubi) |
| Paramount | 6.5% | 2.2% (Paramount+, Pluto TV) |
| Warner Bros. Discovery | 5.3% | 1.4% |
Live events moved the smaller numbers. Peacock rose 15% in a month to 2.6%, carried by Love Island USA's 4.9 billion viewing minutes and Telemundo's World Cup simulcasts. Tubi, Pluto TV and The Roku Channel run free ad-supported (FAST) channels for viewers who won't pay, and Nielsen notes it adjusted Tubi's measurement in June 2026.
Subscriber counts: who still publishes them
Netflix reported 301.63 million paid memberships at the end of 2024 in its Q4 2024 letter, then stopped quarterly counts. Its Q2 2026 letter, which Netflix files with the SEC, describes an audience "approaching 1B people". Disney stopped from fiscal 2026, calling the figures "less meaningful", Variety reported.
| Service | Last published count | As of | Status |
|---|---|---|---|
| Netflix | 301.63 million paid memberships | Dec 2024 | Stopped |
| Disney+ | 128 million subscribers | Jun 2025 | Stopped |
| Disney+ and Hulu | 183 million subscriptions | Jun 2025 | Stopped |
| Peacock | 48 million paid subscribers | Jun 2026 | Quarterly |
| Spotify Premium | 300 million subscribers | Jun 2026 | Quarterly |
Disney's counts come from its Q3 fiscal 2025 release, Peacock's from Comcast's Q2 2026 results. Warner Bros. Discovery gives no HBO Max total, only that about 40% of subscribers use the ad tier. With less access to counts, analysts use viewing data and revenue to understand who's winning, and to check performance against a rival's last published date.
Revenue and profit at the big streaming services
Netflix judges its performance on revenue and operating margin, and Q2 2026 brought profit to services that lost money for years:
- Netflix: $12.56 billion in revenue, up 13.4%, at a 33.4% margin; ad revenue roughly doubles to about $3 billion in 2026.
- Disney+ and Hulu: $712 million operating income on $5.53 billion revenue, from $329 million a year earlier, per Disney's Q3 fiscal 2026 letter.
- Warner Bros. Discovery: $3.08 billion streaming revenue and $512 million adjusted EBITDA, per its Q2 release, with its Paramount Skydance merger pending.
- Peacock: a first quarterly profit, $189 million in EBITDA.
- Spotify: €4.8 billion revenue, up 14%, and €655 million operating income.
Netflix allocated just over 5% of its 2026 content budget to live programming for about 1% of view hours, yet live events produced six of its top 10 sign-up days in five years. The devil's in the details: live content wins sign-ups, series keep them. Daily players of its Netflix Playground kids games app also tripled since April.
Ad tiers, prices and the $5 ceiling
Three video on demand (VOD) models share the market:
- SVOD: a monthly fee, with or without ads.
- AVOD: advertising VOD, free to watch, paid for by ads.
- FAST: free ad-supported linear channels delivered over the internet.
Deloitte's Digital Media Trends 2026 survey data from 3,575 US consumers shows 68% of SVOD subscribers on an ad-supported tier, up from 46% in 2024. Ampere puts ad tiers at 28% of global subscription revenue in 2025, from under 5% in 2020.
Netflix's US plan features and prices on its help center, checked 4 October 2026:
- Standard with ads: $8.99 a month, 1080p quality.
- Standard: $19.99 a month, ad-free, downloads on two devices.
- Premium: $26.99 a month, four screens at once.
Ads earn less per subscriber. Disney's subscription revenue rose 15% to $4.72 billion, 9 points of it attributed to more subscribers, while ad revenue rose 3% to $851 million as impressions grew 8% and rates fell 4%. Cheaper inventory is par for the course when every streamer sells ads at once, so Netflix now sells programmatic access to Pause Ads and gives advertisers AI features to plan, optimize and report campaign performance.
US digital video ad spend passes $80 billion in 2026, up 11%, per the IAB; our advertising industry statistics break it down by channel. Consumers set the limit: Deloitte found the average subscribing household spending $69 a month, unchanged, and 61% willing to cancel their favorite service over a $5 rise.
Churn: 4.6% a month, or 41% in six months
Antenna, a subscription analytics firm, puts the weighted average monthly churn rate for US premium SVOD at 4.6% in 2025, flat or lower year on year in 7 of 11 months. Subscribers grew 7%, down from 12% in 2024, and Q4 delivered 31% of the category's gross additions.
Deloitte's 2026 report finds 41% of consumers cancelled an SVOD in six months and 22% cancelled and came back. Plenty cut their losses after a finale and rejoin for the next season, and streamers dealing with that pattern lean on win-back offers.
The metrics behind these charts:
- MAU and DAU: monthly and daily active users. Spotify had 777 million MAU in June 2026.
- Churn: the share of subscribers who cancel in a set period. At 4.6% a month, a subscription lasts about 22 months on average.
- ARPU, which Netflix called ARM: revenue per paid membership per month.
- LTV: revenue per subscriber over the full tenure. CAC: marketing spend per new paying subscriber.
- Engagement: Netflix's measure of value, over 97 billion hours in H1 2026, up 2%.
Why the published estimates diverge
Five research houses give five sizes for one market, $654 billion apart. The definitions explain most of it.
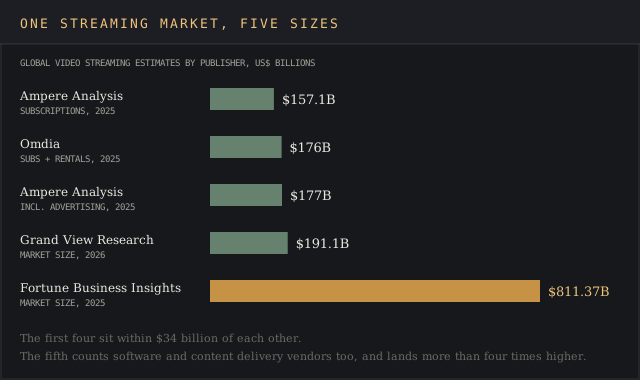
| Publisher | Figure | Year | What it counts |
|---|---|---|---|
| Ampere Analysis | $157.1 billion | 2025 | Subscriptions only |
| Omdia | $176 billion | 2025 | Subscriptions and rentals |
| Ampere Analysis | $177 billion | 2025 | Subscriptions plus advertising |
| Grand View Research | $191.1 billion | 2026 | Market size; $416.8 billion by 2030 |
| Fortune Business Insights | $811.37 billion | 2025 | Adds software and content delivery vendors such as IBM |
Regions clash too: Grand View Research gives North America 31.3% of 2024 and Fortune Business Insights 37.7% of 2025, while Ampere attributes half of 2025 subscription revenue to the US alone. Quote the house, year and scope together; the trend research tools we rank face the same challenges.
Viewing share against subscriber counts
Netflix's 301.63 million are paying accounts, its "1B people" counts everyone sharing them, and Nielsen's 7.8% covers US TV screens only. Read between the lines and all three hold at once, each as complete as its scope allows. Netflix still publishes weekly Top 10 charts for more than 90 countries, though its full view-hours update goes annual from 2027.
Nielsen's own method change
Nielsen delayed its February 2026 Gauge after streaming clients objected to DASH survey data, fielded with NORC at the University of Chicago, that would expand the cable and broadcast audience, Variety reported on 20 March. The method update arrives this fall. Keep an eye on the first Gauge under it, because a jump that month may send trend lines back to square one.
Music streaming stats: 300 million Spotify Premium subscribers and 837 million music subscriptions
The recorded music industry earned $31.7 billion in 2025, up 6.4%, in the IFPI Global Music Report 2026. Paid subscription revenue grew 8.8% and made up 52.4% of music revenue, from 837 million paying music subscribers, and Taylor Swift topped IFPI's list of the biggest-selling artists for a record sixth time.
Spotify's Q2 2026 results show 300 million Premium subscribers, up 9%, and 777 million monthly active users, up 12%. New features that quarter included Running Mode, which turns playlists into running sessions, and Reserved, which holds two concert tickets for artists' most dedicated fans. Music fans create and follow playlists; artists and labels pitch songs to editorial playlists for reach and monitor which playlists send listeners.
Music charts start with a counting rule. Spotify's support page for artists counts a song stream once it plays for 30 seconds, applies the same rule to music videos, and credits a song on two releases to both totals.
Artists, managers and label teams get access to these stats in Spotify for Artists. Spotify Charts ranks songs and artists by country, and Billboard's charts rank them by week.
Discovery starts on social feeds. Deloitte found 52% of fans name social platforms as their main discovery route, 73% among Gen Z, so label teams monitor trending topics and clips before songs reach playlists. Our social listening ranking covers tools that track music artists across those channels, and our podcast industry statistics cover audio's other half.
Live and game streaming stats: Twitch, Kick and your favorite streamer
Streams Charts, a live streaming analytics firm that also posts its charts on X (formerly Twitter), counted a record 31.43 billion hours watched in Q2 2026, up 8%:
- YouTube: over 15.5 billion hours, 49.5% of live viewing.
- Twitch: about three times Kick's hours, down from roughly five times a year earlier.
- Twitch peak: over 4.4 million concurrent viewers at Summer Game Fest.
- Twitch esports: hours up 22.4%.
- Kick: hours up 7.6% on the quarter.
Twitch carried no official World Cup feeds, so game players and esports fans kept it level. Its public API returns a live viewer count for every stream, which any analytics tracker can read through the same API, and Streams Charts' Chrome stats extension shows a favorite streamer's audience on Twitch channels. Our esports industry statistics cover the tournaments behind those peaks.
Streaming data in the computing sense: counting billions of events
Every figure here, down to Twitch's live viewer counter, starts as streaming data in the computing sense: endless view and pause events from media players that systems count on arrival, with no storage budget to keep them all. Each event lands in a log with metadata such as a timestamp, a title ID and a country, and that metadata decides where it counts. The algorithms:
- HyperLogLog counts distinct viewers: the 2007 Flajolet paper estimates counts beyond 109 at about 2% error with 1.5 kilobytes.
- Count-Min Sketch tracks frequencies in sublinear space, from Cormode and Muthukrishnan in 2004.
- Reservoir sampling keeps random samples from a stream of unknown length, per Vitter in 1985.
- Bloom filters test if an event was seen before, allowing false positives, from Bloom in 1970.
- Sliding windows keep stats on recent data only, such as the last 28 days.
- Hoeffding trees learn incrementally from fast streams, per Domingos and Hulten in 2000.
A 2% error on a billion devices costs kilobytes; an exact count needs memory for every ID. Our guide to real-time market intelligence shows how analytics teams use live content data. These methods were developed for data too large to store whole.
Where all the data points come from
The full list of sources behind this streaming data: Nielsen (June and July 2026 Gauges), company files from Netflix, Disney, Comcast, Warner Bros. Discovery and Spotify (July and August 2026), Omdia, Ampere, Grand View Research and PwC (March to June 2026), plus Deloitte, Antenna, IFPI, IAB and Streams Charts. Each figure is attributed to its publisher and date in the text and charts above; check the source for updates before reuse, since trackers update monthly.
Related pages for teams working with this data:
- Our notes on data source attribution cover citing a number without stripping its definition.
- For websites and domains, our Similarweb review explains how traffic is modeled.
- The media monitoring tools ranking covers trackers that follow coverage of a launch.
- The audience segmentation tools ranking helps teams create viewer segments and understand who sits behind each share.
Where each streaming figure was read, and three counts no longer published
Viewing share: Nielsen's July 2026 Gauge (released 10 September 2026) and June 2026 Gauge (nielsen.com), plus Variety's report of 20 March 2026 on the delayed February Gauge (variety.com).
Company filings: Netflix's Q4 2024 and Q2 2026 shareholder letters (sec.gov) and its US plans page (help.netflix.com, read 4 October 2026); Disney's Q3 fiscal 2025 release (thewaltdisneycompany.com) and Q3 fiscal 2026 letter (s206.q4cdn.com); the Warner Bros. Discovery Q2 2026 release (sec.gov); Comcast's Q2 2026 results (cmcsa.com); and Spotify's Q2 2026 results of 4 August 2026 (newsroom.spotify.com) and stream-counting page for artists (support.spotify.com).
Market size and subscriptions: Omdia (omdia.tech.informa.com, 1 June 2026), Ampere Analysis through Broadband TV News (broadbandtvnews.com, 30 March 2026), Grand View Research (grandviewresearch.com), Fortune Business Insights (fortunebusinessinsights.com), PwC's Global Entertainment & Media Outlook 2026-30 (pwc.com, 22 June 2026) and Newzoo (newzoo.com).
Subscribers, churn and ads: Deloitte's Digital Media Trends 2026 release of 25 March 2026 and full report (deloitte.com), Antenna's Q1 2026 State of Subscriptions (antenna.live) and the IAB (iab.com, 5 May 2026).
Music, live streaming and the counting algorithms: the IFPI Global Music Report 2026 (globalmusicreport.ifpi.org), Streams Charts' Q2 2026 report (streamscharts.com, 9 July 2026), and the papers by Flajolet and co-authors (dmtcs.episciences.org), Cormode and Muthukrishnan (link.springer.com), Vitter, Bloom, and Domingos and Hulten (dl.acm.org).
The figures were read from these sources on 4 October 2026. Three counts appear in none of them: Netflix's paid memberships after December 2024, Disney+ and Hulu subscribers after June 2025, and a subscriber total for HBO Max.
Frequently asked questions
Is streaming growing or declining?
Growing, more slowly. Omdia counted 17.6% more subscriptions in 2025, Antenna 7% growth in US premium SVOD, and Nielsen data shows a record 49.0% of US TV time in July 2026.
What is the #1 streaming service right now?
By US TV viewing, YouTube, which tops Nielsen's charts at 14.2% in July 2026. Among paid video services, Netflix leads at 7.8% and an audience of nearly 1 billion people.
Who are the big 3 of streaming?
On Nielsen's July 2026 Gauge: YouTube 14.2%, Netflix 7.8% and Disney's streaming apps 4.7%.
Is YouTube growing or declining?
Growing. Its share of US TV viewers' time rose from 12.8% in June 2025 to 14.2% in July 2026, and its live hours rose 14.8% in Q2.
What are the statistics for streaming services?
For 2026: 49.0% of US TV time, 2.24 billion subscriptions, $157.1 billion in subscription revenue and 4.6% monthly churn.
What are the top 5 biggest streaming services?
By US TV share in July 2026 on Nielsen's charts: YouTube 14.2%, Netflix 7.8%, Disney 4.7%, The Roku Channel 2.9% and Peacock 2.6%.
What is the #1 live streaming platform?
YouTube, with 49.5% of live hours watched in Q2 2026 in Streams Charts data, while Twitch drew about three times Kick's hours.
Bottom line
Streaming holds the biggest share of US television time, with ad-supported access the fastest-growing way in, and its largest piece belongs to a free platform supported by ads. The paid services now make money, Peacock included, but they've stopped showing subscriber counts, so viewing share and revenue are what's left to track.
The figures disagree because they measure different things: accounts against people, subscriptions against all revenue, monthly against six-month churn. Quote each with its publisher, year and scope.